TanHef Ranks ScreenerTanHef Ranks Screener: A Numeric Compass to Market Tops and Bottoms
█ Simple Explanation:
The TanHef Ranks Screener illustrates the ‘TanHef Ranks’ indicator, designed to signal 'buy low and sell high' opportunities through numerical rankings. Larger numbers represent stronger signals, with negative numbers indicating potential ‘buy’ opportunities and positive numbers suggesting possible ‘sell’ moments.
█ TanHef Ranks Indicator:
View the TanHef Ranks Indicator description prior to using the screener.
█ Ticker Input Method:
Add tickers to the screener using a text area list in a CSV-styled (comma-separated values) list and/or through individual ticker inputs. The text area supports various delimiters, including commas, spaces, semicolons, apostrophes, and new lines. To ensure the expected exchange is used, the exchange prefix should be included when using a text area list.
█ Pair Configuration:
Quickly set up specific trading pairs by comparing tickers to the chart’s symbol or a specified input. This feature is useful for identifying opportunities in obscure trading pairs.
█ Total Combined Average Rank:
Compute the average rank of all tickers to highlighting overall market opportunities. When combined with the 'Pair Configuration' settings, it allows for identifying specific opportunities where one ticker may present a better trading opportunity relative to others.
█ Screener Display Settings:
Customize color-coded rank thresholds, text details, toggle visibility of numerical rankings, and other display settings. Hover over tickers for tooltips with full ticker names and rankings, ideal for small fonts or screens.
█ Alerts:
Set up alerts for individual ticker ranks or total average ranks. To avoid inconsistent or excessive alerts within a short period of time due to TradingView's alert frequency limits, it is recommended to use alerts set to occur at bar close to guarantee alerts. For immediate alerts, consider configuring them directly within the ‘TanHef Ranks’ indicator for better reliability. For the most up-to-date suggestions, hover the tooltips within the indicator’s alert settings.
█ Additional Clarity:
All the settings and functionality are described in detail within the tooltips beside each setting in the indicator’s settings. Hover over each tooltip for comprehensive explanations and guidance on how to configure and use the screener effectively.
█ How To Access:
Follow the Author's Instructions below to get access.
CSV

How To Input CSV List Of Symbol Data Used For ScreenerExample of how to input multiple symbols at once using a CSV list of ticker IDs. The input list is extracted into individual ticker IDs which are then each used within an example screener function that calculates their rate of change. The results for each of the rate of changes are then plotted.
For code brevity this example only demonstrates using up to 4 symbols, but the logic is annotated to show how it can easily be expanded for use with up to 40 ticker IDs.
The CSV list used for input may contain spaces or no spaces after each comma separator, but whichever format (space or no space) is used must be used consistently throughout the list. If the list contains any invalid symbols the script will display a red exclamation mark that when clicked will display those invalid symbols.
If more than 4 ticker IDs are input then only the first 4 are used. If less than 4 ticker IDs are used then the unused screener calls will return `float(na)`. In the published chart the input list is using only 3 ticker IDs so there are only 3 plots shown instead of 4.
NOTICE: This is an example script and not meant to be used as an actual strategy. By using this script or any portion thereof, you acknowledge that you have read and understood that this is for research purposes only and I am not responsible for any financial losses you may incur by using this script!

Cloud Levels [Import Price Levels]This script allows you to import TA and price levels from an external source. For example, you may do some TA on a different software but want to import it to TradingView. Or you may have a script or bot that calculates levels for you end-of-day. Or you may be part of a community that provides TA and levels. There are many different reasons why you may want to import levels from an external source.
All you need is a source for the data. The data format shouldn't really matter since it can usually be converted fairly easily to a custom format. Information about the necessary format can be found below.
The script currently supports:
Labelled lines with customs style and colors
Boxes / zones with custom fill color and borders
Fibonacci ratios
In the plans:
Channel support
Trend lines
The input format looks like this:
FIGURE 1 - Lines with labels
Columns: ,,,,;
Example: 1677724019999,3976.50,Label text,255/255/0/125,sol
FIGURE 2 - Boxes
Columns: ,,,,,,,;
Example: 1686715971428,4430.18,1686773561538,4409.52,68/98/194/15,1,1,153/204/255/204
FIGURE 3 - Fibonacci ratios
Columns: ,,,,,,,,
Example: 1656649151300,4588.75,1656649151300,3639,dot,1,3,0.236|0.382|0.5|0.618|0.706|0.786|0.886,170/200/255/76|170/200/255/76|170/200/255/76|0/255/0/76|255/153/0/76|255/153/0/76|255/153/0/76
*ratios and ratio colors are separated by '|'
*RGBA colors must look like this: 255/255/0/125, each value separated by '/'
*Line style s must be one of these values: dsh, sol or dot (dashed, solid or dotted)
Separate each item within the same figure with a semicolon (;), e.g for two labelled lines: 1677724019999,3976.50,Label text,255/255/0/125,sol;1677724019999,4026,Label text 2,255/255/0/125,sol
Only put a semicolon at the end if there is a new item after it.
Finally, put all figures together with '§' separator between each figure/category, in the correct order:
1 - Lines with labels
2 - Boxes
3 - Fibonacci ratios
The result looks like this for the examples above:
1677724019999,3976.50,Label text,255/255/0/125,sol§1686715971428,4430.18,1686773561538,4409.52,68/98/194/15,1,1,153/204/255/204§1656649151300,4588.75,1656649151300,3639,dot,1,3,0.236|0.382|0.5|0.618|0.706|0.786|0.886,170/200/255/76|170/200/255/76|170/200/255/76|0/255/0/76|255/153/0/76|255/153/0/76|255/153/0/76
An incorrect format will give you errors.
With basic programming skills you can create a simple tool to convert your data to this format, that's what I do. If needed, I may be able to provide a customized converting tool for this, PM if interested.

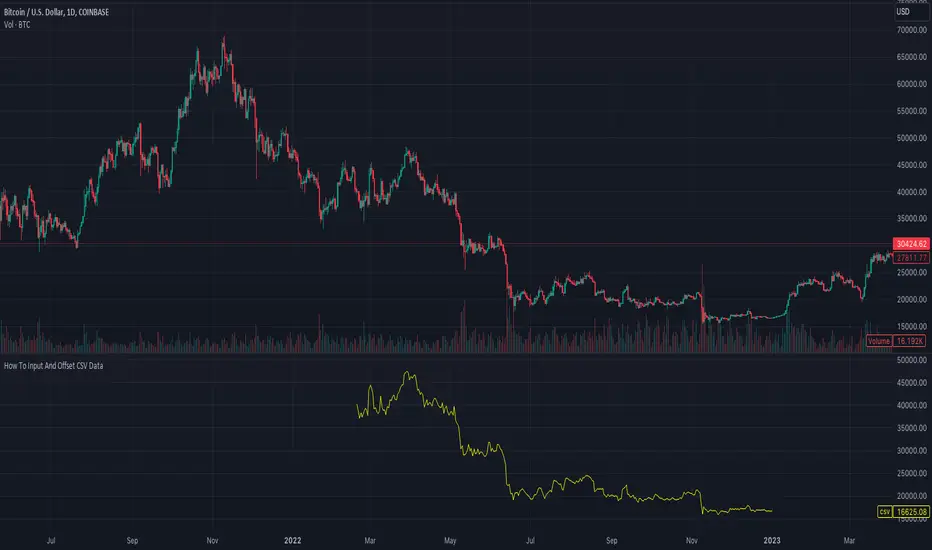
How To Input And Offset CSV DataExample method of how to use an input text area to import, offset, and plot CSV data using an array. Note that when using this method there is a limit of 4096 total characters per input.
For working with data sets larger than 4096 total characters an alternative method of pasting CSV data directly within the script can be seen below :
NOTICE: This is an example script and not meant to be used as an actual strategy. By using this script or any portion thereof, you acknowledge that you have read and understood that this is for research purposes only and I am not responsible for any financial losses you may incur by using this script!
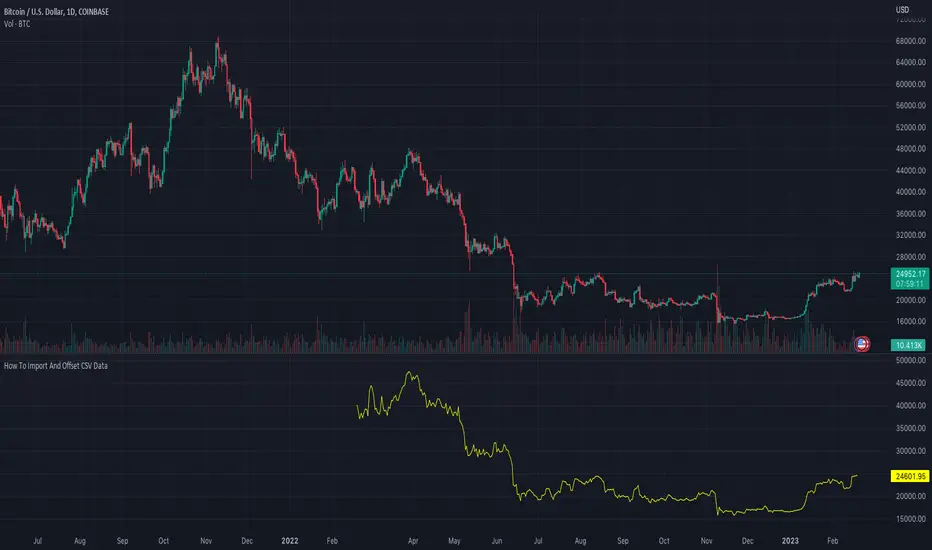
How To Import And Offset CSV DataExample method of how to import, offset, and plot CSV data using an array.
NOTICE: This is an example script and not meant to be used as an actual strategy. By using this script or any portion thereof, you acknowledge that you have read and understood that this is for research purposes only and I am not responsible for any financial losses you may incur by using this script!