Trade-o-Scope: Plot Custom Data v2Meet — a major tool upgrade for plotting your own data on TradingView charts. Simple and intuitive input format, large volume limits, and robust plotting for your own datasets — forecasts, backtests, or external data and model outputs.
You can apply/overlay other indicators from the TradingView catalog (such as Bollinger Bands, RSI, etc.) on top of custom data charts. The indicator you want to overlay must support selecting an input data source — i.e., have a dropdown where you can choose as the source.
🧩 How to use
Simply select and copy two columns — with dates and values — from your spreadsheet (Excel, Google Sheets, etc.) and paste them into the indicator’s input field. The indicator will automatically process the input and plot your data on the chart.
Example data:
Date XYZ_value
2025-10-08 84.57
2025-10-01 80.66
2025-09-24 86.24
2025-09-17 84.76
📅 Supported date format
The indicator recognizes standard international date formats commonly used in spreadsheets and data exports.
• ISO 8601 — "YYYY-MM-DD" or "YYYY-MM-DDThh:mm:ss"
2025-10-13
2025-10-13 14:30
2025-10-13 14:30:00
2025-10-13T14:30
2025-10-13T14:30:00
• RFC 2822 — "DD MMM YYYY" or "DD MMM YYYY hh:mm:ss"
13 Oct 2025
13 Oct 2025 14:30
13 Oct 2025 14:30:00
The time part is optional — if omitted, midnight (00:00:00) is assumed.
By default, all date–time values are interpreted in the exchange timezone of the chart’s symbol, but you can select a different data timezone in the indicator settings if needed.
💡 Supported value format
Integers (e.g., 12345, -12345)
Decimals (e.g., 1234.56, -1234.56)
The decimal separator must be a dot (.)
Thousands separators are not supported
⚙️ Advanced Features
Value Multiplier — scale your values by a chosen factor.
Formatting Options — display values as price, percentage, or volume.
Conditional Coloring — automatically change plot color based on thresholds.
Plot Style Selection — choose from line, histogram, area, or column plots.
Additional Visual References — enable fixed horizontal lines for better visual interpretation.
📝 General Notes
Maximum input size: 40,960 characters (~1,500–3,000 rows depending on format). If an error occurs after pasting data, simply remove a few rows until it disappears.
Customdata

csv_series_libraryThe CSV Series Library is an innovative tool designed for Pine Script developers to efficiently parse and handle CSV data for series generation. This library seamlessly integrates with TradingView, enabling the storage and manipulation of large CSV datasets across multiple Pine Script libraries. It's optimized for performance and scalability, ensuring smooth operation even with extensive data.
Features:
Multi-library Support: Allows for distribution of large CSV datasets across several libraries, ensuring efficient data management and retrieval.
Dynamic CSV Parsing: Provides robust Python scripts for reading, formatting, and partitioning CSV data, tailored specifically for Pine Script requirements.
Extensive Data Handling: Supports parsing CSV strings into Pine Script-readable series, facilitating complex financial data analysis.
Automated Function Generation: Automatically wraps CSV blocks into distinct Pine Script functions, streamlining the process of integrating CSV data into Pine Script logic.
Usage:
Ideal for traders and developers who require extensive data analysis capabilities within Pine Script, especially when dealing with large datasets that need to be partitioned into manageable blocks. The library includes a set of predefined functions for parsing CSV data into usable series, making it indispensable for advanced trading strategy development.
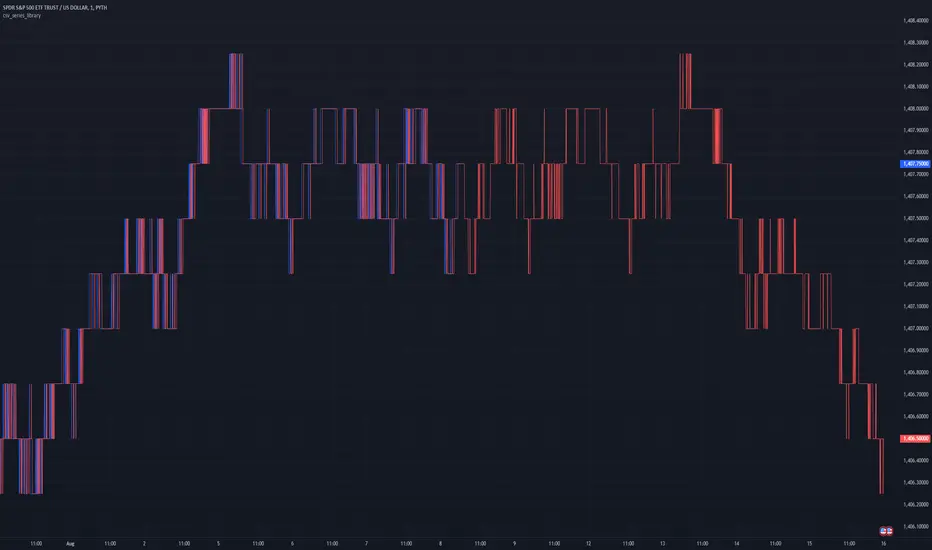
Example Implementation:
CSV data is transformed into Pine Script series using generated functions.
Multiple CSV blocks can be managed and parsed, allowing for flexible data series creation.
The library includes comprehensive examples demonstrating the conversion of standard CSV files into functional Pine Script code.
To effectively utilize the CSV Series Library in Pine Script, it is imperative to initially generate the correct data format using the accompanying Python program. Here is a detailed explanation of the necessary steps:
1. Preparing the CSV Data:
The Python script provided with the CSV Series Library is designed to handle CSV files that strictly contain no-space, comma-separated single values. It is crucial that your CSV file adheres to this format to ensure compatibility and correctness of the data processing.
2. Using the Python Program to Generate Data:
Once your CSV file is prepared, you need to use the Python program to convert this file into a format that Pine Script can interpret. The Python script performs several key functions:
Reads the CSV file, ensuring that it matches the required format of no-space, comma-separated values.
Formats the data into blocks, where each block is a string of data that does not exceed a specified character limit (default is 4,000 characters). This helps manage large datasets by breaking them down into manageable chunks.
Wraps these blocks into Pine Script functions, each block being encapsulated in its own function to maintain organization and ease of access.
3. Generating and Managing Multiple Libraries:
If the data from your CSV file exceeds the Pine Script or platform limits (e.g., too many characters for a single script), the Python script can split this data into multiple blocks across several files.
4. Creating a Pine Script Library:
After generating the formatted data blocks, you must create a Pine Script library where these blocks are integrated. Each block of data is contained within its function, like my_csv_0(), my_csv_1(), etc. The full_csv() function in Pine Script then dynamically loads and concatenates these blocks to reconstruct the full data series.
5. Exporting the full_csv() Function:
Once your Pine Script library is set up with all the CSV data blocks and the full_csv() function, you export this function from the library. This exported function can then be used in your actual trading projects. It allows Pine Script to access and utilize the entire dataset as if it were a single, continuous series, despite potentially being segmented across multiple library files.
6. Reconstructing the Full Series Using vec :
When your dataset is particularly large, necessitating division into multiple parts, the vec type is instrumental in managing this complexity. Here’s how you can effectively reconstruct and utilize your segmented data:
Definition of vec Type: The vec type in Pine Script is specifically designed to hold a dataset as an array of floats, allowing you to manage chunks of CSV data efficiently.
Creating an Array of vec Instances: Once you have your data split into multiple blocks and each block is wrapped into its own function within Pine Script libraries, you will need to construct an array of vec instances. Each instance corresponds to a segment of your complete dataset.
Using array.from(): To create this array, you utilize the array.from() function in Pine Script. This function takes multiple arguments, each being a vec instance that encapsulates a data block. Here’s a generic example:
vec series_vector = array.from(vec.new(data_block_1), vec.new(data_block_2), ..., vec.new(data_block_n))
In this example, data_block_1, data_block_2, ..., data_block_n represent the different segments of your dataset, each returned from their respective functions like my_csv_0(), my_csv_1(), etc.
Accessing and Utilizing the Data: Once you have your vec array set up, you can access and manipulate the full series through Pine Script functions designed to handle such structures. You can traverse through each vec instance, processing or analyzing the data as required by your trading strategy.
This approach allows Pine Script users to handle very large datasets that exceed single-script limits by segmenting them and then methodically reconstructing the dataset for comprehensive analysis. The vec structure ensures that even with segmentation, the data can be accessed and utilized as if it were contiguous, thus enabling powerful and flexible data manipulation within Pine Script.
Library "csv_series_library"
A library for parsing and handling CSV data to generate series in Pine Script. Generally you will store the csv strings generated from the python code in libraries. It is set up so you can have multiple libraries to store large chunks of data. Just export the full_csv() function for use with this library.
method csv_parse(data)
Namespace types: array
Parameters:
data (array)
method make_series(series_container, start_index)
Namespace types: array
Parameters:
series_container (array)
start_index (int)
Returns: A tuple containing the current value of the series and a boolean indicating if the data is valid.
method make_series(series_vector, start_index)
Namespace types: array
Parameters:
series_vector (array)
start_index (int)
Returns: A tuple containing the current value of the series and a boolean indicating if the data is valid.
vec
A type that holds a dataset as an array of float arrays.
Fields:
data_set (array) : A chunk of csv data. (A float array)
Trade-o-Scope: Plot Custom DataTrade-o-Scope team presents the "Plot Custom Data" indicator.
"Plot Custom Data" is designed to help you bring the custom timeseries data and plot it on the chart.
Motivation:
In the fast-evolving landscape of markets, traders often find themselves analyzing a plethora of data sources, specialized market information, various metrics, etc. While TradingView offers a rich catalog of instruments and market data, there are cases where traders rely on unique data sources, custom calculations, bespoke metrics, or refined analytics that demand visualization.
In some cases, traditional visualization approaches for custom data like plotting in Excel or other platforms may suffice for some. still, we really adore all the great features TradingView supercharts have - native scaling and scrolling, drawing, combining data, applying indicators and strategies on top of any series, etc. The ability to play with custom data on TradingView charts is just a whole new level compared to any alternatives.
With this indicator, we aim to empower traders to effortlessly bring their custom data to the familiar and friendly interface of the TradingView chart.
Basic Features:
Easy Data Input : Simply paste your numerical timeseries data, whether it's a column from Excel, Google Sheets, CSV file, or multiline text from any text editor.
Flexible Configuration : Define the order of values, starting date, and timeframe to match the specifications of your data.
Custom appearance : Personalize your chart by assigning a title to your data and selecting colors for the plot.
Advanced Features:
Value Multiplier : Set a multiplier for the provided values to adjust their scale as needed.
Formatting Options : Customize the display format of values on the chart, whether as price, percentage, or volume.
Conditional Coloring : Define conditions for changing the plot color based on a specific threshold.
Plot Style Selection : Choose from various plot styles such as line, histogram, area, columns, and more, to best visualize your data.
Additional Visual References : Enhance data analysis by activating fixed horizontal lines to aid in visual interpretation.
Leverage TradingView Capabilities : Seamlessly apply various indicators from the TradingView catalog, such as Bollinger Bands or RSI, onto your custom data chart for comprehensive analysis.
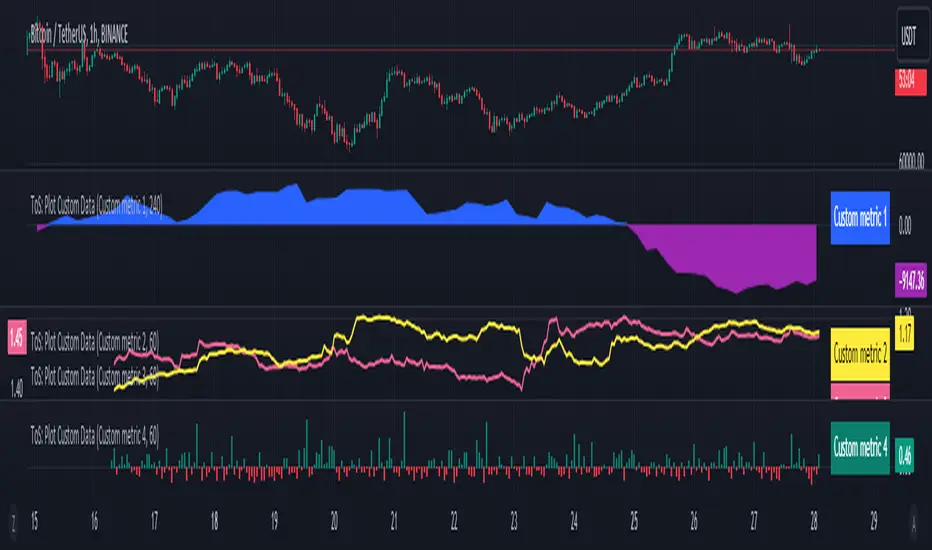
Chart Example:
On the chart above, you can observe several "Plot Custom Data" indicators added to demonstrate what your custom data can look like and how multiple indicators can be combined, as well as the indicator configuration screen.
How it works:
The "Plot Custom Data" indicator processes the list of values provided on the configuration form and converts it into data points to be plotted on the chart. To determine the timing of plotting each value, the indicator uses the configured 'starting date' and 'timeframe'. This means the indicator will always plot each subsequent value from your list at the distance of one timeframe from the previous one.
Limitations and Best Practices:
1) The way timeseries data is inputted on the "Plot Custom Data" indicator configuration page, leverages a standard input text field. This input type has a limited character capacity, approximately 4000-4400 symbols. Therefore, the timeseries data cannot exceed this limit.
Let's illustrate this with an example.
Suppose you have a column in Excel that you wish to plot using the indicator. Consider the first 5 rows of values in your column:
| -123.45
| -43.5
| 3.12
| 9.6
| 146.78
To calculate the total symbols used, we need to account for the minus sign, numbers, decimal point, and two invisible symbols at the end of each line, which helps structure the text into multiple lines. So, in total, these 5 rows will use:
row_1 + row_2 + row_3 + row_4 + row_5 = 9 + 7 + 6 + 5 + 8 = 35 symbols or 7 symbols per row on avarage.
If we assume the remaining data follows a similar format, we can estimate the number of rows that can be inputted on the indicator configuration page:
from ~4000 / 7 = 571 rows
to ~4400 / 7 = 628 rows
The right approach to overcome this limitation is to reduce the number of symbols representing each value as much as possible. In our example, consider dropping all decimals, which would lead to an average of 5.4 symbols per row and allow for up to ~800 rows to be accepted by the input field.
If your data primarily consists of large values such as thousands or millions, consider dividing it by a multiplier like x1000 and activating the same multiplier in the indicator settings.
For example, instead of storing values like 5,620,000 in your list, store the value 562 and activate an x10,000 multiplier in the configuration to display the original value on the chart.
It is also possible to combine multiple indicators on one chart and split a larger list of values between them. If you need to display significantly more custom data on charts, you may contact us in DM to find\develop a proper solution.
2) Another important consideration is to ensure that all your data aligns with the selected timeframe in the indicator configuration.
Remember, you provide only the values to the indicator without corresponding dates. Dates are calculated automatically by the indicator based on the configured starting date and chosen timeframe. This means the indicator will always plot each subsequent value from your list at the distance of one timeframe from the previous one.
Here's an example:
Suppose you have a timeseries with 'date' and 'value' columns and a timeframe of 30 minutes:
# | date | value
--|---------------------------|---------
1 | 2024-01-01 11:30:00 | -241.45
2 | 2024-01-01 12:02:13 | -11.56
3 | 2024-01-01 13:00:00 | 21.87
..
..
6 | 2024-01-01 14:30:00 | 19.6
7 | 2024-01-01 15:00:00 |
8 | 2024-01-01 15:30:00 | 46.78
Rows 1-3 represent bad practice:
Row 2 is not precisely aligned with the timeframe, as it has a time of 12:02:13 instead of the expected 12:00:00. This won't cause errors, but the plot will show this value at 12:00:00.
Row 3 has a 1-hour difference from Row 2, which poses a real problem. As the indicator doesn't know the actual dates, it expects Row 3 to be 30 minutes later than Row 2, so it will plot 21.87 at 12:30:00 instead of the actual 13:00:00. And the rest of the values from your list will have offset on the chart as well.
Rows 6-7 represent the correct approach to overcome gaps in your data:
If, for some reason, there is no value for 15:00:00 in the original dataset, adding an empty Row 7 ensures each subsequent row is located 30 minutes from the previous one. The indicator will treat the empty row correctly, not plotting anything at this date on the chart, but will plot a line connecting the value of 19.6 from Row 6 with the value of 46.78 from Row 8.
How to use:
1) Add the "Plot Custom Data" indicator to the chart.
Voila! You'll see the plot based on the default timeseries values list and settings.
2) Paste your numerical timeseries data.
Define the order of values, starting date, and timeframe.
Assign a title to your data and select colors for the plot.
Voila! You'll see the plot based on your timeseries values list and settings.
3) Customize the indicator's settings:
Set a values multiplier if needed.
Specify the appropriate format for the values (price, percentage, or volume).
Choose whether to change the plot color based on conditions.
Select the plot style.
Add horizontal lines.
4) Explore your data, apply additional indicators and strategies from the TradingView catalog, or develop your own scripts using Pine.