Financial Astrology Mercury-Ceres Longitude AngleMercury-Ceres angle indicator represent the geocentric longitude angular distance between Mercury and Ceres with labels on the angles that indicate the astrological aspects used by financial astrologers to determine the energy trigger points. In financial astrology, Mercury rules trading, market transactions, commerce and negotiation. Ceres rules growing, nutrition, food, farming and prosperity.
For any Mercury aspects indicator we recommend to use 4H resolution to locate the exact aspect culmination, this is because Mercury moves at an average geocentric speed of 1.6 degrees per day.
Due to the limited UTF (Unicode Transformation Format) support of classical astrology aspects symbols, we needed to use a custom subset to represent the aspects:
⊚ = 0 degrees angle (conjuction)
⧌ = 30 degrees angle (semi-sextile)
⧆ = 45 degrees angle (semi-square)
⨺ = 60 degrees angle (sextile)
⧄ = 90 degrees angle (square)
⨹ = 120 degrees angle (trine)
⧇ = 135 degrees angle (sesqui-square)
◭ = 150 degrees angle (quincunx or inconjunct)
⚇ = 180 degrees angle (opposition)
Note: The Mercury-Ceres longitude angle indicator is based on an ephemeris array that covers years 2010 to 2030, prior or after this years the data is not available, this daily ephemeris are based on UTC time so in order to align properly with the price bars times you should set UTC as your chart timezone.
Cycleanalysis

Financial Astrology Moon Helio SpeedThis indicator provides Moon heliocentric speed. In Financial Astrology is said that planets above average speed produce fast effect (more volatility) and planets below average speed produce sustained effect, this is because at fastest speed the duration of astrological aspects will be shorter. However, we are creating this heliocentric indicators for all planets daily speed in order to help researchers to perform exploratory analysis and determine their own trading rules.
Note: The Moon heliocentric speed indicator is based on an ephemeris array that covers years 2010 to 2030, prior or after this years the data is not available, this daily ephemeris are based on UTC time so in order to align properly with the price bars times you should set UTC as your chart timezone.
Financial Astrology Venus Helio SpeedThis indicator provides Venus heliocentric speed. In Financial Astrology is said that planets above average speed produce fast effect (more volatility) and planets below average speed produce sustained effect, this is because at fastest speed the duration of astrological aspects will be shorter. However, we are creating this heliocentric indicators for all planets daily speed in order to help researchers to perform exploratory analysis and determine their own trading rules.
Note: The Venus heliocentric speed indicator is based on an ephemeris array that covers years 2010 to 2030, prior or after this years the data is not available, this daily ephemeris are based on UTC time so in order to align properly with the price bars times you should set UTC as your chart timezone.

Ehlers Instantaneous Phase Dominant Cycle [CC]The Instantaneous Phase Dominant Cycle was created by John Ehlers (Stocks & Commodities V. 18:3 (16-27)) and this is one of many similar indicators that I will be publishing from Ehlers in the next few months that calculate the current dominant cycle period. The cycle period can be used in multiple ways but generally this means that if the stock is currently at a low then the current cycle period will tell you when the next lowest low will get hit or vice versa. This is also useful for using this cycle period as an input for other indicators to provide a very good adaptive length. Let me know how you wind up using these indicators in your daily trading. I have included the same buy and sell signals from my recent Hilbert Transform and so buy when the line turns green and sell when it turns red.
Let me know if there are any other indicators you would like to see me publish!

Financial Astrology Juno LongitudeJuno is the 4th largest object in terms of mass in the asteroid belt between Mars and Jupiter, this asteroid is not widely used by financial astrologers but as was demonstrated in our research with Ceres and Vesta, the objects in the asteroid belt seems to be very important for the trend forecast. The zodiacal energy of this objects cannot be ignored for an accurate analysis. Based in BTCUSD historical price data we calculated the daily trend (buy/sell) during the periods where Juno was transiting across different zodiac signs and we found some significant patterns:
INDEX:BTCUSD
Bullish zodiac signs
From 387 days located in Scorpio, price increased 62% of the days.
From 316 days located in Capricorn, price increased 64% of the days.
From 300 days located in Sagittarius, price increased 56% of the days.
From 435 days located in Libra, price increased 55% of the days.
Bearish zodiac signs
From 200 days located in Taurus, price decreased 56% of the days.
From 152 days located in Virgo, price decreased 58% of the days.
Note: The Juno longitude indicator is based on an ephemeris array that covers years 2010 to 2030, prior or after this years the data is not available, this daily ephemeris are based on UTC time so in order to align properly with the price bars times you should set UTC as your chart timezone.

Fast Fourier Transform (FFT) FilterDear friends!
I'm happy to present an implementation of the Fast Fourier Transform (FFT) algorithm. The script uses the FFT procedure to decompose the input time series into its cyclical constituents, in other words, its frequency components , and convert it back to the time domain with modified frequency content, that is, to filter it.
Input Description and Usage
Source and Length :
Indicates where the data comes from and the size of the lookback window used to build the dataset.
Standardize Input Dataset :
If enabled, the dataset is preprocessed by subtracting its mean and normalizing the result by the standard deviation, which is sometimes useful when analyzing seasonalities. This procedure is not recommended when using the FFT filter for smoothing (see below), as it will not preserve the average of the dataset.
Show Frequency-Domain Power Spectrum :
When enabled, the results of Fourier analysis (for the last price bar!) are plotted as a frequency-domain power spectrum , where “power” is a measure of the significance of the component in the dataset. In the spectrum, lower frequencies (longer cycles) are on the right, higher frequencies are on the left. The graph does not display the 0th component, which contains only information about the mean value. Frequency components that are allowed to pass through the filter (see below) are highlighted in magenta .
Dominant Cycles, Rows :
If this option is activated, the periods and relative powers of several dominant cyclical components that is, those that have a higher power, are listed in the table. The number of the component in the power spectrum (N) is shown in the first column. The number of rows in the table is defined by the user.
Show Inverse Fourier Transform (Filtered) :
When enabled, the reconstructed and filtered time-domain dataset (for the last price bar!) is displayed.
Apply FFT Filter in a Moving Window :
When enabled, the FFT filter with the same parameters is applied to each bar. The last data point of the reconstructed and filtered dataset is used to build a new time series. For example, by getting rid of high-frequency noise, the FFT filter can make the data smoother. By removing slowly evolving low-frequency components (including non-periodic constituents), one can reveal and analyze shorter cycles. Since filtering is done in real-time in a moving window (similar to the moving average), the modified data can potentially be used as part of a strategy and be subjected to other technical indicators.
Lowest Allowed N :
Indicates the number of the lowest frequency component used in the reconstructed time series.
Highest Allowed N :
Indicates the number of the highest frequency component used in the reconstructed time series.
Filtering Time Range block:
Specifies the time range over which real-time FFT filtering is applied. The reason for the presence of this block is that the FFT procedure is relatively computationally intensive. Therefore, the script execution may encounter the time limit imposed by TradingView when all historical bars are processed.
As always, I look forward to your feedback!
Also, leave a comment if you'd be interested in the tutorial on how to use this tool and/or in seeing the FFT filter in a strategy.

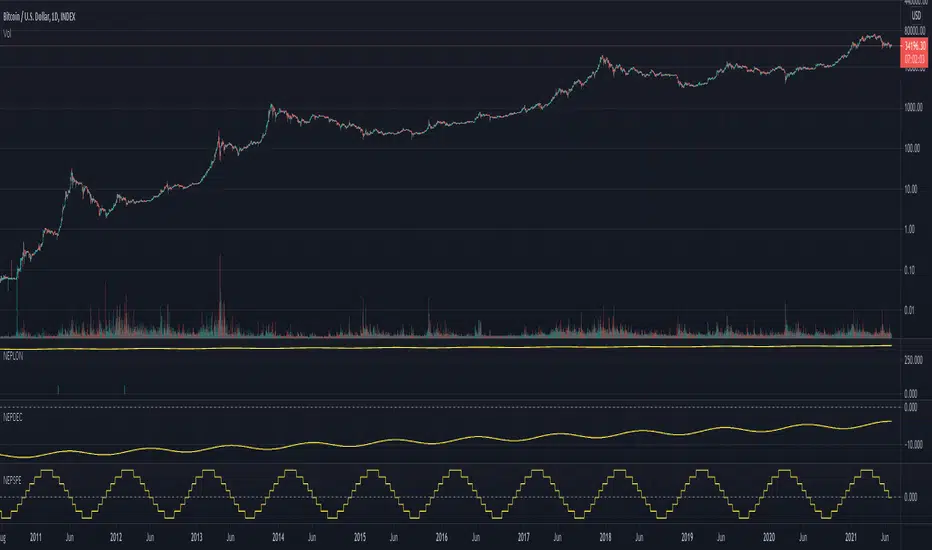
Financial Astrology Vesta SpeedVesta (asteroid) speed provides a good indicator to determine the periods of dominant trend. During the direct phase (when the speed accelerated and reached highest value) we can observe that BTCUSD experienced a clear trend, perfect for trend following. In the contrary when speed was decelerating and speed started backward motion (retrograde) the price was in congestion experiencing sideways moves. From statistical analysis we noted that when Vesta speed is in direct motion 56% of the days resulted in price increase. When speed was stationary (starting to move retrograde) we observed that in 62% of the days the price decreased, finally, during retrograde phase in 54% of the days the price increased. Is clear that direct motion also offers more bullish days. However, in the statistical analysis of the price is not evident the price change range, with visual exploration in the chart is clear that when Vesta speed is in direct phase the range of the price is wider, therefore, direct motion provides the most interesting risk/reward ratio.
Note: The Vesta speed indicator is based on an ephemeris array that covers years 2010 to 2030, prior or after this years the data is not available, this daily ephemeris are based on UTC time so in order to align properly with the price bars times you should set UTC as your chart timezone.

Financial Astrology Vesta DeclinationVesta (asteroid) declination show a strong correlation with the BTCUSD trend, we can clearly see that all the most intense bullish periods have occurred when declination was moving from South to Node direction (when the slope is positive). In the events when declination was moving toward North and have penetrated the zero declination boundary (horizontal dashed line) we can observe a periods where price experienced more volatility.
Note: The Vesta declination indicator is based on an ephemeris array that covers years 2010 to 2030, prior or after this years the data is not available, this daily ephemeris are based on UTC time so in order to align properly with the price bars times you should set UTC as your chart timezone.

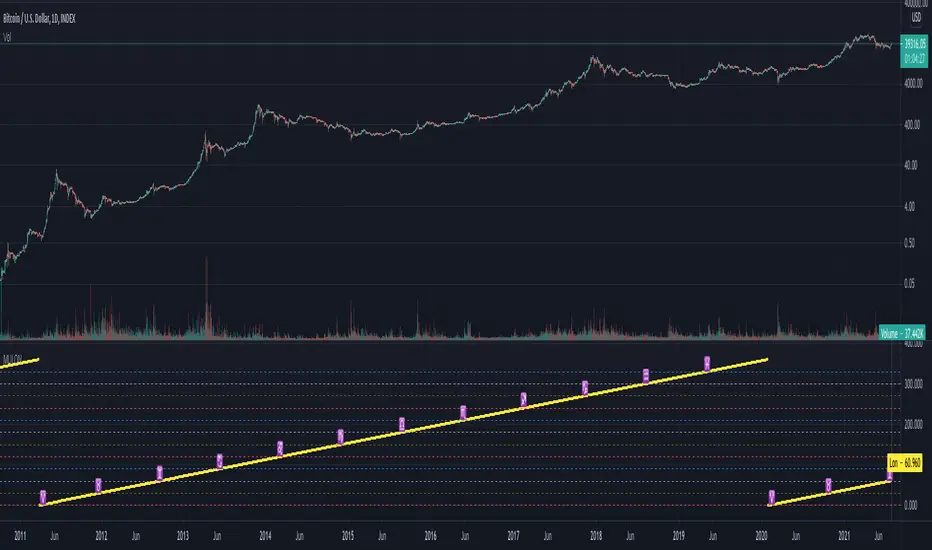
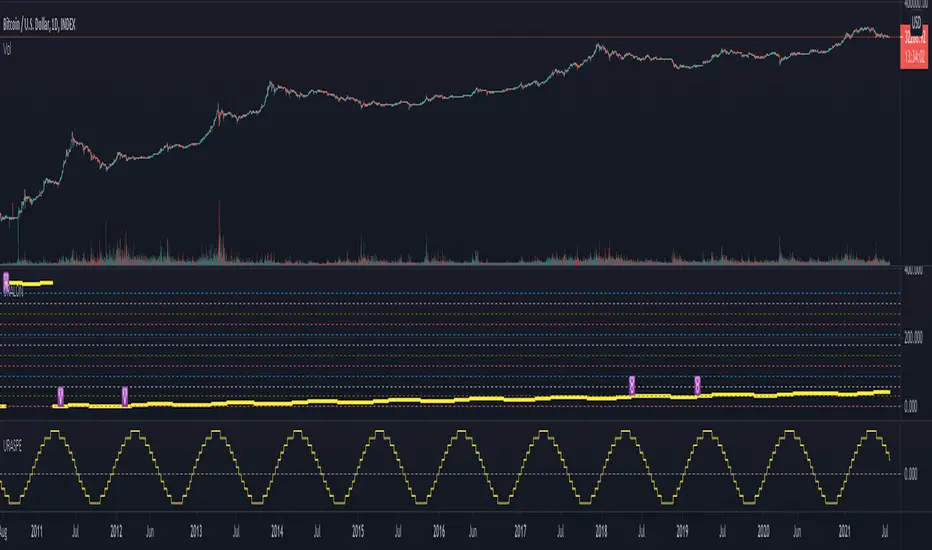
Financial Astrology True Lilith (Black Moon) LongitudeTrue Lilith (Black Moon) represents the wildly perturbed Moon apogee orbit, is not averaged (as Mean Lilith) and shows an erratic path with constant change of direction and speed. This Lilith uses the actual, real orbit rather than the average used by Mean Lilith. This perturbations are caused due to the gravitational pull of the Sun and the change of the orbit center which is the Earth-Moon Barycenter. The move of this apogee point toward all the Zodiac signs takes around 9 years to complete and as we can observe, the True Lilith moves back and forward within two consecutive zodiac signs during a prolonged period. In this erratic motion we can note that the peaks and valleys of this waves usually present a swing trade opportunities, is really impressive to note how a full or half True Lilith wave period correlates with short term local peaks and valleys in the BTCUSD price.
Note: The True Lilith (Black Moon) longitude indicator is based on an ephemeris array that covers years 2010 to 2030, prior or after this years the data is not available, this daily ephemeris are based on UTC time so in order to align properly with the price bars times you should set UTC as your chart timezone.

Financial Astrology Mean Lilith (Black Moon) LongitudeMean Lilith (Black Moon) represents the apogee of the lunar orbit (point where the Moon is farthest from Earth) as the Moon experience perturbations due to the gravitational pull of the Sun and don't orbit in elliptical path due the fact that don't follow the Earth center but the Earth-Moon Barycenter cause that an average projection of this apogee point location needs to be calculated, for this reason, we need to differentiate the Mean Lilith and True Lilith. The move of this apogee point toward all the Zodiac signs takes around 9 years to complete so in BTCUSD asset we only have one complete revolution so is difficult to emit any clear judgement of the zodiac sign location influence in the trend. However this imaginary body named Lilith is widely adopted by astrologers and is very important in Chinese Astrology, for this reason, we decided to contribute the indicator to support the research of Chinese astro-traders.
Note: The Mean Lilith (Black Moon) longitude indicator is based on an ephemeris array that covers years 2010 to 2030, prior or after this years the data is not available, this daily ephemeris are based on UTC time so in order to align properly with the price bars times you should set UTC as your chart timezone.
Financial Astrology North Node (Rahu) LongitudeThe Moon Nodes are the points where Moon crosses the ecliptic and transition from North to South latitude, North Node (Rahu) in Vedic astrology is considered to cause a bull trend when Eclipse occurs at this Moon node. Moon nodes are important because when Moon and Sun are in conjunction or opposition close very close to the degree of a Moon Node, then a Solar or Lunar eclipse occurs.
The effect of the trend will be coloured by the Zodiac sign where the Moon Node is located at, based on statistical research we have noted that the periods where North Node (Rahu) was located in Geminis the 56% of days was bullish, in Virgo 62% of the days was bullish. The most bearish location was Libra with 51% of days bearish. However the transition of North Node around all the Zodiac takes 19 years so in all BTCUSD price history we don't have yet a complete revolution to have a complete understanding of all the energy frequencies.
Note: The North Node (Rahu) longitude indicator is based on an ephemeris array that covers years 2010 to 2030, prior or after this years the data is not available, this daily ephemeris are based on UTC time so in order to align properly with the price bars times you should set UTC as your chart timezone.

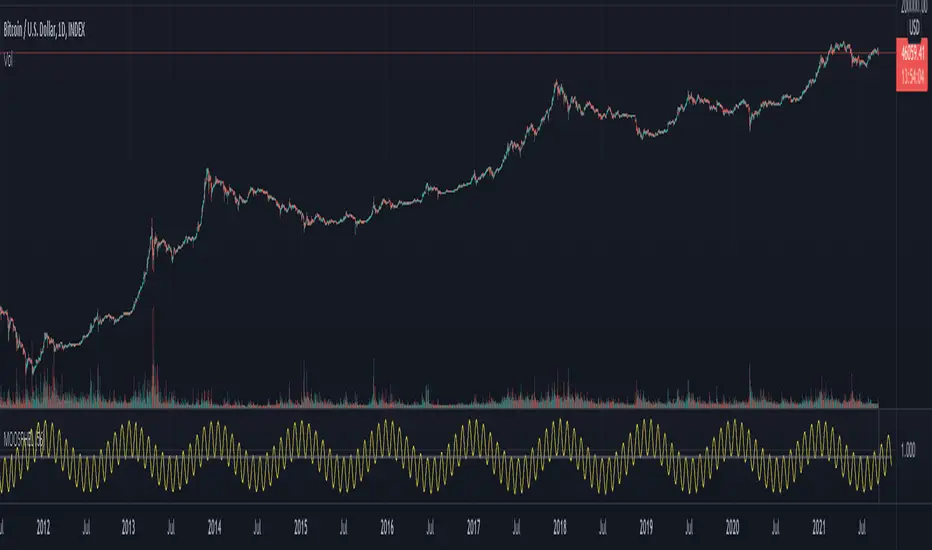
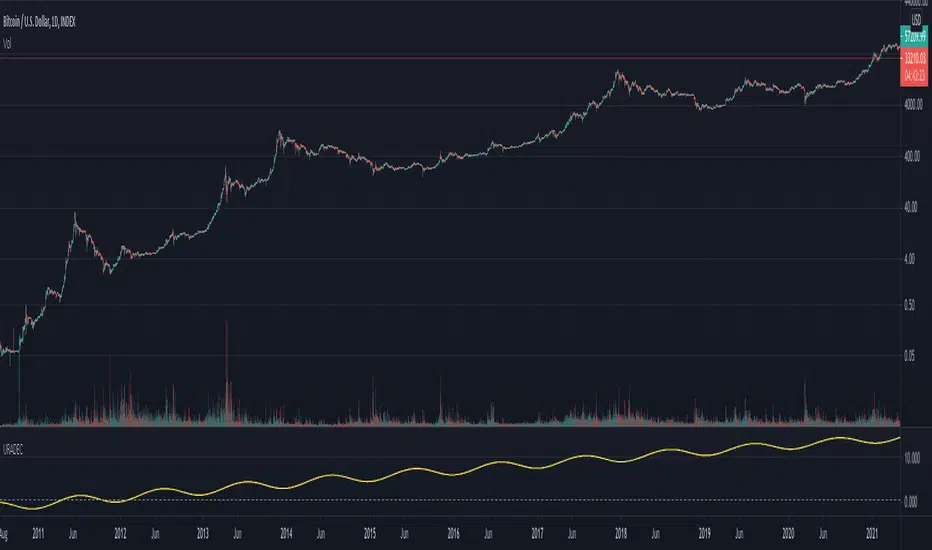
Financial Astrology Ceres SpeedCeres speed influence is clear for BTCUSD and confirms other planets speed observations, volatility increase as speed is accelerating. The most dominant bull runs of BTC have occurred when Ceres was moving direct in speed and accelerating. In many cases the trend reversed or stalled where Ceres enter into deceleration period. The only exception was March 2019 where BTCUSD price increased while Ceres was moving retrograde but as we know, all the planets are acting simultaneously so careful exploration needs to be made with the other planets and asteroids speed phases during that same period to conclude why in that observation the volatility was strong.
Note: The Ceres speed indicator is based on an ephemeris array that covers years 2010 to 2030, prior or after this years the data is not available, this daily ephemeris are based on UTC time so in order to align properly with the price bars times you should set UTC as your chart timezone.

Financial Astrology Ceres DeclinationCeres declination shows similar trend behaviour as we have seen with other planets, when moving from South to North the dominant BTCUSD trend is bullish, when moving from North to South the dominant trend is bearish. We observe that the periods of most intense corrections have occurred when Ceres was located in South declination.
Note: The Ceres declination indicator is based on an ephemeris array that covers years 2010 to 2030, prior or after this years the data is not available, this daily ephemeris are based on UTC time so in order to align properly with the price bars times you should set UTC as your chart timezone.
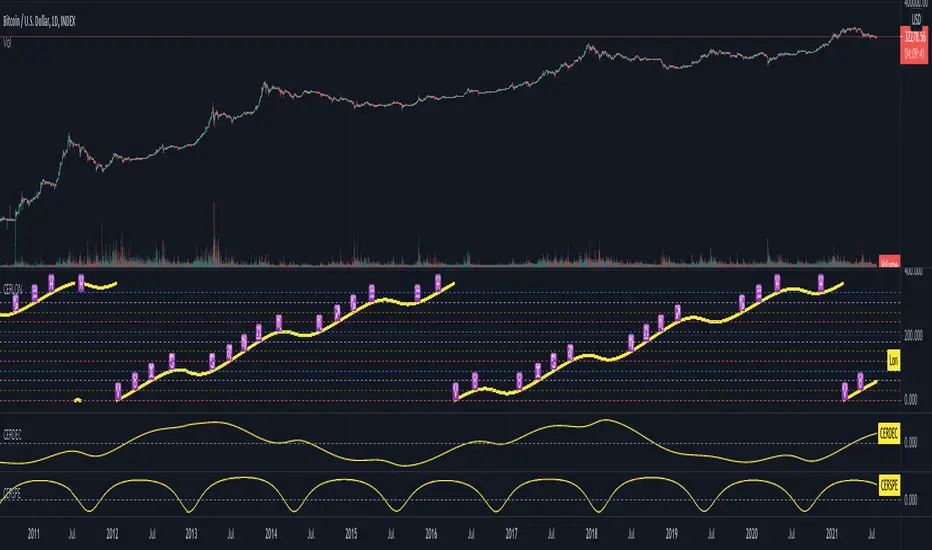
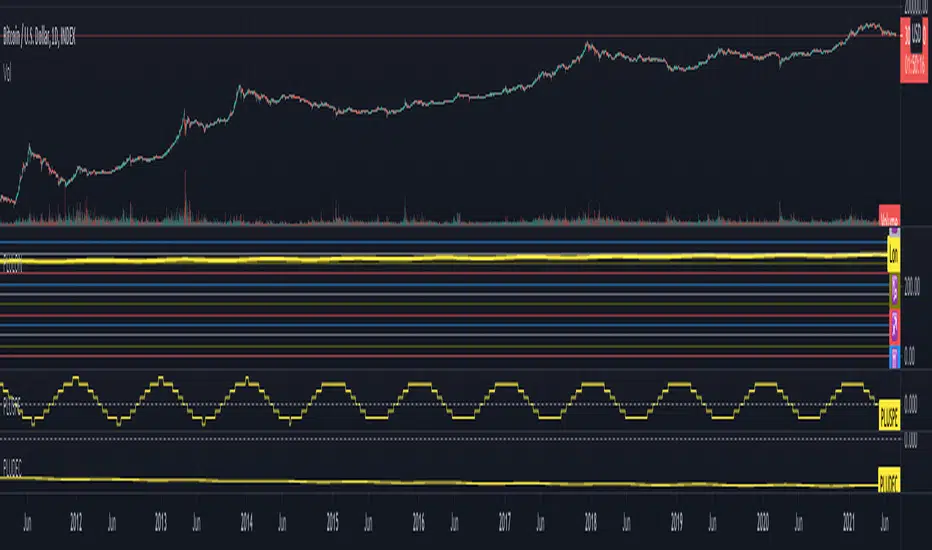
Financial Astrology Ceres LongitudeCeres is the largest object in the asteroid belt between Mars and Jupiter orbits, most of the people don't know that Ceres don't have the category of asteroid but a "dwarf planet", the same as Pluto. Many astrologers don't take Ceres into account when casting an astrological chart but my thinking is that if is proved by experience that Pluto with a mass of 1.30900 x 10^22 kilograms is relevant for market predictions, why not to consider Ceres which has a mass of 9.39 x 10^20 kilograms (7.2% of Pluto mass) but is closer to the Earth?
Through the statistical analysis of Ceres transit through tropical zodiac signs we noted that for BTCUSD there was a significant bullish trend where Ceres transited Aries (62% days), Gemini (67% days), Virgo (57% days) and Pisces (62% days) and significant bearish trend where Ceres transited Libra (56% days) and Scorpio (61% days).
The astrologer Bill Meridian indicated that Ceres rules: food and nursing homes. Other astrologers suggest that it rules: cooking, eating, farming, growing, gardening. I think we need more research to identify the specific sectors that are ruled by Ceres but definitely this dwarf planet is very relevant for financial markets trend forecasting.
Note: The Ceres longitude indicator is based on an ephemeris array that covers years 2010 to 2030, prior or after this years the data is not available, this daily ephemeris are based on UTC time so in order to align properly with the price bars times you should set UTC as your chart timezone.

Financial Astrology Pluto DeclinationPluto moves very slow in declination as can be viewed in this indicator, therefore, is logical to think that looking Pluto declination for short or mid term trading is useless. We cannot determine any useful pattern from Pluto declination or longitude but we was willing to document here that we did the exploratory analysis of all planets declination. The conclusion is that what is relevant for trading are the declinations of the tradition astrology planets: Moon, Mercury, Venus, Sun, Mars, Jupiter and Saturn. However, Pluto speed phases seems to be relevant so we recommend to keep an eye on the Pluto speed indicator.
Note: The Pluto declination indicator is based on an ephemeris array that covers years 2010 to 2030, prior or after this years the declination is not available, this daily ephemeris are based on UTC time so in order to align properly with the price bars times you should set UTC as your chart timezone.
Financial Astrology Pluto SpeedPluto retrograde and stationary phases weaken the explosive energy effect of the extreme and ungovernable actions, causing a period where traders tends to wait and analyse more before acting. We can see in BTCUSD that in most of the retrograde periods of Pluto the price was trapped (sideways) within very narrow price range consolidating the price zone reached by the aggressive moves occurring during the Pluto direct motion phase.
Note: The Pluto speed indicator is based on an ephemeris array that covers years 2010 to 2030, prior or after this years the speed is not available, this daily ephemeris are based on UTC time so in order to align properly with the price bars times you should set UTC as your chart timezone.

Auto Fib Time Zones and Trend-Based Fib Time by DGTFibonacci time zones, based on the Fibonacci number sequence, are vertical lines that represent potential areas where a swing high, low, or reversal could occur.
Trend-Based Fib Time shows probable price corrections in an existing trend. A useful tool to use in addition to Elliot Wave counting, Fib Time helps to identify how far the wave is likely to travel
Please note, Time zones aren't concerned with price, only time
Disclaimer :
Trading success is all about following your trading strategy and the indicators should fit within your trading strategy, and not to be traded upon solely
The script is for informational and educational purposes only. Use of the script does not constitute professional and/or financial advice. You alone have the sole responsibility of evaluating the script output and risks associated with the use of the script. In exchange for using the script, you agree not to hold dgtrd TradingView user liable for any possible claim for damages arising from any decision you make based on use of the script

Financial Astrology Indexes ML Daily TrendDaily trend indicator based on financial astrology cycles detected with advanced machine learning techniques for some of the most important market indexes: DJI, UK100, SPX, IBC, IXIC, NI225, BANKNIFTY, NIFTY and GLD fund (not index) for Gold predictions. The daily price trend is forecasted through planets cycles (angular aspects, speed phases, declination zone), fast cycles are based on Moon, Mercury, Venus and Sun and Mid term cycles are based on Mars, Vesta and Ceres . The combination of all this cycles produce a daily price trend prediction that is encoded into a PineScript array using binary format "0 or 1" that represent sell and buy signals respectively. The indicator provides signals since 2021-01-01 to 2022-12-31, the past months signals purpose is to support backtesting of the indicator combined with other technical indicator entries like MAs, RSI or Stochastic . For future predictions besides 2022 a machine learning models re-train phase will be required.
When the signal moving average is increasing from 0 to 1 indicates an increase of buy force, when is decreasing from 1 to 0 indicates an increase in sell force, finally, when is sideways around the 0.4-0.6 area predicts a period of buy/sell forces equilibrium, traders indecision which result in a price congestion within a narrow price range.
We also have published same indicator for Crypto-Currencies research portfolio:
DISCLAIMER: This indicator is experimental and don’t provide financial or investment advice, the main purpose is to demonstrate the predictive power of financial astrology. Any allocation of funds following the documented machine learning model prediction is a high-risk endeavour and it’s the users responsibility to practice healthy risk management according to your situation.

Financial Astrology Crypto ML Daily TrendThis daily trend indicator is based on financial astrology cycles detected with advanced machine learning techniques for the crypto-currencies research portfolio: ADA, BAT, BNB, BTC, DASH, EOS, ETC, ETH, LINK, LTC, XLM, XMR, XRP, ZEC and ZRX. The daily price trend is forecasted through this planets cycles (angular aspects, speed, declination), fast ones are based on Moon, Mercury, Venus and Sun and Mid term cycles are based on Mars, Vesta and Ceres. The combination of all this cycles produce a daily price trend prediction that is encoded into a PineScript array using binary format "0 or 1" that represent sell and buy signals respectively. The indicator provides signals since 2021-01-01 to 2022-12-31, the past months signals purpose is to support backtesting of the indicator combined with other technical indicator entries like MAs, RSI or Stochastic. For future predictions besides 2022 a machine learning models re-train phase will be required.
The resolution of this indicator is 1D, you can tune a parameter where you can determine how many future bars of daily trend are plotted and adjust an hours shift to anticipate future signals into current bar in order to produce a leading indicator effect to anticipate the trend changes with some hours of anticipation. Combined with technical analysis indicators this daily trend is very powerful because can help to produce approximately 60% of profitable signals based on the backtesting results. You can look at our open source Github repositories to validate accuracy using the backtesting strategies we have implemented in Jesse Crypto Trading Framework as proof of concept of the predictive potential of this indicator. Alternatively, we have implemented a PineScript strategy that use this indicator, just consider that we are pending to do signals update to the period July 2021 to December 2022: This strategy have accumulated more than 110 likes and many traders have validated the predictive power of Financial Astrology.
DISCLAIMER: This indicator is experimental and don’t provide financial or investment advice, the main purpose is to demonstrate the predictive power of financial astrology. Any allocation of funds following the documented machine learning model prediction is a high-risk endeavour and it’s the users responsibility to practice healthy risk management according to your situation.

Financial Astrology Neptune LongitudeNeptune energy influence the charity, confusion, imagination, waste, crime, intuition, occult, scandal, illusion and dreams. It rules the industries related to chemicals, gas and oil, drugs and alcoholic beverages, scams, non profit organisations, spirituality. The last decade Neptune have been traveling through Piscis sign which caused humanity to have an illusion that economical growth don't have limits, as consequence we saw US indexes growth toward new all time highs. However, Neptune is close to leave Piscis, in 7 more degrees as per July 2021 and new cycle is going to start. It will be interesting to see what happens as Neptune moves into Aries sign.
This longitude indicator show a zodiac signs horizontal line boundaries that identify the start of the sign marked in the corresponding horizontal line label in the Y axis, this simplify the analysis of a planet effect within specific zodiac sign.
Note: The Neptune longitude indicator is based on an ephemeris array that covers years 2010 to 2030, prior or after this years the data is not available, this daily ephemeris are based on UTC time so in order to align properly with the price bars times you should set UTC as your chart timezone.

Financial Astrology Uranus LongitudeUranus energy influence the wish to change, to innovate, to disrupt the confort zone, is the spirit of the inventions, revolutions and technology. Rules the industries of electricity, computing, aviation, technology, fin-tech and internet (because without web servers that needs electricity the network cannot operate). Through the course of the zodiac Uranus will reveal the human sectors that will be disrupted, at this moment 2021 is moving through Taurus so is expected that human finances are disrupted which is currently happening with all the innovations and momentum of the fin-tech startups that are innovating applications of the blockchain.
Note: The Uranus longitude indicator is based on an ephemeris array that covers years 2010 to 2030, prior or after this years the data is not available, this daily ephemeris are based on UTC time so in order to align properly with the price bars times you should set UTC as your chart timezone.
Financial Astrology Uranus DeclinationWe have observed that when planets are located in North declination there is a tendency to produce more strong effects when the planet is emitting or receiving aspects. However, in the case of Uranus declination is hard to judge if the boom of technology and crypto-currencies experienced in the last decade could be attributed to the fact that since April 2011 Uranus crossed zero declination toward the North. In this indicator we only have historical declination since 2010 and is hard to do conclusions. Anyways, if Uranus is the reason of the great momentum of crypto-currencies we will see a complete adoption and disruption on the financial sector with the blockchain in the next years because Uranus will continue increasing declination until reach the maxima.
Note: The Uranus declination indicator is based on an ephemeris array that covers years 2010 to 2030, prior or after this years the speed is not available, this daily ephemeris are based on UTC time so in order to align properly with the price bars times you should set UTC as your chart timezone.
Financial Astrology Neptune SpeedNeptune retrograde and stationary phases indicates periods of delusion, on that moments the traders optimism bubble is burst, as consequence, we can see that most of this retrograde speed phase periods correlates with BTCUSD price correction or consolidation periods. Is very clear to see in the chart that only once, the Neptune retrogradation occurrence in September 2020, resulted in price growth. Therefore, periods of price growth and optimism are more likely when Neptune is direct.
Note: The Neptune speed indicator is based on an ephemeris array that covers years 2010 to 2030, prior or after this years the speed is not available, this daily ephemeris are based on UTC time so in order to align properly with the price bars times you should set UTC as your chart timezone.