Artharjan Volume AnalysisHi,
I have created Artharjan Volume Analysis indicator dashboard which gives following information about the volume to the traders.
It has two rows. The first row containing volume information is for the Daily Timeframe and the second row containing volume information for any other timeframe of your choice (Basically Chart timeframe)
It gives following information about volume to the traders.
1] Current Volume in Lakhs (Not in Millions) since this script was made keeping in mind Volumes of the Scripts traded in Indian Stock Exchanges. 1 Lakh = 1,00,000
2] Change from its previous Volume. If the change is positive it will be highlighted in Green else in Red.
3] 25 period SMA of the Volume (This period is a Long Term Moving Average and its a customizable parameter which can be changed in Indicator Settings)
4] Current Volume as a percentage of Long term SMA( Volume). If the percentage is positive it will be highlighted in Green else in Red.
5] High Volume during the Lookback period
6] Low Volume during the Lookback period
7] Is current Volume equal to Min Level or Max Level? Or its between Min Max Levels.
8] Is the current Volume rising over past 5 candles or is it falling over past 5 candles or its Swinging? (Short Term Period which is a customizable parameter and it can be changed in the Indicator Settings)
9] Current Volume as a percentage of Short term SMA( Volume). If the percentage is positive it will be highlighted in Green else in Red.
The 1st row will be shown only when the Chart Timeframe is a Daily Timeframe.
The 1st and the 2nd row will be shown only when the Chart Timeframe is not a Daily Timeframe.
With this information regarding volume, traders can identify whether the current volume is at its Highest Levels or at its Lowest Levels, can identify whether volume is rising or volume is falling in accordance to the price action and then take trading decisions.
I hope you would enjoy using this indicator in your day to day trading journey.
Regards
Rahul Desai
@Artharjan.
Carta Harian

Know your Monthly, Weekly, Daily LevelsThis script will show monthly, weekly and daily (with or without pre market) levels on your intraday chart. You can chose what values of the corresponding candles (high, low, close) should be included.
Please consider following limitations:
1. Maximum of 500 drawing objects per chart
To make sure the most relevant levels are shown, values are sorted based on the latest close value before levels > 500 are cut off.
2. Lookback history
The max lookback history is limited by the currently selected timeframe. E.g. on a 5min timeframe, 20000 bars (Premium Plan) result in approx. 5 months of lookback period, meaning you may want to have a 30 min or higher chart open to get a complete picture of levels, while trading on a lower timeframe.
High/Low/Open/Close Daily, Weekly, Monthly Line
I wrote this for the purpose of saving time while marking up charts by automating the process of drawing and labeling lines at areas of interest on larger
timeframes while still having the option to change the style and size of the lines and labels to adjust for any timeframe and avoid a messy chart.
I also used this as an exercise in menu organization giving users every imaginable option and producing clean readable code.
- This indicator draws a line on the Daily, Weekly, and Monthly bar at the High, Low, Open and Close of each bar as price
tends to react when revisiting these areas.
- Each set of bars has an optional identifying label with its own color set that can be shown with or without the lines
price value, and has drop down menus for size and style of each set of labels.
- Each set of lines has inputs for line/text color, line width and style, and can be hidden if the user doesn't have the need for any particular timeframe.
- Lines and Labels with delete when a new line is created.
- I recommend going into Chart Settings/Status Line and turning off indicator arguments OR moving the script to the top
of the indicator list to avoid an obstructed chart view with this indicators arguments. When Pine allows, I will update it to hide them.
Contains some public domain code from T.V. manuals and tutorial for creating drop down input menus for options.
/ ~For My Pal Jittery~
~ Who likes his clean chart and custom colors~

Baseline (BL)My baseline study lets you compare price to the previous days close. You can select the time frame for this baseline. I have included the ability to use a custom period length or your own anchor value. Custom anchor values are great for comparing the price to your cost average. The features I have included are bar color and background color.
I liked the idea of the 'baseline" chart but I didnt like the implementation.
Enjoy
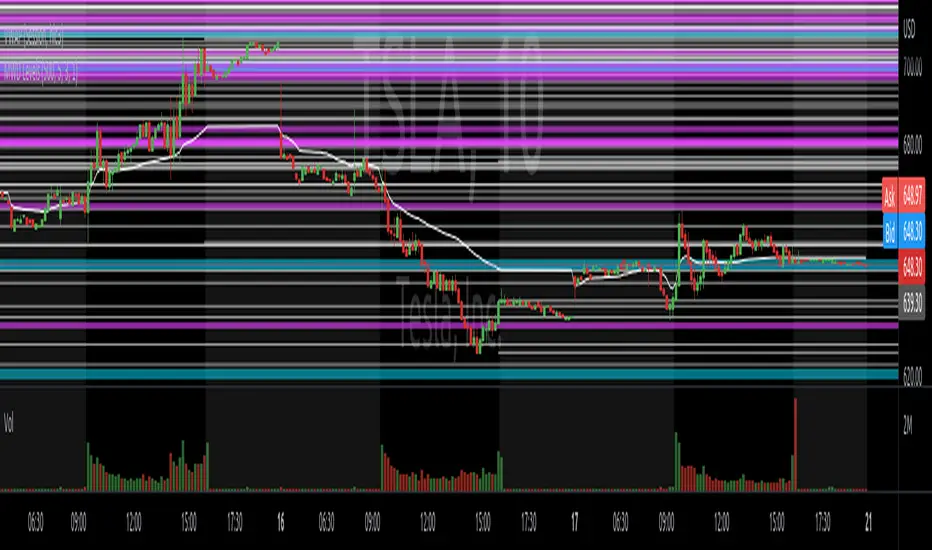
Order Block and Daily Levels VTRENDThe Order Block and Daily Levels is my first script designed to add context with order blocks to how i trade.
I have included a volume weighted band in green, as it's use is core to my trading style. I have often found however, there needs to be more clarify in structure which some of my previous scripts did not provide, so i have coded up some custom order blocks, which can be altered along the lines of how sensitive they are.
There is also a high time frame volume average line to combine the green volume weighted band to identify a bullish or bearish trend.
The other key change I am experimenting with, is trading off the daily levels, this is reflected here with a change is barcolor, above or below the daily level and a 'cross' symbol.
Included are 'chance of reversal' diamonds.
You can see here with the trend, volume and structure information given, there is a clearer idea of where price might head to next. Combine this with yur own levels too.
This can be useful on low time frames too.
So far I have experimented with this script on the 4/2/1 hour and 25 / 5 minutes

4C Daily Levels Suite + Premarket High/LowThis '4C Daily Levels Suite + Premarket High/Low' indicator is a clean way to automatically plot important daily levels including:
Prior Day High
Prior Day Low
Prior Day Close
50% level between Prior High/Low
Today's Open
Today's Premarket Low+High
This Daily Levels indicator is unique in its ability to:
-Plot all of the daily level PLUS premarket high/low levels (extended hours must be turned ON)
-Can hide past days levels, only plotting levels on the current day, to keep chart cleaner
-Can extend line levels right or fullscreen
-Plots the level price at each level on the chart
-Can show/hide price levels labels
-Can add supplemental premarket levels plot to show levels being formed during the premarket time period
-Coded with line.new vs plot so dashed lines are available as a style
-Automatically hides the indicator if the timeframe selected is Daily or greater
SEE SCREENSHOT EXAMPLES BELOW
Default mode, with extended hours showing:
With supplemental premarket plot showing:
Default mode without extended hours showing:
Showing past day’s levels
Extend lines to fullscreen
Some parts of this code were adapted from 'pd Levels' by CryptoCurl

Wurucututu's Daily/Weekly/Monthly HLOCThis script draws the High/Low range for a daily, weekly, or monthly periods. By default is set to weekly.
Also it draws the open and close for each period, painting it in red if open greater than close, and green otherwise.
You can forward shift ranges to see how current price action interacts with ranges from past periods. By default this is set to zero.
For instance, here is the interaction of current week with previous week range (i.e. a 1 week shift forward).
And here is a 7 month shift forward.

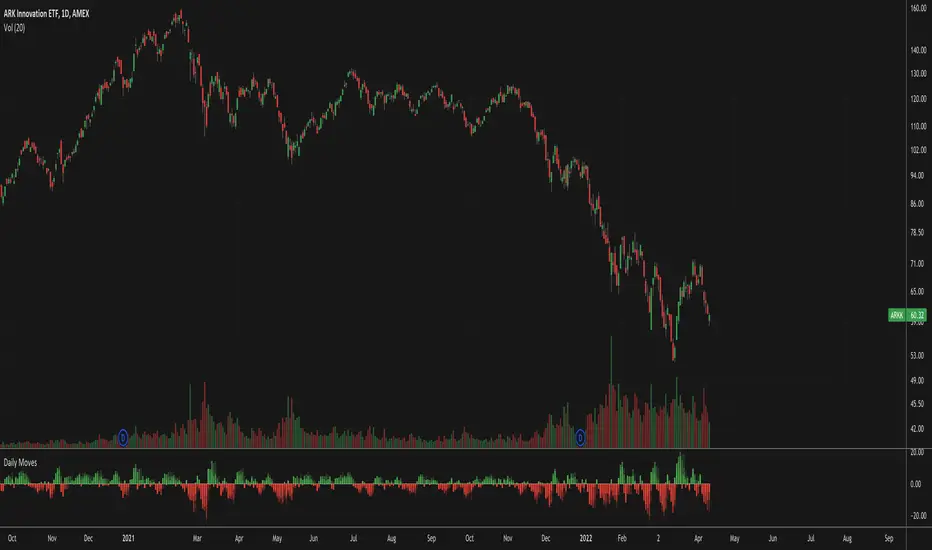
Daily MovesShow percent daily moves with a 5 period look back. This helps visualize recent performance.
Key Levels// How it Works \\
Calculating Previous Days, Weeks and Monthly open, high, low, close and vwaps
Plots these levels on your chart
// Settings \\
You can enable/disable any of the levels you want to see
You can also change the amount of bars back the levels are plotted back to
// Use Case \\
These levels are often used in different methods of Technical analysis for support and resistance.
// Suggestions \\
Happy for anyone to make any suggestions on changes which could improve the script,
// Terms \\
Feel free to use the script, If you do use the script could you please just tag me as I am interested to see how people are using it. Good Luck!

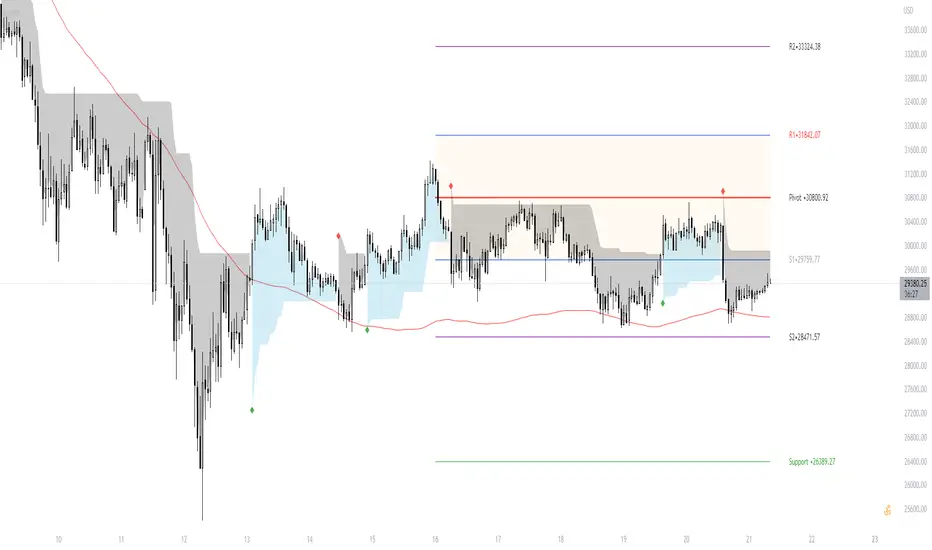
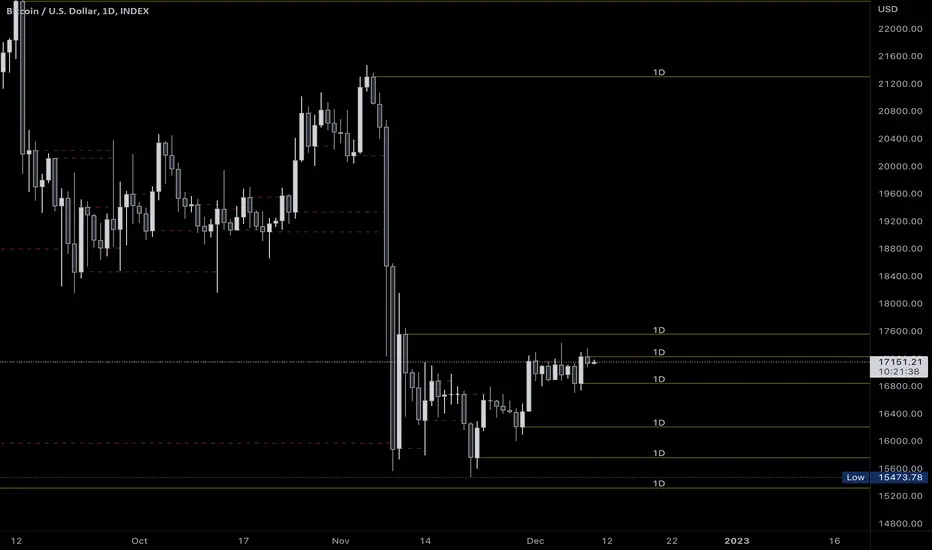
[TT] Daily Levels
These pivots are based on calculations that i have been using for quite some time. I'm sure There is no need to explain on how to use pivots.
Labels are given to understand and you can Msg me here or comment if u need any explanation.
I have given few examples below.. check i t out
XAUUSD
BTCUSD
Nifty
Banknifty
Day/Week/Month/3M/6M/12M MTF breaks by makuchakuThis indicator plots breaks for multiple timeframes. Works on Daily to Yearly timeframes.
Currently supported timeframes :
Daily
Weekly
Monthly
Quarterly
Half Yearly
Yearly
It currently plots all breaks together. From Indicator settings hide what you don't need and save as default settings.

Naked Bar Upward ReversalAMEX:SPY
The Naked Bar Upward Reversal is a three bar candlestick pattern with an inside candle as a entry point. This pattern is bullish since it has a candle closing red from the previous candle; the most bearish pattern possible. The following inside candle is a reversal of its previous candle with an open above the previous candle's close. Look to buy the next open above the inside candle's close.
This is a bullish reversal pattern and should be used in this context. Successful entries are found in corrections along an upward trend, or buying into a dip. Performance drops when the pattern appears at tops. To improve profitability, use a cluster of evidence to enhance the performance of this pattern. The intended time frame is within the daily and weekly.

[BFR] Naked LevelsDetects significant naked levels(Levels that have not been touched since the candle closed) and draws them on chart. These provide excellent profit targets and often reversal levels.
Roadmap:
✅ Candle open
☑ Point of control
☑ Multiple timeframes
☑ Something else? Leave a comment.
Key Levels (Time Frames - Weekly,Monthly,Quarterly,Yearly)This indicator plots the 4h, Daily, Weekly, Monthly, Quarterly, Yearly Open High, Low and Mids.
You can watch how these institutional trading levels work as support and resistance.
Most Important you can add alerts to these levels with a few clicks.
Just add/remove unnecessary levels for scaling problems.
For any error/suggestion/improvement just let me know.

ICHIMOKU Crypto Swing AlertThis is a crypto swing alert for the strategy with the same name designed for timeframes bigger than 1h.
The main components are
ICHOMOKU
KDJ
Average High
Average Low
Rules for entry
For long: we have the ichimoku crosses between tenkan and baselines, we have a rising kdj line and at the same time we have a increase in the average high
For short: we have the ichimoku crosses between tenkan and baselines, we have a falling kdj line and at the same time we have an increase in the average low
Rules for exit
We exit when we have inverse conditions than the initial ones used for entry.
Caution
This strategy does not use a risk management, so be careful with it !
If you have any questions let me know !

Daily DeviationShows you the normal deviation from the OPEN based upon historical data.
Levels measured:
Normal range (1 standard deviation) of the CLOSE (vs the OPEN).
Normal daily HIGH +1, +2, +3, and +4 standard deviations.
Normal daily LOW -1, -2, -3, and -4 standard deviations.
Configuration:
Always shows you the normal CLOSE vs OPEN range for the current session.
Can display previous day's ranges (extra days) based upon the calendar (not trading days).
Normally displays which levels have been exceeded (to reduce noise and keep auto-scale to a minimum), but can show all the ranges for the current session.
The default number of days to measure (50) will affect the accuracy but outliers are cleaned to avoid dramatic variance.
Note:
These are only statistical representations of what has occurred in the past. You can interpret the current price as oversold or overbought for the day (and only that day) relative to the OPEN. Gaps high or low are not considered in the equation.

TradingGroundhog - Fundamental Analysis - Multiple RSI Ema(Script Available Version of my previous Fundamental Analysis - Multiple RSI Ema )
As the number of crypto currencies is expanding, we need to find the one which will boom in the next months, weeks or even days.
Therefore, I present to you a Fundamental Analysis tool based on RSI built in order to compare the RSI between the diverse cryptocurrencies.
When cryptocurrencies start to trend, become active, minable and especially "buyable", people are investing their money into them.
As a result,the Daily RSI rises and the price of the crypto in question increases steadily.
With "Fundamental Analysis - Multiple RSI EMA" you can :
Follow up to 20 RSI from different exchanges at the same time.
Find easily Increasing/Decreasing RSI as the lines get transparent if their RSI decrease.
You can also select market with high potential of booming as :
Booming Market : 60 < Daily RSI <= 100 (Strong green background)
Potent Market : 55 < Daily RSI <= 60 (Light green background)
Sleepy Market : 50 < Daily RSI <= 55 (Light red background)
Dying Market : 0 < Daily RSI <= 50 (Strong red background)
Futur booming crypto will go from the Potent Market to the Booming Market
Can be used with the following time frames depending on the necessity:
4H
Daily (Preferred)
Weekly
Monthly
Good trades !
Disclaimer (As it should always be one to any script)
***
This script is intended for and only to be used for personal purposes only. No such information provided by it constitutes advice or a recommendation for any investment or trading strategy for any specific person. There is no guarantee presented or implied as to the accuracy of specific forecasts, projections, or predictive statements offered by the script. Users of the script agree that its original developer does not take responsibility for any of your investment decisions. Please seek professional advice before trading.
***

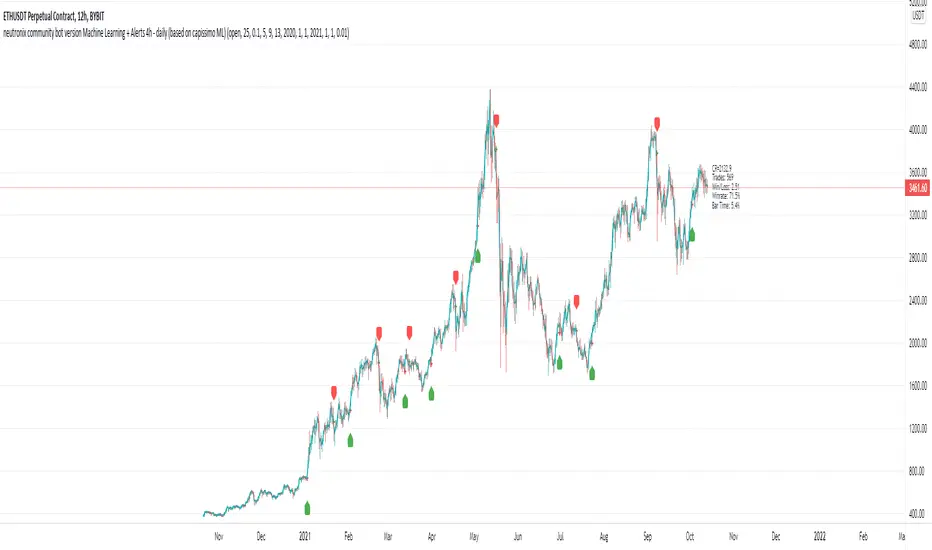
neutronix community bot ML + Alerts 4h-daily (mod. capissimo)Gm traders,
i have been a python programmer for some years studying artificial intelligence for general purpose; after some time i finally decided to have a look at some finance related stuff and scripts.
Moved by curiosity i've decided to make some but decisive modifications to a script i tried to use initially but without success: the LVQ machine learning strategy.
So after studying the charts and indicators, i have rewritten this script made by Capissimo and added heavy filtering thanks to vwap and vwma, then fixed repaint and other issues.
I hope you enjoy it and that it could increase your possibilities of success in trading.
HOW TO USE THE SCRIPT
Add the script to 3h+ charts like for example BTC 4h, 6h, 8h, 12h, daily. (In order for it to work on shorter timeframes charts you can try to change to lookback window but i dont advise it).
Change only rsi and volfilter(volume filtering) settings to try to find the best winrate. Leave dataset to open. Fyi the winrate isn't 100% accurate but can give you a raw vision of final results.
Use alerts included for trading and and in options click on 'Once per bar'. If you have checked 'Reverse Signals' in the control panel you have got more 'risky' signals so be advised if trading futures and stocks.
Exit trade signals not provided, so it is recommended the use of take profits and stop loss (1.5:1 ratio)
As always, the script is for study purposes. Do not risk more than you can spend!
Original LVQ-based strategy made by capissimo
Modified by gravisxv 13/10/2021
High Low Open Mid Ranges & Levels (Multi-Timeframe)This indicator automatically plots the chosen timeframe's high, low, mid point and open. These levels on higher timeframes act as support and resistance levels on lower timeframes, helping find entries, stoploss and profit targets.
Most common timeframes to choose are Daily, 1W, 1M, and 3M. Other timeframes that are good include, 2D, 2W and 2M.
For example, you can see in the snapshot below, we are on the 4hr TF showing those levels from the 2W. This historical 2W zone (open and mid) was (and currently still is) resistance. You can see it also provided a good entry to go short.
This is also useful for intraday scalping. Below, we are on the 15min TF with levels set on the 2D timeframe. You can see how the Open and Mid levels acted as resistance, providing good entries on range trades, with take profit set at the previous 2D low.
There is also a table which tells you all the main TFs high, low, open, and mid levels. They are the most important ones to look out for.
This indicator should not be used in isolation; it is best to pair it up with other TA such as orderblocks, S/D zones, S&R or overlay indicators.

Daily lines (UTC)This is a simple script to add highlighted lines on the daily open.
It uses UTC as timezone.

Price Range TableThe table shows the ranking of the price as a percentage relative to the past candles.
100 ~ highest price of the time frame
0 ~ lowest price of the time frame

Ticker Dashboard For Better Stock SelectionHey, this indicator will help you with your stock selection. The goal is to focus on stocks that move (higher ADR) and provide enough liquidity which means less risk.
ADR - Average Daily Range in % (measured from High to Low - does not include gaps like ATR does / Threshold color can be adjusted from input)
%Change - Current % change from prior close price
Vol- Todays Volume in MIO
ADV- Average Daily Volume in MIO - default set to 1 month (20 days, can be changed from input - Colored red if < 1 MIO)
$VOL- Dollar Volume - Average Daily Volume multiplied with the last daily close price. Important for liquidity issues.
MTF Key Levels - Support and ResistanceThis indicator shows how to Multi Time Frame (MTF) interpret levels:
Watch how price acts around these levels and how they can act as support/resistance and can be used as great confluence levels for your technical analysis.
This indicator displays:
VWAP Levels
Daily / Weekly / Monthly / Yearly
Within the chart above I have marked out how displaying these VWAP levels can provide support and resistance levels to be aware of.
Daily – Weekly - Monthly – Yearly Levels
O = Open / H = High / L = Low
pO = Previous Open / pH = Previous High / pL = Previous Low / pEQ = Previous Equlibrium
Having previous Low/High levels makes you aware of Swing Failure Patterns (SFP). Also the daily/weekly/monthly opening and previous opening can assist with the trend.
Daily Open: Gives you an idea who is in control for the day. This level very often acts as strong support or resistance.
Weekly Open: Indicates where the price is within the higher timeframe.
Monthly Open & Yearly Levels: Overview of direction for the whole month without looking at a monthly chart and Yearly chart
Line Options
Within the line options you can choose to have a clean chart and display a “short line”. These line length can be adjusted by the user.
Line just to the right.
Line across the screen.
Disclaimer: The Monthly and Yealy VWAP will only show on higher timeframes this is due to restriction of how many candles can be shown on the chart. The candles displayed need to go back to either the start of the month of year to be able to calculate their VWAPs.
