Daily High/Lowmodified version of Mike Witts Daily High/Low indicator.
This is a simple change that removes the 1-day offset from the indicator.
Carta Harian

Daily SMA x2 With InputsIdeal for Intraday charts when you want to know the daily SMAs or for daily charts if you want to save on an indicator


Binque's Multi-Moving Average Binque's Multi-Moving Average - One indicator with four simple moving average and four exponential moving averages, plus as a bonus a Day High moving average and a Day Low Moving Average.
Simple Moving Average or MA(14), MA(50), MA(100) and MA(200) all in one indicator
Exponential Moving Average or EMA(8), EMA(14), EMA(20) and EMA(33) all in one indicator
Day High Moving Average - Tracks the Daily High versus most moving averages track the daily close.
Day Low Moving Average - Tracks the Daily Low versus most moving average track the daily close.
To Disable moving averages, Set the color to the chart background and then set the length to 1 and uncheck.
I Use the Daily High Moving Average to track upward resistance in a stock movement for Swing Trading.
I Use the Daily Low Moving Average to track my trailing stop in a stock movement for Swing Trading.

DRS - Daily Range SystemAn indicator that visualizes the evolution of a daily candle, inspired by a thread on forexfactory: www.forexfactory.com
Applied on a timeframe lower than D (actually lower than H4), it visualizes the evolution of the day's high and low, as well as mid and 25% and 75% lines.
The sole input parameters are the hour at which a day is supposed to start, and the extent of the "trade allowed" region as explained in the FF -1.44% thread.

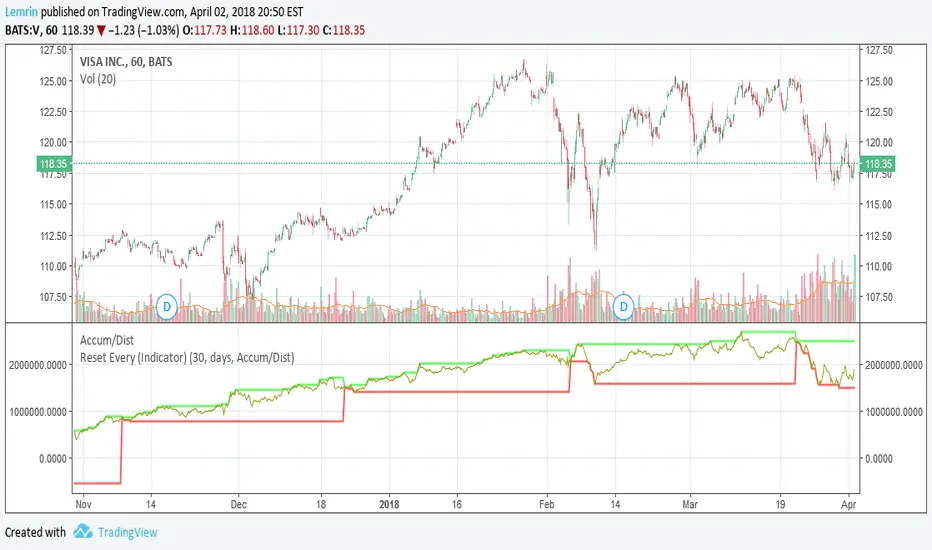
Reset Every (Indicator)Nearly identical to the price version , this configurable indicator retains the max and min value of a chart for the time duration you specify. The difference with this one is that it can be applied to any other indicator, not just price.
Applied to volume:
Reset Every (Price)Someone requested a high/low price indicator that would reset the "remembered" prices daily. I started out doing just that, and then decided to make it much more configurable.
Choose the units (minutes, hours, days, weeks, months) and the number of those units, and this will reset the highest/lowest value remembered to the current values on your chosen time interval.
This should work with any time interval you desire, within reason...asking for resets every 4000 hours on a monthly chart will probably not work.
GE, monthly, every 7 months:
Ford, weekly, every 18 months:
Dow Jones Industrial Average, weekly, every 90 days:
LTCBTC, daily, every 10 days:
ETHUSD, 30 minutes, every 10 days:
BTCUSD, 1 minute, every 10 hours:
EURUSD, 1 minute, every 50 minutes:
Also, I am about to publish another version of this with just one source input that can be applied to any indicator...stay tuned!

Always show daily EMAThis script will always plot the daily EMA regardless of which timeframe you are on.

Three Bars Down and Inside Bar v2Updated Version of my Script. Script includes a Filter for stocks that are down three days in a row. Also it checks for oversold rsi and inside bars. Works best daily with stocks.

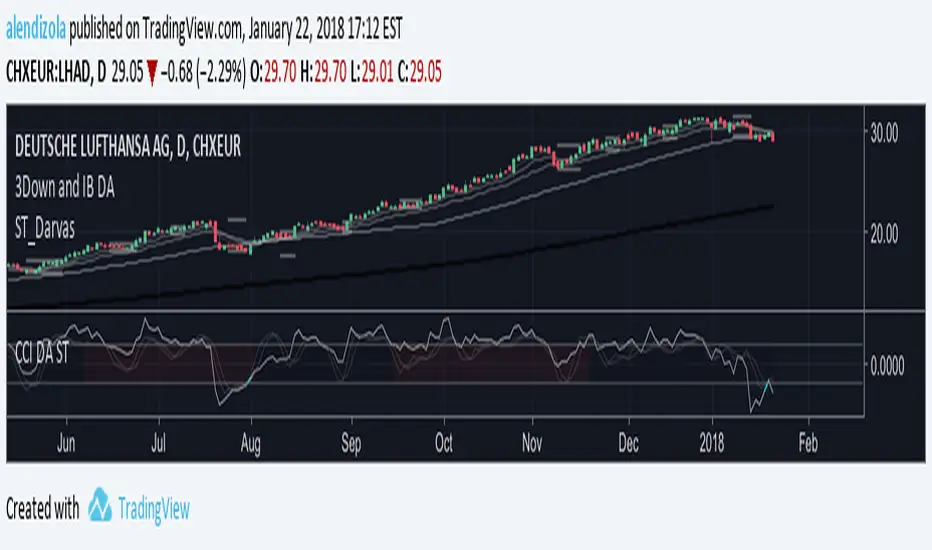
3Down and IB DAScript provides Multiple MAs and checks for 3 Bars down in a row. On top it displays inside Bars. Works best on a daily timeframe with stocks.

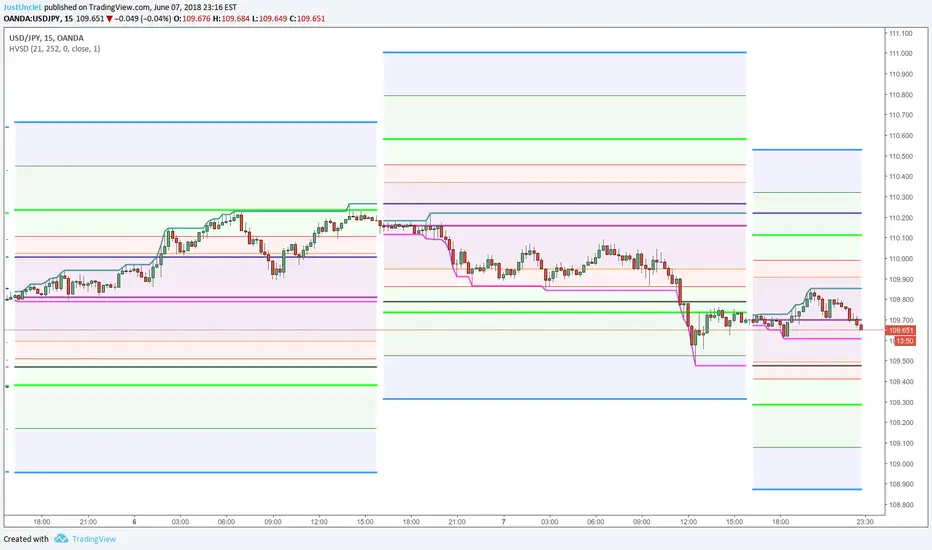
Daily Historical Volatility StdDev LevelsDescription:
This indicator plots Daily Standard deviation levels on price chart based on Historical Volatility (HV). It uses the most common approach for calculating historical volatility as standard deviation of logarithmic returns, based on daily closing/settlement prices.
Assets: Currency Pairs, Commodities, also works on stocks, some indices.
Time Frames: 5min to 60min. This will also work on Daily Chart, by setting "DaystoExpire" to 21
Options:
Use Daily Data to Calculate StdDev HV (default), otherwise use the charts Time Frame
Lookback = number of days/periods to calculate stddev of HV (21 by default)
Annual = number of trading days in a calender year (252 by default)
Days to Expiry = number of days for the life of this option ( for auto calculation
this is 1 for intraday, 21 for daily and annual when chart TF used)
Settlement Source = close price by default, can use another source.
Settlement Volume Weighted Average Length = by setting this to >1 then an average
is used for settlement.
Display ### Standard Deviation Levels = select what levels are to be displayed.
References:
How To Use Standard Deviation In Your Trading Day: www.youtube.com
Deviation Levels Indicator: www.youtube.com
www.macroption.com
Historical Volatility based Standard Deviation_V2 by ucsgears
Historical Volatility Strategy by Hpotter
Average Daily Range - without open barBasic ADR-indicator that is showing the daily range on lower timeframes as well, without using the current open daily bar for calculation.
Also plots as line in a separate indicator window. Updates displayed value when hovering over the candles on the chart to see historical Numbers.

Close of relevant previous periodThis indicator puts the previous close value of a higher relevant time frame on the chart, it adepts to the period of the chart. Relevant means that it puts:
Close of previous year in monthly chart
Close of previous month in weekly chart
Close of either previous month of week in daily chart, default setting is week
Close of previous week in 4hourly and 3hourly charts
Close of previous day in 30minute and higher intraday charts
Not bother the user below 30 minutes.

Weekly closeIt turned out not to be that easy to plot the close of the previous week in hourly or daily charts. In my first experiments things went wrong on Friday or intraday if you simply use the security function. So here is the thing with an algorithm that guaranties the correct value.

[naoligo] Pivot Points (Daily)Suporte/Resistência do Pivot diário para gráficos intraday
Marcação do S/R tradicional e S/R Fibonacci
Daily Pivot Point Support/Resistances on intraday charts
Both Traditional and Fibonacci methods plotted

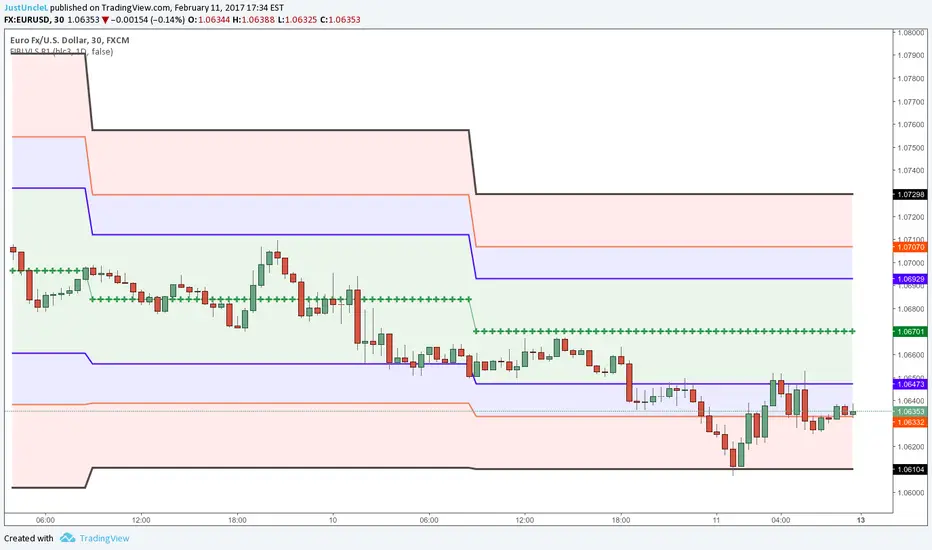
Auto Daily Fib Levels R2 by JustUncleLThis study is a variation of my "Automatic Daily Fibonnacci" indicator. This variation automatically draw Fibonacci Pivot levels (or optionally Classic Pivots) based on the previous day's highest and lowest points. The HLC3 is used as the default Daily Pivot level.
Unlike the "Automatic Daily Fibonnacci", this indicator does not redraw/update levels on current day even if the price goes past the R3/S3 levels.
Timeframe: is just a text string and is not checked, so needs to be a valid resolution eg: 60, 120, 240, 360, 480, 720, 1D, 1W, 1M, 2D, 2W, 3M
Pivot LEVELS:
Green = Pivot and Pivot Zone
Blue = R1,S1 Levels and Zone
Red = R2,S2 Levels and Zone
Black = R3,S3 Levels
Projected high moving stocks based on daily ATRMay be used to find out stocks that have a "relatively" high ATR thereby signifying that it is susceptible to similar moves in the future.

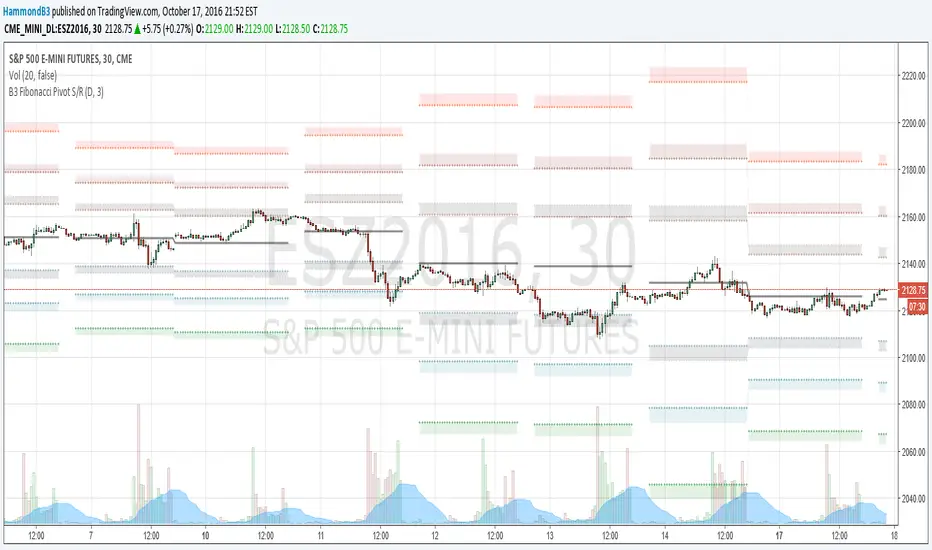
B3 Fibonacci Pivot S/RFor my second share, I give you some levels I look at everyday for the ES minis. HLC/3 of the MTF (multi-time-frame) inputs = mean and Fib-levels formed as support and resistance zones. There are some websites that will show you 20 ways to figure out a pivot for the day's intraday workings, and this one always rang true for me. I keep it set at Res=D and Len=3or5 and use on hourly charts. This indicator is capable of doing like a Res=60m Len=8 for a 5m chart or something of that nature if you wish to test it out.
I haven't tested it out for tick charts and I have noticed that this is good on index and commodity futures, and not so much other things.
Uncanny to me how well this works as reversal awareness for ES. Doesn't mean that one will happen, or if it does that it will have trade-able juice, though it is very important awareness never-the-less.
screencast.com


RSI Oversold/UndersoldThe study script will place GREEN BUY arrows BELOW oversold conditions and RED SHORT arrows ABOVE overbought conditions. You can configure the period
Most RSI(14) indicators use a 14-period, I prefer a 5-period. The period, overbought and oversold periods are settings that can easily be changed by adding this study to your chart and clicking the "gear" icon next to the study inside your chart.

