Cyatophilum BITCOIN Daily IndicatorFree indicator
To get it, add it to your favorites using the button below, then you will find it on your chart in the "favorites scripts" tab
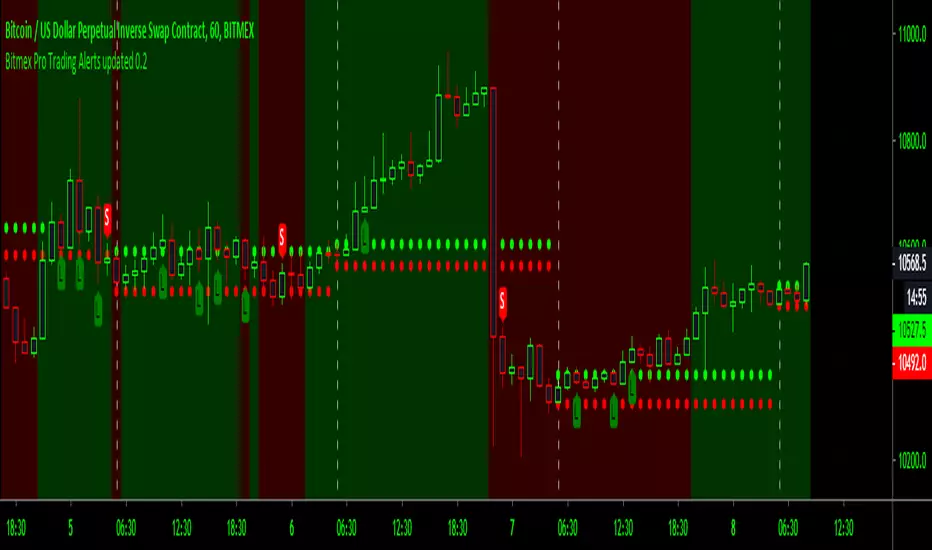
I wanted to have a tool that would quickly show me an overview of the Bitcoin chart each day, and receive alerts when something was happening, so I made this indicator.
Optimized for Bitcoin / USD on the daily timeframe, this indicator uses many technical tools such as a double Donchian channel, momentum, volume, RSI, divergences and moving averages.
HOW TO USE
Signals - You can create Automated Alerts corresponding to the graphic labels on chart.
BUY: Most bullish signal. Go long or buy bitcoin if you haven't already.
⚠️ REVERSAL: The bear trend might be over soon. Prepare some stable coins on your exchange to make sure you are ready to trade.
⚠️ RISE: Very bullish signal meaning a lot of people are buying. At this point you should just follow the sheep herd and buy.
⚠️ DROP: A drop is very likely to happen. Take your profits even though the rally can continue. Most of the time the price will drop significantly.
SELL: Most bearish signal. Go short or sell bitcoin.
Note: Use 'Once per bar close' option when creating alerts to get the exact same signals as on the chart, but only at candle close. Otherwise use 'Oncer per bar' to get them as soon as possible but the graphic-signal can disappear (unvalidated) at candle close.
Parameters
"Show 3 EMAs": Show a 50, 100 and 200 EMA. Usefull for golden/death cross.
"Channel_Length" Length in bars for the double Donchian Channel. Default is 30.
Any feedback is welcome!
To get access to my private strategies, use the link below
Carta Harian

Average Daily Range Label by Theoris (ADR)This indy show Label of
* Last price
* Range of Low - High ( from Average daily range calculation )
* ADR (14 ) default period 14
* value of current range ( pip ) / Average daily range.
Example
now price is
1499.4
( 1486.959 - 1510.841 ) --- > This is range calculate from ADR for normal range.
ADR(14)
58/148.41
meaning use ADR period 14
today run 58 pips
from average 14 period is 148.41 pips
can change period to other normally I use 10 or 14
Timeframe to use default is Daily
Daily RangeHey traders,
at first thanks to the one and only Master Educator Stefan Kassing for sharing his legendary system with us!
And also credit to Mortdiggiddy , RootDuk and PineCoders for helping me with the script =)
This script is calculating the daily range (in pips) of the current market you are in, in relation to the last 70 days (10 weeks) .
It is used for a possible Take Profit in Stefan Kassing's System .
How to add the script to your chart:
1. Click " Add to Favorite Scripts "
-> i.imgur.com
2. Go in the Chart & click the little arrow in the upper bar and then click " Daily Range ", then the Daily Range appears in the top left corner
-> i.imgur.com
To avoid errors make sure to right-click the Y-Axis on the right side of the chart and then left-click "Scale Price Chart Only" .
-> i.imgur.com
Also be aware that the daily range is only showing up , if you are in the daily time interval or below and you are not hovering with the cursor over the past candles respectively above or below them .
If you are using this script in exotic currencypairs or uncommon other markets , the daily range can be incorrect or not showing up .
So don't hesitate contacting me , then I will try to add the markets that you want to.
To change the color or the decimal places of the number, you can click the gear in the upper left corner.
-> i.imgur.com
Happy Pips


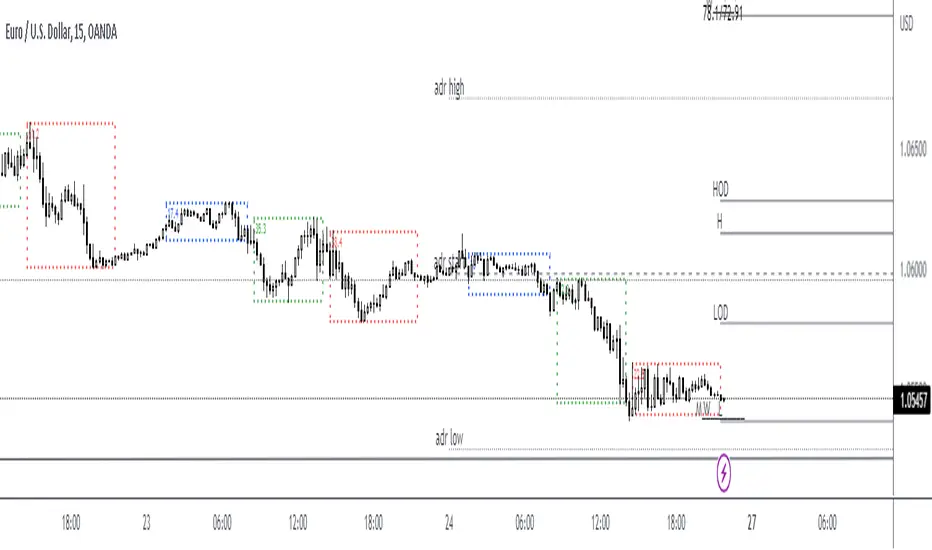
X0_Trading_levelsScript which marks out the trading ranges I often like to have mapped out on the charts:
Mondays Trading range - open, high, low
Daily open, high, low
Weekly open
Monthly open.
Can change all colours

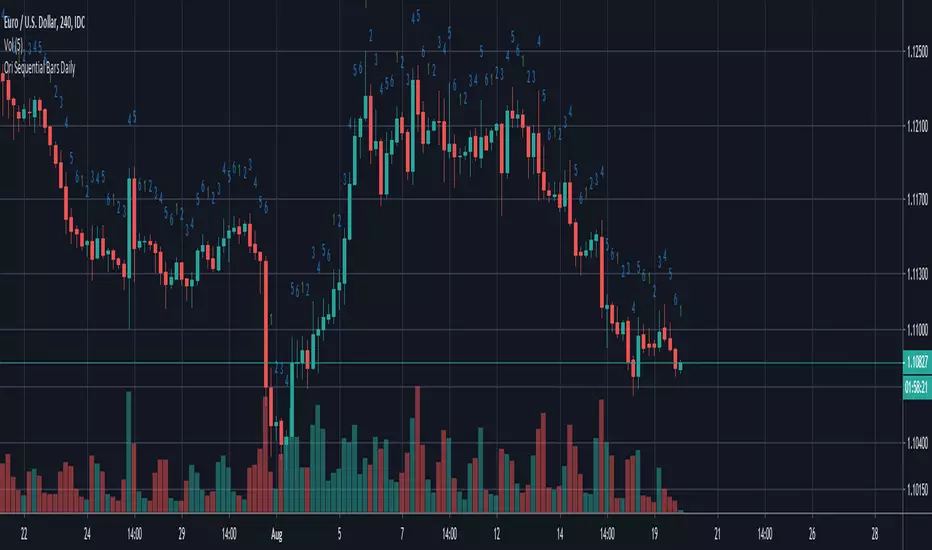
Ori Sequential Bars Daily v2Indicator enumarates the bars from the start of the day to end of the day. Some may prefer the previous on. Because of that i'm publishing this as a seperate indicator.


Ema Daily In current TimeframeThis simple indicator shows the Ema with data extracted from daily timeframe in your current displayed timeframe.
All my scripts: es.tradingview.com

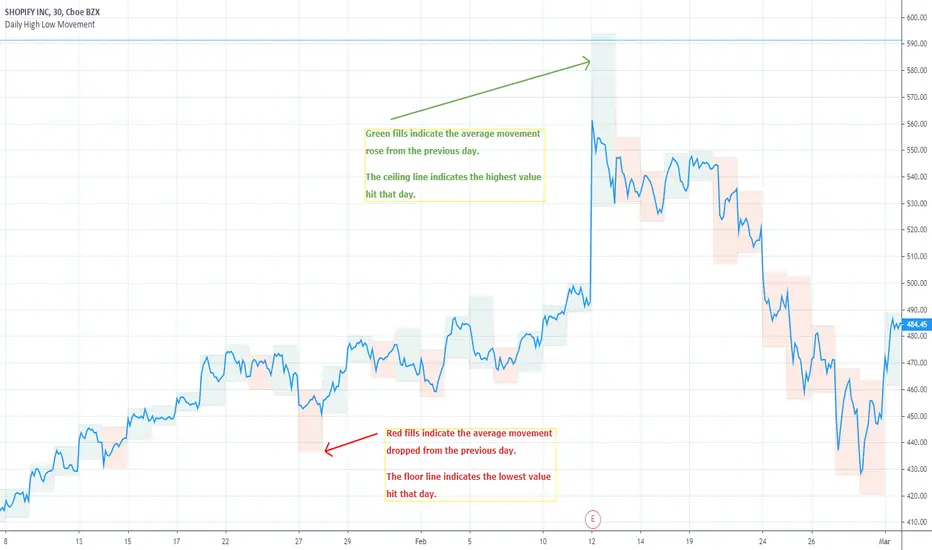
Daily High Low MovementIndicates the daily high and low drawn by green and red lines. Fill blocks indicate the average value movement relevant to the previous day. Green fills indicate that the value is moving higher than the previous day and red meaning lower.
NYSE:BA
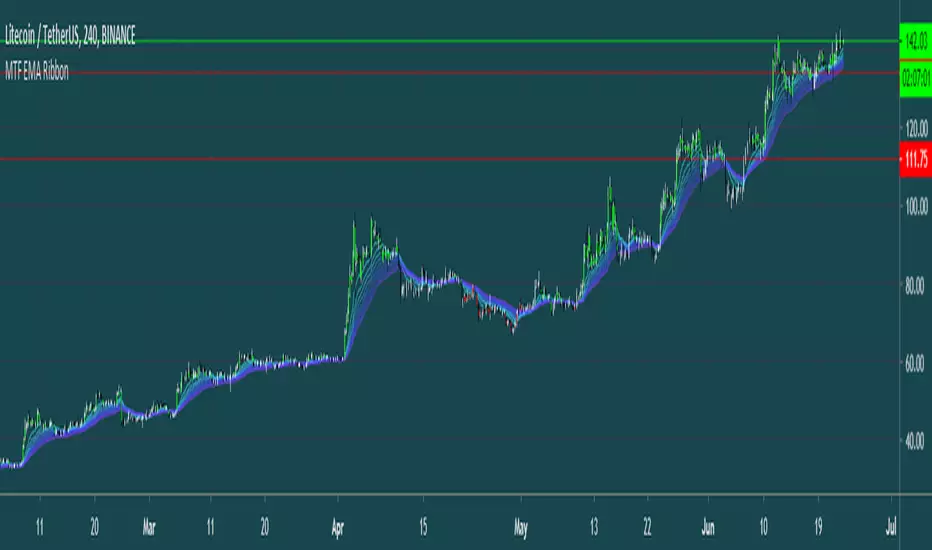
MTF EMA RibbonThis Script analyses trends using an EMA Ribbon (Can be adjusted to any timeframe).
tips are always welcome at: 38uGQJDDZDL6wX48x4gYTccPeQ3ZHVYmY4 (btc)
I hope you enjoy the script :)
CL Daily Bitcoin Volume (All exchange included, even Mt.GOX)This daily volume data contains collective total from
____________________________________________________
Historical:
BTC-e BTC/USD (From Q3 2011 to Q3 2016)
BTCChina BTC/CNY (From Q3 2011 to Q2 2017)
Coinsetter BTC/USD (From Q3 2014 to Q1 2016)
MtGox BTC/USD (From July 2010 - 2014 only))
OKcoin International BTC/USD (From Q3 2014 to Q2 2017)
____________________________________________________
Institutions:
CME Bitcoin Futures
Grayscale Bitcoin Trust OTC
____________________________________________________
Spot exchanges:
Bitfinex BTC/USD
Bitstamp BTC/USD
Coinbase BTC/USD
Coinbase BTC/EUR
Binance BTC/USDT
Binance BTC/USDC
Binance BTC/PAX
Gemini BTC/USD
itBit BTC/USD
Kraken BTC/EUR
Kraken BTC/USD
Huobi BTC/USDT
Korbit BTC/KRW
Bitflyer BTC/JPY
____________________________________________________
Others:
Bitmex

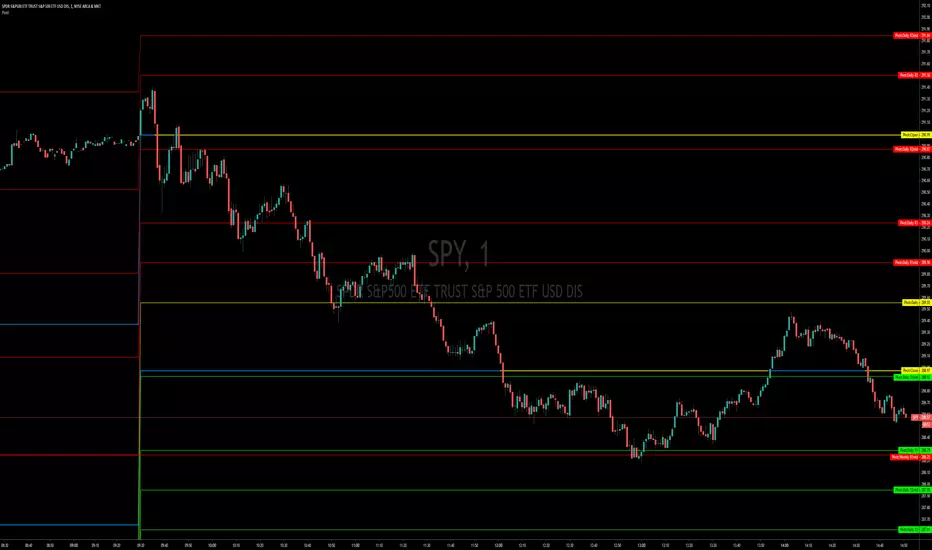
Pivot Points, Daily, Weekly, Open and Close lines What is a Pivot Point?
A pivot point is a technical analysis indicator, or calculations, used to determine the overall trend of the market over different time frames. The pivot point itself is simply the average of the high, low and closing prices from the previous trading day. On the subsequent day, trading above the pivot point is thought to indicate ongoing bullish sentiment, while trading below the pivot point indicates bearish sentiment.
The pivot point is the basis for the indicator, but it also includes other support and resistance levels that are projected based on the pivot point calculation. All these levels help traders see where the price could experience support or resistance. Similarly, if the price moves through these levels it lets the trader know the price is trending in that direction.
When the price of an asset is trading above the pivot point, it indicates the day is bullish or positive.
When the price of an asset is trading below the pivot point, it indicates the day is bearish or negative.
The indicator typically includes four additional levels: S1, S2, R1, and R2. These stand for support one and two, and resistance one and two.
Support and resistance one and two may cause reversals, but they may also be used to confirm the trend. For example, if the price is falling and moves below S1, it helps confirm the downtrend and indicate a possible continuation to S2.
This Script includes the Mid Pivot Points, Open and Close levels

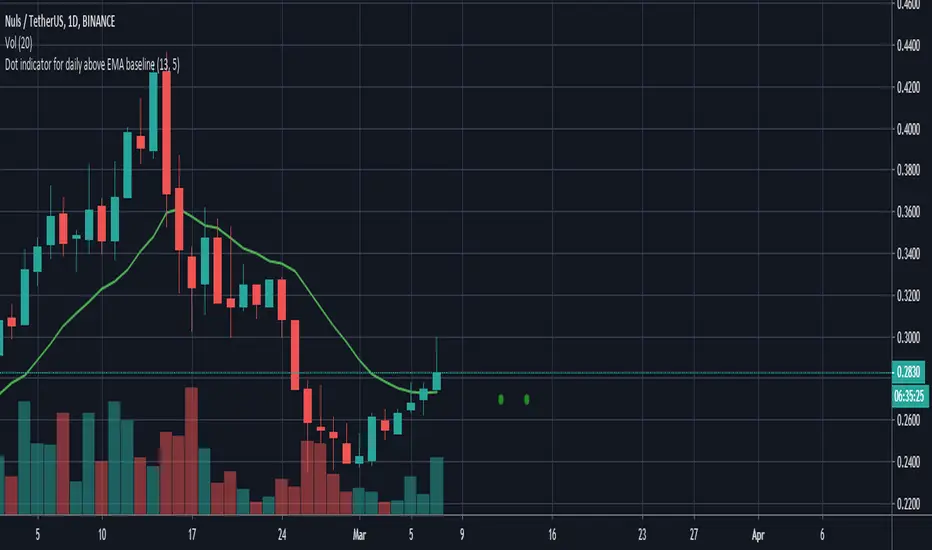
Dot indicator - Daily candle opened above the daily EMA baseline
//@version=3
//Written by David Carruthers
//Objective
//This is to support scanning the market to check if the daily candle opened above the daily EMA baseline for a selected pair
//This can be done in some measure by using trading view's screening tools
//However it would be useful, if someone references a pair, to instantly see if that pair opened above the daily baseline regardless of what resolution you are in
//This script, works out a green dot if the pairs daily candle opened above the daily EMA baseline, and a red dot if it didn't
//It then displays a green or red dot on the open for the last candle you are looking at regardless of resolution
//This saves jumping back and forth between the daily resolution and current resolution
Note please excuse my Pine scripting I am new to it :-)
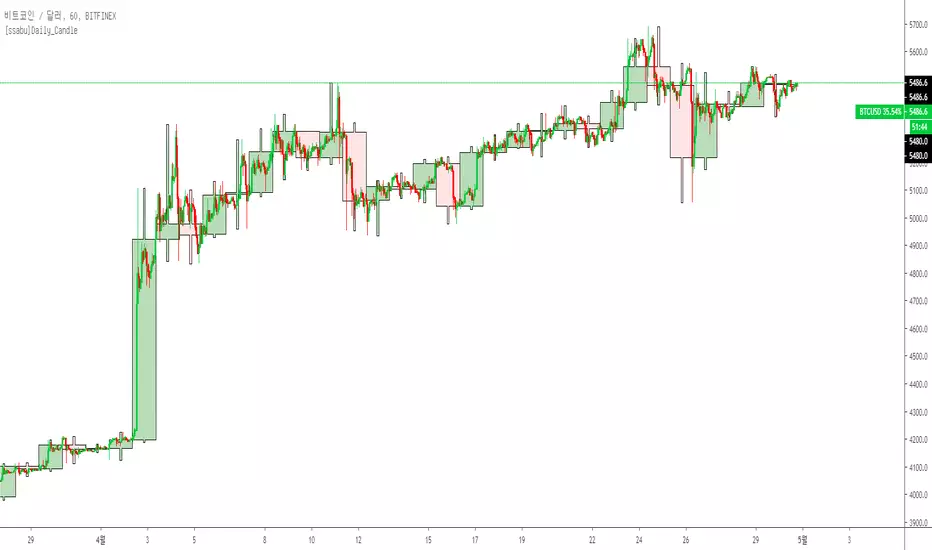
[ssabu]Daily_Candle_Indicator✅ Daily_Candle_Indicator
일봉보다 낮은 프레임에서 일봉의 캔들모습을 배경으로 함께 보여주는 보조지표 입니다.
상승 후에 일봉 상의 음봉에 해당하는 단기조정 및 하락추세 중 일봉상의 지지영역에 해당하는 구간 등등의 여러 구간에서 쓰임을 극대화 할 수 있습니다.
위의 차트 예시는 1시간봉 기준의 차트예시이고 일봉 이하의 모든 프레임에서 사용이 가능합니다.
It is a supplementary indicator that shows together the background of a candle in the frame from the frame lower than the one.
After the rise, you can maximize its use in various sections of the short-term adjustment and downward trend corresponding to the apron on the apron,
the section corresponding to the support area on the apron.
The chart example above is an example of a one-hour bar chart and can be used in all frames below one bar.
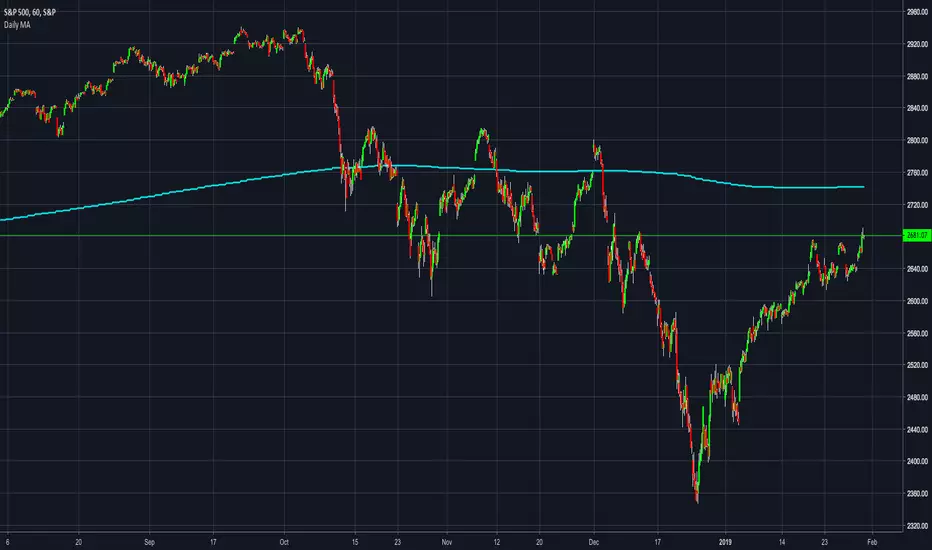
Daily & 4H Moving AveragesThis indicator shows the 99MA daily (dotted) and 4H (solid) moving averages on all timeframes. It defaults to the 99MA, but you can change it to 25MA or whatever your heart desires. Why would you want to use this? Cause the 99MA is like magic for altcoins, presumably because it's the largest default MA on Binance and lots of people are watching it.
If you can see where the daily and 4h MA lines are, even while looking at a 1h or 30m chart, then you'll know more about the areas where price might do predictable stuff.

Daily OHLC UpdatedThis plots the daily OHLC values as well as a few other options.
The base indicator plots and colors a daily open line. When line is green close is above open. When line is red close is below day open.
You can also turn on background highlighting.
Background will be green (default) If close is above day open
Background will be red (default) If close is below day open
There is also an option to turn on indicators on the bottom of your chart:
Arrow up will be green (default) If close is above day open
Arrow down will be red (default) If close is below day open
Next version will be adding alerts.

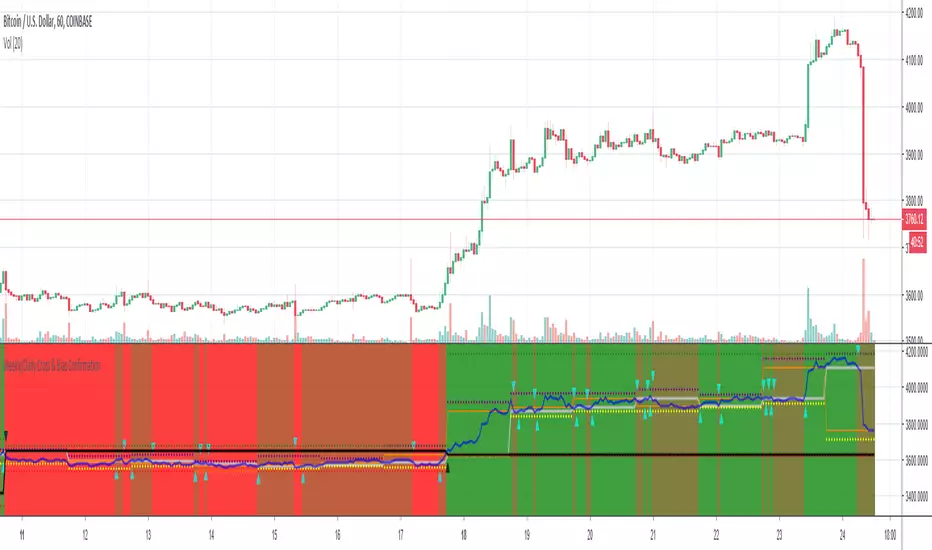
Weekly/Daily Cross & Bias ConfirmationThis indicator plots the weekly and daily open in addition to a current close price line.
It also signals when price closes above or below the daily and weekly opens.
Also, the bull/bear bias is painted on this indicator as well.
Black is the weekly open
Silver is the daily open
Weekly is default black arrows. Up is going above open, down is going below
Daily is default aqua arrows. Up is going above, down is going below
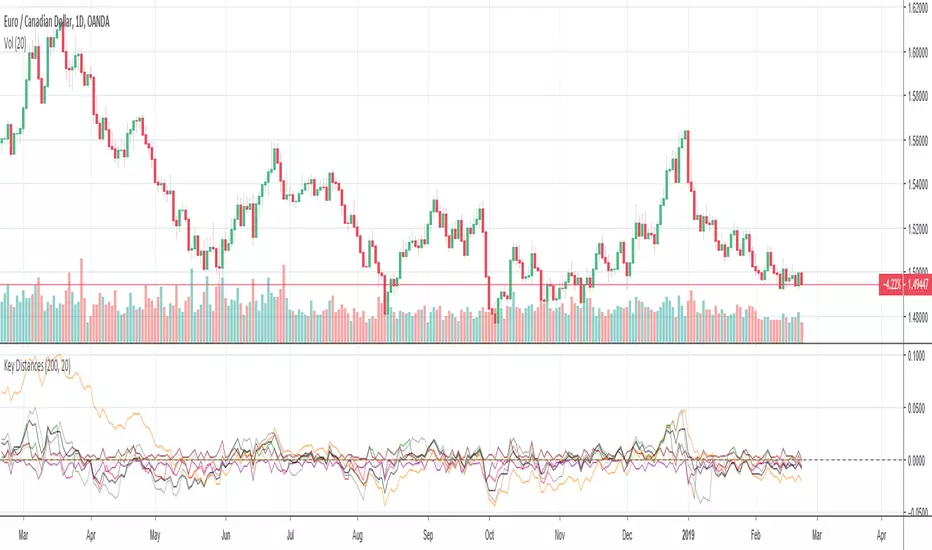
Key Distances (Weekly, Daily Open, & EMA)This indicator provides the pip value from various key levels I've found important in my trading system.
The results are graphed. I suggest that you choose the 2 most important ones you want to graph otherwise the indicator gets difficult to read.
The important data is the actual numbers but I've found it helpful to understand how a ticker moves in regards to weekly open and distance from 200EMA to be most helpful.
Here is the order of the data listed:
Distance from weekly open (green if above open, red if below open, also paints color on line)
Distance from last week opening price
Distance from daily open
Distance to 200EMA
Future Possible Updates:
- customized EMA
- Distance from weekly low/high
Custom Timeframe Indicators(MA,EMA,BB) [CryptoProSignal]This is a combination of 3 types of indicators :
1) Simple Moving Average
2) Exponential Moving Average
3) Bollinger Band
Idea is to plot any of the above indicator with a particular period length from a different timeframe to the timeframe on which you are currently working.
eg : As shown in the chart we have indicator plots from daily timeframe plotted/shown on the current 4hr time frame .
Similarly, you can have indicator plots from 4hr timeframe to be shown on any other timeframe and so on.
Basically you can select plots from any timeframe to work with on any other timeframe of your liking .
Not a rocket science, just play around with it and you will understand :)
