Bar Index & TimeLibrary to convert a bar index to a timestamp and vice versa.
Utilizes runtime memory to store the 𝚝𝚒𝚖𝚎 and 𝚝𝚒𝚖𝚎_𝚌𝚕𝚘𝚜𝚎 values of every bar on the chart (and optional future bars), with the ability of storing additional custom values for every chart bar.
█ PREFACE
This library aims to tackle some problems that pine coders (from beginners to advanced) often come across, such as:
I'm trying to draw an object with a 𝚋𝚊𝚛_𝚒𝚗𝚍𝚎𝚡 that is more than 10,000 bars into the past, but this causes my script to fail. How can I convert the 𝚋𝚊𝚛_𝚒𝚗𝚍𝚎𝚡 to a UNIX time so that I can draw visuals using xloc.bar_time ?
I have a diagonal line drawing and I want to get the "y" value at a specific time, but line.get_price() only accepts a bar index value. How can I convert the timestamp into a bar index value so that I can still use this function?
I want to get a previous 𝚘𝚙𝚎𝚗 value that occurred at a specific timestamp. How can I convert the timestamp into a historical offset so that I can use 𝚘𝚙𝚎𝚗 ?
I want to reference a very old value for a variable. How can I access a previous value that is older than the maximum historical buffer size of 𝚟𝚊𝚛𝚒𝚊𝚋𝚕𝚎 ?
This library can solve the above problems (and many more) with the addition of a few lines of code, rather than requiring the coder to refactor their script to accommodate the limitations.
█ OVERVIEW
The core functionality provided is conversion between xloc.bar_index and xloc.bar_time values.
The main component of the library is the 𝙲𝚑𝚊𝚛𝚝𝙳𝚊𝚝𝚊 object, created via the 𝚌𝚘𝚕𝚕𝚎𝚌𝚝𝙲𝚑𝚊𝚛𝚝𝙳𝚊𝚝𝚊() function which basically stores the 𝚝𝚒𝚖𝚎 and 𝚝𝚒𝚖𝚎_𝚌𝚕𝚘𝚜𝚎 of every bar on the chart, and there are 3 more overloads to this function that allow collecting and storing additional data. Once a 𝙲𝚑𝚊𝚛𝚝𝙳𝚊𝚝𝚊 object is created, use any of the exported methods:
Methods to convert a UNIX timestamp into a bar index or bar offset:
𝚝𝚒𝚖𝚎𝚜𝚝𝚊𝚖𝚙𝚃𝚘𝙱𝚊𝚛𝙸𝚗𝚍𝚎𝚡(), 𝚐𝚎𝚝𝙽𝚞𝚖𝚋𝚎𝚛𝙾𝚏𝙱𝚊𝚛𝚜𝙱𝚊𝚌𝚔()
Methods to retrieve the stored data for a bar index:
𝚝𝚒𝚖𝚎𝙰𝚝𝙱𝚊𝚛𝙸𝚗𝚍𝚎𝚡(), 𝚝𝚒𝚖𝚎𝙲𝚕𝚘𝚜𝚎𝙰𝚝𝙱𝚊𝚛𝙸𝚗𝚍𝚎𝚡(), 𝚟𝚊𝚕𝚞𝚎𝙰𝚝𝙱𝚊𝚛𝙸𝚗𝚍𝚎𝚡(), 𝚐𝚎𝚝𝙰𝚕𝚕𝚅𝚊𝚛𝚒𝚊𝚋𝚕𝚎𝚜𝙰𝚝𝙱𝚊𝚛𝙸𝚗𝚍𝚎𝚡()
Methods to retrieve the stored data at a number of bars back (i.e., historical offset):
𝚝𝚒𝚖𝚎(), 𝚝𝚒𝚖𝚎𝙲𝚕𝚘𝚜𝚎(), 𝚟𝚊𝚕𝚞𝚎()
Methods to retrieve all the data points from the earliest bar (or latest bar) stored in memory, which can be useful for debugging purposes:
𝚐𝚎𝚝𝙴𝚊𝚛𝚕𝚒𝚎𝚜𝚝𝚂𝚝𝚘𝚛𝚎𝚍𝙳𝚊𝚝𝚊(), 𝚐𝚎𝚝𝙻𝚊𝚝𝚎𝚜𝚝𝚂𝚝𝚘𝚛𝚎𝚍𝙳𝚊𝚝𝚊()
Note: the library's strong suit is referencing data from very old bars in the past, which is especially useful for scripts that perform its necessary calculations only on the last bar.
█ USAGE
Step 1
Import the library. Replace with the latest available version number for this library.
//@version=6
indicator("Usage")
import n00btraders/ChartData/
Step 2
Create a 𝙲𝚑𝚊𝚛𝚝𝙳𝚊𝚝𝚊 object to collect data on every bar. Do not declare as `var` or `varip`.
chartData = ChartData.collectChartData() // call on every bar to accumulate the necessary data
Step 3
Call any method(s) on the 𝙲𝚑𝚊𝚛𝚝𝙳𝚊𝚝𝚊 object. Do not modify its fields directly.
if barstate.islast
int firstBarTime = chartData.timeAtBarIndex(0)
int lastBarTime = chartData.time(0)
log.info("First `time`: " + str.format_time(firstBarTime) + ", Last `time`: " + str.format_time(lastBarTime))
█ EXAMPLES
• Collect Future Times
The overloaded 𝚌𝚘𝚕𝚕𝚎𝚌𝚝𝙲𝚑𝚊𝚛𝚝𝙳𝚊𝚝𝚊() functions that accept a 𝚋𝚊𝚛𝚜𝙵𝚘𝚛𝚠𝚊𝚛𝚍 argument can additionally store time values for up to 500 bars into the future.
//@version=6
indicator("Example `collectChartData(barsForward)`")
import n00btraders/ChartData/1
chartData = ChartData.collectChartData(barsForward = 500)
var rectangle = box.new(na, na, na, na, xloc = xloc.bar_time, force_overlay = true)
if barstate.islast
int futureTime = chartData.timeAtBarIndex(bar_index + 100)
int lastBarTime = time
box.set_lefttop(rectangle, lastBarTime, open)
box.set_rightbottom(rectangle, futureTime, close)
box.set_text(rectangle, "Extending box 100 bars to the right. Time: " + str.format_time(futureTime))
• Collect Custom Data
The overloaded 𝚌𝚘𝚕𝚕𝚎𝚌𝚝𝙲𝚑𝚊𝚛𝚝𝙳𝚊𝚝𝚊() functions that accept a 𝚟𝚊𝚛𝚒𝚊𝚋𝚕𝚎𝚜 argument can additionally store custom user-specified values for every bar on the chart.
//@version=6
indicator("Example `collectChartData(variables)`")
import n00btraders/ChartData/1
var map variables = map.new()
variables.put("open", open)
variables.put("close", close)
variables.put("open-close midpoint", (open + close) / 2)
variables.put("boolean", open > close ? 1 : 0)
chartData = ChartData.collectChartData(variables = variables)
var fgColor = chart.fg_color
var table1 = table.new(position.top_right, 2, 9, color(na), fgColor, 1, fgColor, 1, true)
var table2 = table.new(position.bottom_right, 2, 9, color(na), fgColor, 1, fgColor, 1, true)
if barstate.isfirst
table.cell(table1, 0, 0, "ChartData.value()", text_color = fgColor)
table.cell(table2, 0, 0, "open ", text_color = fgColor)
table.merge_cells(table1, 0, 0, 1, 0)
table.merge_cells(table2, 0, 0, 1, 0)
for i = 1 to 8
table.cell(table1, 0, i, text_color = fgColor, text_halign = text.align_left, text_font_family = font.family_monospace)
table.cell(table2, 0, i, text_color = fgColor, text_halign = text.align_left, text_font_family = font.family_monospace)
table.cell(table1, 1, i, text_color = fgColor)
table.cell(table2, 1, i, text_color = fgColor)
if barstate.islast
for i = 1 to 8
float open1 = chartData.value("open", 5000 * i)
float open2 = i < 3 ? open : -1
table.cell_set_text(table1, 0, i, "chartData.value(\"open\", " + str.tostring(5000 * i) + "): ")
table.cell_set_text(table2, 0, i, "open : ")
table.cell_set_text(table1, 1, i, str.tostring(open1))
table.cell_set_text(table2, 1, i, open2 >= 0 ? str.tostring(open2) : "Error")
• xloc.bar_index → xloc.bar_time
The 𝚝𝚒𝚖𝚎 value (or 𝚝𝚒𝚖𝚎_𝚌𝚕𝚘𝚜𝚎 value) can be retrieved for any bar index that is stored in memory by the 𝙲𝚑𝚊𝚛𝚝𝙳𝚊𝚝𝚊 object.
//@version=6
indicator("Example `timeAtBarIndex()`")
import n00btraders/ChartData/1
chartData = ChartData.collectChartData()
if barstate.islast
int start = bar_index - 15000
int end = bar_index - 100
// line.new(start, close, end, close) // !ERROR - `start` value is too far from current bar index
start := chartData.timeAtBarIndex(start)
end := chartData.timeAtBarIndex(end)
line.new(start, close, end, close, xloc.bar_time, width = 10)
• xloc.bar_time → xloc.bar_index
Use 𝚝𝚒𝚖𝚎𝚜𝚝𝚊𝚖𝚙𝚃𝚘𝙱𝚊𝚛𝙸𝚗𝚍𝚎𝚡() to find the bar that a timestamp belongs to.
If the timestamp falls in between the close of one bar and the open of the next bar,
the 𝚜𝚗𝚊𝚙 parameter can be used to determine which bar to choose:
𝚂𝚗𝚊𝚙.𝙻𝙴𝙵𝚃 - prefer to choose the leftmost bar (typically used for closing times)
𝚂𝚗𝚊𝚙.𝚁𝙸𝙶𝙷𝚃 - prefer to choose the rightmost bar (typically used for opening times)
𝚂𝚗𝚊𝚙.𝙳𝙴𝙵𝙰𝚄𝙻𝚃 (or 𝚗𝚊) - copies the same behavior as xloc.bar_time uses for drawing objects
//@version=6
indicator("Example `timestampToBarIndex()`")
import n00btraders/ChartData/1
startTimeInput = input.time(timestamp("01 Aug 2025 08:30 -0500"), "Session Start Time")
endTimeInput = input.time(timestamp("01 Aug 2025 15:15 -0500"), "Session End Time")
chartData = ChartData.collectChartData()
if barstate.islastconfirmedhistory
int startBarIndex = chartData.timestampToBarIndex(startTimeInput, ChartData.Snap.RIGHT)
int endBarIndex = chartData.timestampToBarIndex(endTimeInput, ChartData.Snap.LEFT)
line1 = line.new(startBarIndex, 0, startBarIndex, 1, extend = extend.both, color = color.new(color.green, 60), force_overlay = true)
line2 = line.new(endBarIndex, 0, endBarIndex, 1, extend = extend.both, color = color.new(color.green, 60), force_overlay = true)
linefill.new(line1, line2, color.new(color.green, 90))
// using Snap.DEFAULT to show that it is equivalent to drawing lines using `xloc.bar_time` (i.e., it aligns to the same bars)
startBarIndex := chartData.timestampToBarIndex(startTimeInput)
endBarIndex := chartData.timestampToBarIndex(endTimeInput)
line.new(startBarIndex, 0, startBarIndex, 1, extend = extend.both, color = color.yellow, width = 3)
line.new(endBarIndex, 0, endBarIndex, 1, extend = extend.both, color = color.yellow, width = 3)
line.new(startTimeInput, 0, startTimeInput, 1, xloc.bar_time, extend.both, color.new(color.blue, 85), width = 11)
line.new(endTimeInput, 0, endTimeInput, 1, xloc.bar_time, extend.both, color.new(color.blue, 85), width = 11)
• Get Price of Line at Timestamp
The pine script built-in function line.get_price() requires working with bar index values. To get the price of a line in terms of a timestamp, convert the timestamp into a bar index or offset.
//@version=6
indicator("Example `line.get_price()` at timestamp")
import n00btraders/ChartData/1
lineStartInput = input.time(timestamp("01 Aug 2025 08:30 -0500"), "Line Start")
chartData = ChartData.collectChartData()
var diagonal = line.new(na, na, na, na, force_overlay = true)
if time <= lineStartInput
line.set_xy1(diagonal, bar_index, open)
if barstate.islastconfirmedhistory
line.set_xy2(diagonal, bar_index, close)
if barstate.islast
int timeOneWeekAgo = timenow - (7 * timeframe.in_seconds("1D") * 1000)
// Note: could also use `timetampToBarIndex(timeOneWeekAgo, Snap.DEFAULT)` and pass the value directly to `line.get_price()`
int barsOneWeekAgo = chartData.getNumberOfBarsBack(timeOneWeekAgo)
float price = line.get_price(diagonal, bar_index - barsOneWeekAgo)
string formatString = "Time 1 week ago: {0,number,#} - Equivalent to {1} bars ago 𝚕𝚒𝚗𝚎.𝚐𝚎𝚝_𝚙𝚛𝚒𝚌𝚎(): {2,number,#.##}"
string labelText = str.format(formatString, timeOneWeekAgo, barsOneWeekAgo, price)
label.new(timeOneWeekAgo, price, labelText, xloc.bar_time, style = label.style_label_lower_right, size = 16, textalign = text.align_left, force_overlay = true)
█ RUNTIME ERROR MESSAGES
This library's functions will generate a custom runtime error message in the following cases:
𝚌𝚘𝚕𝚕𝚎𝚌𝚝𝙲𝚑𝚊𝚛𝚝𝙳𝚊𝚝𝚊() is not called consecutively, or is called more than once on a single bar
Invalid 𝚋𝚊𝚛𝚜𝙵𝚘𝚛𝚠𝚊𝚛𝚍 argument in the 𝚌𝚘𝚕𝚕𝚎𝚌𝚝𝙲𝚑𝚊𝚛𝚝𝙳𝚊𝚝𝚊() function
Invalid 𝚟𝚊𝚛𝚒𝚊𝚋𝚕𝚎𝚜 argument in the 𝚌𝚘𝚕𝚕𝚎𝚌𝚝𝙲𝚑𝚊𝚛𝚝𝙳𝚊𝚝𝚊() function
Invalid 𝚕𝚎𝚗𝚐𝚝𝚑 argument in any of the functions that accept a number of bars back
Note: there is no runtime error generated for an invalid 𝚝𝚒𝚖𝚎𝚜𝚝𝚊𝚖𝚙 or 𝚋𝚊𝚛𝙸𝚗𝚍𝚎𝚡 argument in any of the functions. Instead, the functions will assign 𝚗𝚊 to the returned values.
Any other runtime errors are due to incorrect usage of the library.
█ NOTES
• Function Descriptions
The library source code uses Markdown for the exported functions. Hover over a function/method call in the Pine Editor to display formatted, detailed information about the function/method.
//@version=6
indicator("Demo Function Tooltip")
import n00btraders/ChartData/1
chartData = ChartData.collectChartData()
int barIndex = chartData.timestampToBarIndex(timenow)
log.info(str.tostring(barIndex))
• Historical vs. Realtime Behavior
Under the hood, the data collector for this library is declared as `var`. Because of this, the 𝙲𝚑𝚊𝚛𝚝𝙳𝚊𝚝𝚊 object will always reflect the latest available data on realtime updates. Any data that is recorded for historical bars will remain unchanged throughout the execution of a script.
//@version=6
indicator("Demo Realtime Behavior")
import n00btraders/ChartData/1
var map variables = map.new()
variables.put("open", open)
variables.put("close", close)
chartData = ChartData.collectChartData(variables)
if barstate.isrealtime
varip float initialOpen = open
varip float initialClose = close
varip int updateCount = 0
updateCount += 1
float latestOpen = open
float latestClose = close
float recordedOpen = chartData.valueAtBarIndex("open", bar_index)
float recordedClose = chartData.valueAtBarIndex("close", bar_index)
string formatString = "# of updates: {0} 𝚘𝚙𝚎𝚗 at update #1: {1,number,#.##} 𝚌𝚕𝚘𝚜𝚎 at update #1: {2,number,#.##} "
+ "𝚘𝚙𝚎𝚗 at update #{0}: {3,number,#.##} 𝚌𝚕𝚘𝚜𝚎 at update #{0}: {4,number,#.##} "
+ "𝚘𝚙𝚎𝚗 stored in memory: {5,number,#.##} 𝚌𝚕𝚘𝚜𝚎 stored in memory: {6,number,#.##}"
string labelText = str.format(formatString, updateCount, initialOpen, initialClose, latestOpen, latestClose, recordedOpen, recordedClose)
label.new(bar_index, close, labelText, style = label.style_label_left, force_overlay = true)
• Collecting Chart Data for Other Contexts
If your use case requires collecting chart data from another context, avoid directly retrieving the 𝙲𝚑𝚊𝚛𝚝𝙳𝚊𝚝𝚊 object as this may exceed memory limits .
//@version=6
indicator("Demo Return Calculated Results")
import n00btraders/ChartData/1
timeInput = input.time(timestamp("01 Sep 2025 08:30 -0500"), "Time")
var int oneMinuteBarsAgo = na
// !ERROR - Memory Limits Exceeded
// chartDataArray = request.security_lower_tf(syminfo.tickerid, "1", ChartData.collectChartData())
// oneMinuteBarsAgo := chartDataArray.last().getNumberOfBarsBack(timeInput)
// function that returns calculated results (a single integer value instead of an entire `ChartData` object)
getNumberOfBarsBack() =>
chartData = ChartData.collectChartData()
chartData.getNumberOfBarsBack(timeInput)
calculatedResultsArray = request.security_lower_tf(syminfo.tickerid, "1", getNumberOfBarsBack())
oneMinuteBarsAgo := calculatedResultsArray.size() > 0 ? calculatedResultsArray.last() : na
if barstate.islast
string labelText = str.format("The selected timestamp occurs 1-minute bars ago", oneMinuteBarsAgo)
label.new(bar_index, hl2, labelText, style = label.style_label_left, size = 16, force_overlay = true)
• Memory Usage
The library's convenience and ease of use comes at the cost of increased usage of computational resources. For simple scripts, using this library will likely not cause any issues with exceeding memory limits. But for large and complex scripts, you can reduce memory issues by specifying a lower 𝚌𝚊𝚕𝚌_𝚋𝚊𝚛𝚜_𝚌𝚘𝚞𝚗𝚝 amount in the indicator() or strategy() declaration statement.
//@version=6
// !ERROR - Memory Limits Exceeded using the default number of bars available (~20,000 bars for Premium plans)
//indicator("Demo `calc_bars_count` parameter")
// Reduce number of bars using `calc_bars_count` parameter
indicator("Demo `calc_bars_count` parameter", calc_bars_count = 15000)
import n00btraders/ChartData/1
map variables = map.new()
variables.put("open", open)
variables.put("close", close)
variables.put("weekofyear", weekofyear)
variables.put("dayofmonth", dayofmonth)
variables.put("hour", hour)
variables.put("minute", minute)
variables.put("second", second)
// simulate large memory usage
chartData0 = ChartData.collectChartData(variables)
chartData1 = ChartData.collectChartData(variables)
chartData2 = ChartData.collectChartData(variables)
chartData3 = ChartData.collectChartData(variables)
chartData4 = ChartData.collectChartData(variables)
chartData5 = ChartData.collectChartData(variables)
chartData6 = ChartData.collectChartData(variables)
chartData7 = ChartData.collectChartData(variables)
chartData8 = ChartData.collectChartData(variables)
chartData9 = ChartData.collectChartData(variables)
log.info(str.tostring(chartData0.time(0)))
log.info(str.tostring(chartData1.time(0)))
log.info(str.tostring(chartData2.time(0)))
log.info(str.tostring(chartData3.time(0)))
log.info(str.tostring(chartData4.time(0)))
log.info(str.tostring(chartData5.time(0)))
log.info(str.tostring(chartData6.time(0)))
log.info(str.tostring(chartData7.time(0)))
log.info(str.tostring(chartData8.time(0)))
log.info(str.tostring(chartData9.time(0)))
if barstate.islast
result = table.new(position.middle_right, 1, 1, force_overlay = true)
table.cell(result, 0, 0, "Script Execution Successful ✅", text_size = 40)
█ EXPORTED ENUMS
Snap
Behavior for determining the bar that a timestamp belongs to.
Fields:
LEFT : Snap to the leftmost bar.
RIGHT : Snap to the rightmost bar.
DEFAULT : Default `xloc.bar_time` behavior.
Note: this enum is used for the 𝚜𝚗𝚊𝚙 parameter of 𝚝𝚒𝚖𝚎𝚜𝚝𝚊𝚖𝚙𝚃𝚘𝙱𝚊𝚛𝙸𝚗𝚍𝚎𝚡().
█ EXPORTED TYPES
Note: users of the library do not need to worry about directly accessing the fields of these types; all computations are done through method calls on an object of the 𝙲𝚑𝚊𝚛𝚝𝙳𝚊𝚝𝚊 type.
Variable
Represents a user-specified variable that can be tracked on every chart bar.
Fields:
name (series string) : Unique identifier for the variable.
values (array) : The array of stored values (one value per chart bar).
ChartData
Represents data for all bars on a chart.
Fields:
bars (series int) : Current number of bars on the chart.
timeValues (array) : The `time` values of all chart (and future) bars.
timeCloseValues (array) : The `time_close` values of all chart (and future) bars.
variables (array) : Additional custom values to track on all chart bars.
█ EXPORTED FUNCTIONS
collectChartData()
Collects and tracks the `time` and `time_close` value of every bar on the chart.
Returns: `ChartData` object to convert between `xloc.bar_index` and `xloc.bar_time`.
collectChartData(barsForward)
Collects and tracks the `time` and `time_close` value of every bar on the chart as well as a specified number of future bars.
Parameters:
barsForward (simple int) : Number of future bars to collect data for.
Returns: `ChartData` object to convert between `xloc.bar_index` and `xloc.bar_time`.
collectChartData(variables)
Collects and tracks the `time` and `time_close` value of every bar on the chart. Additionally, tracks a custom set of variables for every chart bar.
Parameters:
variables (simple map) : Custom values to collect on every chart bar.
Returns: `ChartData` object to convert between `xloc.bar_index` and `xloc.bar_time`.
collectChartData(barsForward, variables)
Collects and tracks the `time` and `time_close` value of every bar on the chart as well as a specified number of future bars. Additionally, tracks a custom set of variables for every chart bar.
Parameters:
barsForward (simple int) : Number of future bars to collect data for.
variables (simple map) : Custom values to collect on every chart bar.
Returns: `ChartData` object to convert between `xloc.bar_index` and `xloc.bar_time`.
█ EXPORTED METHODS
method timestampToBarIndex(chartData, timestamp, snap)
Converts a UNIX timestamp to a bar index.
Namespace types: ChartData
Parameters:
chartData (series ChartData) : The `ChartData` object.
timestamp (series int) : A UNIX time.
snap (series Snap) : A `Snap` enum value.
Returns: A bar index, or `na` if unable to find the appropriate bar index.
method getNumberOfBarsBack(chartData, timestamp)
Converts a UNIX timestamp to a history-referencing length (i.e., number of bars back).
Namespace types: ChartData
Parameters:
chartData (series ChartData) : The `ChartData` object.
timestamp (series int) : A UNIX time.
Returns: A bar offset, or `na` if unable to find a valid number of bars back.
method timeAtBarIndex(chartData, barIndex)
Retrieves the `time` value for the specified bar index.
Namespace types: ChartData
Parameters:
chartData (series ChartData) : The `ChartData` object.
barIndex (int) : The bar index.
Returns: The `time` value, or `na` if there is no `time` stored for the bar index.
method time(chartData, length)
Retrieves the `time` value of the bar that is `length` bars back relative to the latest bar.
Namespace types: ChartData
Parameters:
chartData (series ChartData) : The `ChartData` object.
length (series int) : Number of bars back.
Returns: The `time` value `length` bars ago, or `na` if there is no `time` stored for that bar.
method timeCloseAtBarIndex(chartData, barIndex)
Retrieves the `time_close` value for the specified bar index.
Namespace types: ChartData
Parameters:
chartData (series ChartData) : The `ChartData` object.
barIndex (series int) : The bar index.
Returns: The `time_close` value, or `na` if there is no `time_close` stored for the bar index.
method timeClose(chartData, length)
Retrieves the `time_close` value of the bar that is `length` bars back from the latest bar.
Namespace types: ChartData
Parameters:
chartData (series ChartData) : The `ChartData` object.
length (series int) : Number of bars back.
Returns: The `time_close` value `length` bars ago, or `na` if there is none stored.
method valueAtBarIndex(chartData, name, barIndex)
Retrieves the value of a custom variable for the specified bar index.
Namespace types: ChartData
Parameters:
chartData (series ChartData) : The `ChartData` object.
name (series string) : The variable name.
barIndex (series int) : The bar index.
Returns: The value of the variable, or `na` if that variable is not stored for the bar index.
method value(chartData, name, length)
Retrieves a variable value of the bar that is `length` bars back relative to the latest bar.
Namespace types: ChartData
Parameters:
chartData (series ChartData) : The `ChartData` object.
name (series string) : The variable name.
length (series int) : Number of bars back.
Returns: The value `length` bars ago, or `na` if that variable is not stored for the bar index.
method getAllVariablesAtBarIndex(chartData, barIndex)
Retrieves all custom variables for the specified bar index.
Namespace types: ChartData
Parameters:
chartData (series ChartData) : The `ChartData` object.
barIndex (series int) : The bar index.
Returns: Map of all custom variables that are stored for the specified bar index.
method getEarliestStoredData(chartData)
Gets all values from the earliest bar data that is currently stored in memory.
Namespace types: ChartData
Parameters:
chartData (series ChartData) : The `ChartData` object.
Returns: A tuple:
method getLatestStoredData(chartData, futureData)
Gets all values from the latest bar data that is currently stored in memory.
Namespace types: ChartData
Parameters:
chartData (series ChartData) : The `ChartData` object.
futureData (series bool) : Whether to include the future data that is stored in memory.
Returns: A tuple:
DATA

Correlation HeatMap Matrix Data [TradingFinder]🔵 Introduction
Correlation is a statistical measure that shows the degree and direction of a linear relationship between two assets.
Its value ranges from -1 to +1 : +1 means perfect positive correlation, 0 means no linear relationship, and -1 means perfect negative correlation.
In financial markets, correlation is used for portfolio diversification, risk management, pairs trading, intermarket analysis, and identifying divergences.
Correlation HeatMap Matrix Data TradingFinder is a Pine Script v6 library that calculates and returns raw correlation matrix data between up to 20 symbols. It only provides the data – it does not draw or render the heatmap – making it ideal for use in other scripts that handle visualization or further analysis. The library uses ta.correlation for fast and accurate calculations.
It also includes two helper functions for visual styling :
CorrelationColor(corr) : takes the correlation value as input and generates a smooth gradient color, ranging from strong negative to strong positive correlation.
CorrelationTextColor(corr) : takes the correlation value as input and returns a text color that ensures optimal contrast over the background color.
Library
"Correlation_HeatMap_Matrix_Data_TradingFinder"
CorrelationColor(corr)
Parameters:
corr (float)
CorrelationTextColor(corr)
Parameters:
corr (float)
Data_Matrix(Corr_Period, Sym_1, Sym_2, Sym_3, Sym_4, Sym_5, Sym_6, Sym_7, Sym_8, Sym_9, Sym_10, Sym_11, Sym_12, Sym_13, Sym_14, Sym_15, Sym_16, Sym_17, Sym_18, Sym_19, Sym_20)
Parameters:
Corr_Period (int)
Sym_1 (string)
Sym_2 (string)
Sym_3 (string)
Sym_4 (string)
Sym_5 (string)
Sym_6 (string)
Sym_7 (string)
Sym_8 (string)
Sym_9 (string)
Sym_10 (string)
Sym_11 (string)
Sym_12 (string)
Sym_13 (string)
Sym_14 (string)
Sym_15 (string)
Sym_16 (string)
Sym_17 (string)
Sym_18 (string)
Sym_19 (string)
Sym_20 (string)
🔵 How to use
Import the library into your Pine Script using the import keyword and its full namespace.
Decide how many symbols you want to include in your correlation matrix (up to 20). Each symbol must be provided as a string, for example FX:EURUSD .
Choose the correlation period (Corr\_Period) in bars. This is the lookback window used for the calculation, such as 20, 50, or 100 bars.
Call Data_Matrix(Corr_Period, Sym_1, ..., Sym_20) with your selected parameters. The function will return an array containing the correlation values for every symbol pair (upper triangle of the matrix plus diagonal).
For example :
var string Sym_1 = '' , var string Sym_2 = '' , var string Sym_3 = '' , var string Sym_4 = '' , var string Sym_5 = '' , var string Sym_6 = '' , var string Sym_7 = '' , var string Sym_8 = '' , var string Sym_9 = '' , var string Sym_10 = ''
var string Sym_11 = '', var string Sym_12 = '', var string Sym_13 = '', var string Sym_14 = '', var string Sym_15 = '', var string Sym_16 = '', var string Sym_17 = '', var string Sym_18 = '', var string Sym_19 = '', var string Sym_20 = ''
switch Market
'Forex' => Sym_1 := 'EURUSD' , Sym_2 := 'GBPUSD' , Sym_3 := 'USDJPY' , Sym_4 := 'USDCHF' , Sym_5 := 'USDCAD' , Sym_6 := 'AUDUSD' , Sym_7 := 'NZDUSD' , Sym_8 := 'EURJPY' , Sym_9 := 'EURGBP' , Sym_10 := 'GBPJPY'
,Sym_11 := 'AUDJPY', Sym_12 := 'EURCHF', Sym_13 := 'EURCAD', Sym_14 := 'GBPCAD', Sym_15 := 'CADJPY', Sym_16 := 'CHFJPY', Sym_17 := 'NZDJPY', Sym_18 := 'AUDNZD', Sym_19 := 'USDSEK' , Sym_20 := 'USDNOK'
'Stock' => Sym_1 := 'NVDA' , Sym_2 := 'AAPL' , Sym_3 := 'GOOGL' , Sym_4 := 'GOOG' , Sym_5 := 'META' , Sym_6 := 'MSFT' , Sym_7 := 'AMZN' , Sym_8 := 'AVGO' , Sym_9 := 'TSLA' , Sym_10 := 'BRK.B'
,Sym_11 := 'UNH' , Sym_12 := 'V' , Sym_13 := 'JPM' , Sym_14 := 'WMT' , Sym_15 := 'LLY' , Sym_16 := 'ORCL', Sym_17 := 'HD' , Sym_18 := 'JNJ' , Sym_19 := 'MA' , Sym_20 := 'COST'
'Crypto' => Sym_1 := 'BTCUSD' , Sym_2 := 'ETHUSD' , Sym_3 := 'BNBUSD' , Sym_4 := 'XRPUSD' , Sym_5 := 'SOLUSD' , Sym_6 := 'ADAUSD' , Sym_7 := 'DOGEUSD' , Sym_8 := 'AVAXUSD' , Sym_9 := 'DOTUSD' , Sym_10 := 'TRXUSD'
,Sym_11 := 'LTCUSD' , Sym_12 := 'LINKUSD', Sym_13 := 'UNIUSD', Sym_14 := 'ATOMUSD', Sym_15 := 'ICPUSD', Sym_16 := 'ARBUSD', Sym_17 := 'APTUSD', Sym_18 := 'FILUSD', Sym_19 := 'OPUSD' , Sym_20 := 'USDT.D'
'Custom' => Sym_1 := Sym_1_C , Sym_2 := Sym_2_C , Sym_3 := Sym_3_C , Sym_4 := Sym_4_C , Sym_5 := Sym_5_C , Sym_6 := Sym_6_C , Sym_7 := Sym_7_C , Sym_8 := Sym_8_C , Sym_9 := Sym_9_C , Sym_10 := Sym_10_C
,Sym_11 := Sym_11_C, Sym_12 := Sym_12_C, Sym_13 := Sym_13_C, Sym_14 := Sym_14_C, Sym_15 := Sym_15_C, Sym_16 := Sym_16_C, Sym_17 := Sym_17_C, Sym_18 := Sym_18_C, Sym_19 := Sym_19_C , Sym_20 := Sym_20_C
= Corr.Data_Matrix(Corr_period, Sym_1 ,Sym_2 ,Sym_3 ,Sym_4 ,Sym_5 ,Sym_6 ,Sym_7 ,Sym_8 ,Sym_9 ,Sym_10,Sym_11,Sym_12,Sym_13,Sym_14,Sym_15,Sym_16,Sym_17,Sym_18,Sym_19,Sym_20)
Loop through or index into this array to retrieve each correlation value for your custom layout or logic.
Pass each correlation value to CorrelationColor() to get the corresponding gradient background color, which reflects the correlation’s strength and direction (negative to positive).
For example :
Corr.CorrelationColor(SYM_3_10)
Pass the same correlation value to CorrelationTextColor() to get the correct text color for readability against that background.
For example :
Corr.CorrelationTextColor(SYM_1_1)
Use these colors in a table or label to render your own heatmap or any other visualization you need.

csv_series_libraryThe CSV Series Library is an innovative tool designed for Pine Script developers to efficiently parse and handle CSV data for series generation. This library seamlessly integrates with TradingView, enabling the storage and manipulation of large CSV datasets across multiple Pine Script libraries. It's optimized for performance and scalability, ensuring smooth operation even with extensive data.
Features:
Multi-library Support: Allows for distribution of large CSV datasets across several libraries, ensuring efficient data management and retrieval.
Dynamic CSV Parsing: Provides robust Python scripts for reading, formatting, and partitioning CSV data, tailored specifically for Pine Script requirements.
Extensive Data Handling: Supports parsing CSV strings into Pine Script-readable series, facilitating complex financial data analysis.
Automated Function Generation: Automatically wraps CSV blocks into distinct Pine Script functions, streamlining the process of integrating CSV data into Pine Script logic.
Usage:
Ideal for traders and developers who require extensive data analysis capabilities within Pine Script, especially when dealing with large datasets that need to be partitioned into manageable blocks. The library includes a set of predefined functions for parsing CSV data into usable series, making it indispensable for advanced trading strategy development.
Example Implementation:
CSV data is transformed into Pine Script series using generated functions.
Multiple CSV blocks can be managed and parsed, allowing for flexible data series creation.
The library includes comprehensive examples demonstrating the conversion of standard CSV files into functional Pine Script code.
To effectively utilize the CSV Series Library in Pine Script, it is imperative to initially generate the correct data format using the accompanying Python program. Here is a detailed explanation of the necessary steps:
1. Preparing the CSV Data:
The Python script provided with the CSV Series Library is designed to handle CSV files that strictly contain no-space, comma-separated single values. It is crucial that your CSV file adheres to this format to ensure compatibility and correctness of the data processing.
2. Using the Python Program to Generate Data:
Once your CSV file is prepared, you need to use the Python program to convert this file into a format that Pine Script can interpret. The Python script performs several key functions:
Reads the CSV file, ensuring that it matches the required format of no-space, comma-separated values.
Formats the data into blocks, where each block is a string of data that does not exceed a specified character limit (default is 4,000 characters). This helps manage large datasets by breaking them down into manageable chunks.
Wraps these blocks into Pine Script functions, each block being encapsulated in its own function to maintain organization and ease of access.
3. Generating and Managing Multiple Libraries:
If the data from your CSV file exceeds the Pine Script or platform limits (e.g., too many characters for a single script), the Python script can split this data into multiple blocks across several files.
4. Creating a Pine Script Library:
After generating the formatted data blocks, you must create a Pine Script library where these blocks are integrated. Each block of data is contained within its function, like my_csv_0(), my_csv_1(), etc. The full_csv() function in Pine Script then dynamically loads and concatenates these blocks to reconstruct the full data series.
5. Exporting the full_csv() Function:
Once your Pine Script library is set up with all the CSV data blocks and the full_csv() function, you export this function from the library. This exported function can then be used in your actual trading projects. It allows Pine Script to access and utilize the entire dataset as if it were a single, continuous series, despite potentially being segmented across multiple library files.
6. Reconstructing the Full Series Using vec :
When your dataset is particularly large, necessitating division into multiple parts, the vec type is instrumental in managing this complexity. Here’s how you can effectively reconstruct and utilize your segmented data:
Definition of vec Type: The vec type in Pine Script is specifically designed to hold a dataset as an array of floats, allowing you to manage chunks of CSV data efficiently.
Creating an Array of vec Instances: Once you have your data split into multiple blocks and each block is wrapped into its own function within Pine Script libraries, you will need to construct an array of vec instances. Each instance corresponds to a segment of your complete dataset.
Using array.from(): To create this array, you utilize the array.from() function in Pine Script. This function takes multiple arguments, each being a vec instance that encapsulates a data block. Here’s a generic example:
vec series_vector = array.from(vec.new(data_block_1), vec.new(data_block_2), ..., vec.new(data_block_n))
In this example, data_block_1, data_block_2, ..., data_block_n represent the different segments of your dataset, each returned from their respective functions like my_csv_0(), my_csv_1(), etc.
Accessing and Utilizing the Data: Once you have your vec array set up, you can access and manipulate the full series through Pine Script functions designed to handle such structures. You can traverse through each vec instance, processing or analyzing the data as required by your trading strategy.
This approach allows Pine Script users to handle very large datasets that exceed single-script limits by segmenting them and then methodically reconstructing the dataset for comprehensive analysis. The vec structure ensures that even with segmentation, the data can be accessed and utilized as if it were contiguous, thus enabling powerful and flexible data manipulation within Pine Script.
Library "csv_series_library"
A library for parsing and handling CSV data to generate series in Pine Script. Generally you will store the csv strings generated from the python code in libraries. It is set up so you can have multiple libraries to store large chunks of data. Just export the full_csv() function for use with this library.
method csv_parse(data)
Namespace types: array
Parameters:
data (array)
method make_series(series_container, start_index)
Namespace types: array
Parameters:
series_container (array)
start_index (int)
Returns: A tuple containing the current value of the series and a boolean indicating if the data is valid.
method make_series(series_vector, start_index)
Namespace types: array
Parameters:
series_vector (array)
start_index (int)
Returns: A tuple containing the current value of the series and a boolean indicating if the data is valid.
vec
A type that holds a dataset as an array of float arrays.
Fields:
data_set (array) : A chunk of csv data. (A float array)
multidataLibrary "multidata"
A library for multi-dimensional data arrays.
Full documentation: faiyaz7283.github.io
This library is designed to enhance data storage capabilities in Pine Script, enabling users to work with two separate data structures: data2d (key -> main-value | alternate-value) and data3d (primary key -> data key-> main-value | alternate-value). These structures facilitate storing key-value pairs in a flexible and efficient manner, offering various methods for manipulation and retrieval of data. Please check out the full documentation at faiyaz7283.github.io .

TooltipLibrary "Tooltip"
This library helps creating and managing nice looking data (key/value) tooltips that you can use for
labels. The tooltips data key/value will align automatically. It is optional to convert the data to a values only string too.
method addSpacesToKey(this)
Calculates the amount of spaces needed after the key to make it the key least 4 characters wide.
Namespace types: Data
Parameters:
this (Data) : (Data) The Data.
method addTabs(this, longestKeyLength)
Calculates the amount of tabs to be used.
Namespace types: Data
Parameters:
this (Data) : (Data) The Data.
longestKeyLength (int)
method longestKeyLength(this)
Returns the length of the longest key string in the array.
Namespace types: Data
Parameters:
this (Data ) : (Tooltip) The object to work with.
@return (int) The length of the key.
method toString(tooltips, withKey)
Helper function for the tooltip.
Namespace types: Data
Parameters:
tooltips (Data )
withKey (bool) : (bool) Wether to create a string with keys in it.
@return (string) The string
new()
Creates a new array to store tooltip data in
@return (Data) The data array.
Data
Key/Value pair for tooltips
Fields:
key (series string)
value (series string)
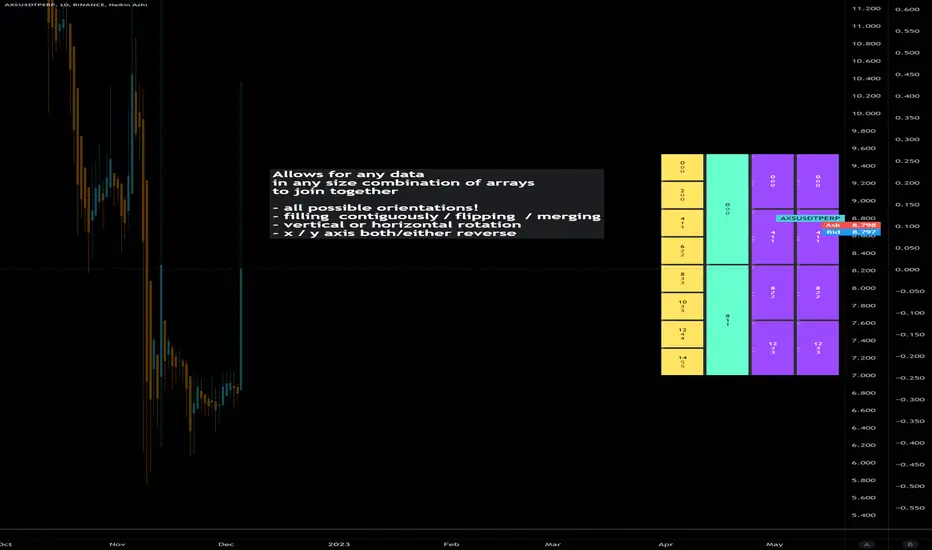
Dynamic Array Table (versatile display methods)Library "datTable"
Dynamic Array Table.... Configurable Shape/Size Table from Arrays
Allows for any data in any size combination of arrays to join together
with:
all possible orientations!
filling all cells contiguously and/or flipping at boundaries
vertical or horizontal rotation
x/y axis direction swapping
all types array inputs for data.
please notify of any bugs. thanks
init(_posit)
Get Table (otional gapping cells)
Parameters:
_posit : String or Int (1-9 3x3 grid L to R)
Returns: Table
coords()
Req'd coords Seperate for VARIP table, non-varip coords
add
Add arrays to display table. coords reset each calc
uses displaytable object, string titles, and color optional array, and second line optional data array.
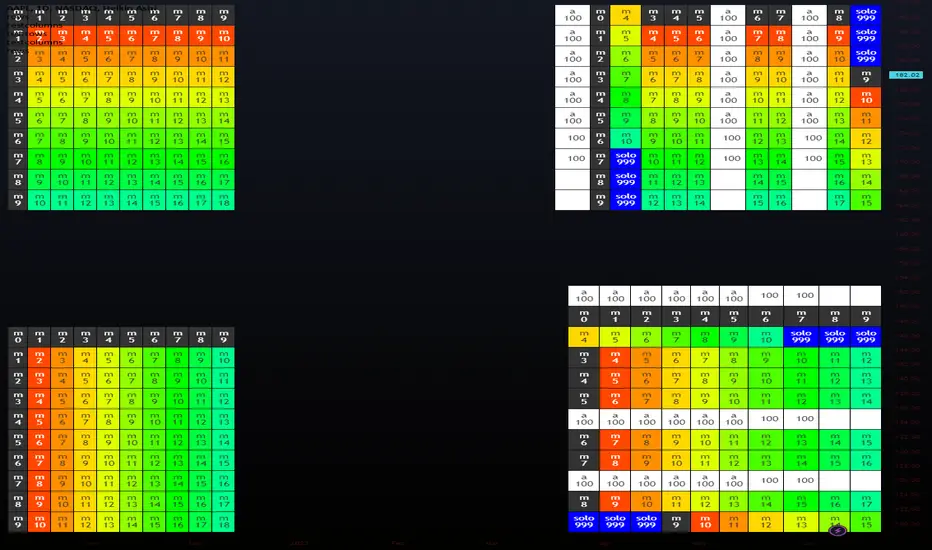
columnsLibrary "columns"
Error Tolerant Matrix Setter/Getter Operations. Easy ways to add/remove items into start and end of Columns as well as arrays to grow and shrink matrix.
if mismatched sizes occur the typified NA value will be there to prevent catastrophic crashing.
Rows and Columns are split into 2 libraries due to limitations on number of exports as well as ease of style (columns.shift(), rows.pop() )
pop(_matrix)
do pop last Column off of matrix
Parameters:
_matrix : Matrix To Edit
Returns: Array of Last Column, removing it from matrix
shift(_matrix)
do shift the first Column off of matrix
Parameters:
_matrix : Matrix To Edit
Returns: Array of First Column, removing it from matrix
get(_matrix, _clmnNum)
retrieve specific Column of matrix
Parameters:
_matrix : Matrix To Edit
_clmnNum : Column being Targeted
Returns: Array of selected Column number, leaving in place
push(_matrix, _clmnNum, _item)
add single item onto end of Column
Parameters:
_matrix : Matrix To Edit
_clmnNum : Column being Targeted
_item : Item to Push on Column
Returns: shifted item from Column start
push(_matrix, _array)
add single item onto end of matrix
Parameters:
_matrix : Matrix To Edit
_array : Array to Push on Matrix
Returns: Void
unshift(_matrix, _clmnNum, _item)
slide single item into start of Column remove last
Parameters:
_matrix : Matrix To Edit
_clmnNum : Column being Targeted
_item : Item to Unshift on Column
Returns: popped item from Column end
unshift(_matrix, _array)
add single item into first Column of matrix
Parameters:
_matrix : Matrix To Edit
_array : Array to unshift into Matrix
Returns: Void
set(_matrix, _clmnNum, _array)
replace an array to an existing Column
Parameters:
_matrix : Matrix To Edit
_clmnNum : Column being Targeted
_array : Array to place in Matrix
Returns: Column that was replaced
insert(_matrix, _clmnNum, _array)
insert an array to a new Column
Parameters:
_matrix : Matrix To Edit
_clmnNum : Column being Targeted
_array : Array to place in Matrix
Returns: void
slideDown(_matrix, _array)
add single item onto end of Column
Parameters:
_matrix : Matrix To Edit
_array : Array to push to Matrix
Returns: shifted first Column
slideUp(_matrix, _array)
add single item onto end of Column
Parameters:
_matrix : Matrix To Edit
_array : Array to unshift to Matrix
Returns: poppeed last Column
pullOut(_matrix, _clmnNum)
add single item onto end of Column
Parameters:
_matrix : Matrix To Edit
_clmnNum : Column being Targeted
Returns: removed selected Column

rowsLibrary "rows"
Error Tolerant Matrix Setter/Getter Operations. Easy ways to add/remove items into start and end of rows as well as arrays to grow and shrink matrix.
if mismatched sizes occur the typified NA value will be there to prevent catastrophic crashing.
columns and rows are split into 2 libraries due to limitations on number of exports as well as ease of style (columns.shift(), rows.pop() )
pop(_matrix)
do pop last row off of matrix
Parameters:
_matrix : Matrix To Edit
Returns: Array of Last row, removing it from matrix
shift(_matrix)
do shift the first row off of matrix
Parameters:
_matrix : Matrix To Edit
Returns: Array of First row, removing it from matrix
get(_matrix, _rowNum)
retrieve specific row of matrix
Parameters:
_matrix : Matrix To Edit
_rowNum : Row being Targeted
Returns: Array of selected row number, leaving in place
push(_matrix, _rowNum, _item)
add single item onto end of row
Parameters:
_matrix : Matrix To Edit
_rowNum : Row being Targeted
_item : Item to Push on Row
Returns: shifted item from row start
push(_matrix, _array)
add single item onto end of matrix
Parameters:
_matrix : Matrix To Edit
_array : Array to Push on Matrix
Returns: Void
unshift(_matrix, _rowNum, _item)
slide single item into start of row remove last
Parameters:
_matrix : Matrix To Edit
_rowNum : Row being Targeted
_item : Item to Unshift on Row
Returns: popped item from row end
unshift(_matrix, _array)
add single item into first row of matrix
Parameters:
_matrix : Matrix To Edit
_array : Array to unshift into Matrix
Returns: Void
set(_matrix, _rowNum, _array)
replace an array to an existing row
Parameters:
_matrix : Matrix To Edit
_rowNum : Row being Targeted
_array : Array to place in Matrix
Returns: row that was replaced
insert(_matrix, _rowNum, _array)
insert an array to a new row
Parameters:
_matrix : Matrix To Edit
_rowNum : Row being Targeted
_array : Array to place in Matrix
Returns: void
slideDown(_matrix, _array)
add single item onto end of row
Parameters:
_matrix : Matrix To Edit
_array : Array to push to Matrix
Returns: shifted first row
slideUp(_matrix, _array)
add single item onto end of row
Parameters:
_matrix : Matrix To Edit
_array : Array to unshift to Matrix
Returns: popped last row
pullOut(_matrix, _rowNum)
add single item onto end of row
Parameters:
_matrix : Matrix To Edit
_rowNum : Row being Targeted
Returns: removed selected row
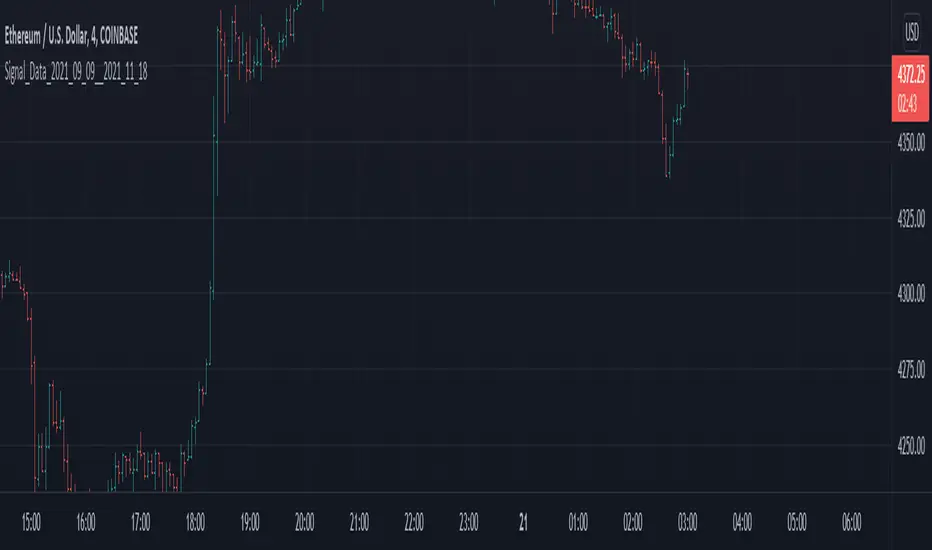
Signal_Data_2021_09_09__2021_11_18Library "Signal_Data_2021_09_09__2021_11_18"
Functions to support my timing signals system
import_start_time(harmonic) get the start time for each harmonic signal
Parameters:
harmonic : is an integer identifying the harmonic
Returns: the starting timestamp of the harmonic data
import_signal(index, harmonic) access point for pre-processed data imported here by copy paste
Parameters:
index : is the current data index, use 0 to initialize
harmonic : is the data set to index, use 0 to initialize
Returns: the data from the indicated harmonic array starting at index, and the starting timestamp of that data
DataCleanerLibrary "DataCleaner"
Functions for acquiring outlier levels and acquiring a cleaned version of a series.
outlierLevel(src, len, level) Gets the (standard deviation) outlier level for a given series.
Parameters:
src : The series to average and add a multiple of the standard deviation to.
len : The The number of bars to measure.
level : The positive or negative multiple of the standard deviation to apply to the average. A positive number will be the upper boundary and a negative number will be the lower boundary.
Returns: The average of the series plus the multiple of the standard deviation.
cleanUsing(src, result, len, maxDeviation) Returns an array representing the result series with (outliers provided by the source) removed.
Parameters:
src : The source series to read from.
result : The result series.
len : The maximum size of the resultant array.
maxDeviation : The positive or negative multiple of the standard deviation to apply to the average. A positive number will be the upper boundary and a negative number will be the lower boundary.
Returns: An array containing the cleaned series.
clean(src, len, maxDeviation) Returns an array representing the source series with outliers removed.
Parameters:
src : The source series to read from.
len : The maximum size of the resultant array.
maxDeviation : The positive or negative multiple of the standard deviation to apply to the average. A positive number will be the upper boundary and a negative number will be the lower boundary.
Returns: An array containing the cleaned series.
outlierLevelAdjusted(src, level, len, maxDeviation) Gets the (standard deviation) outlier level for a given series after a single pass of removing any outliers.
Parameters:
src : The series to average and add a multiple of the standard deviation to.
level : The positive or negative multiple of the standard deviation to apply to the average. A positive number will be the upper boundary and a negative number will be the lower boundary.
len : The The number of bars to measure.
maxDeviation : The optional standard deviation level to use when cleaning the series. The default is the value of the provided level.
Returns: The average of the series plus the multiple of the standard deviation.
