CryptoGraph Entry BuilderA complete system to generate buy & sell signals, based on multiple indicators, timeframes and assets
═════════════════════════════════════════════════════════════════════════
🟣 How it works
This indicator allows you to create buy & sell signals, based on multiple trigger conditions, placed in one easy to use TradingView indicator to produce alerts, backtest, reduce risk and increase profitability. This script is especially designed to be used with the CryptoGraph Strategizer indicator. Signals produced by this indicator, can be used as external input with the CryptoGraph Strategizer, by adding both indicators to your chart and selecting "External Input" as entry source in the inputs of the Strategizer indicator. From that point on, buy & sell signals generated by the Entry Builder, will be used for backtesting.
Each trigger or filtering condition is selectable and able to be combined using the selection boxes.
Trigger or filter conditions can be used on a different timeframes, and with different assets or coin pairs. Make sure to set higher timeframe filters, to a higher timeframe than your chart timeframe.
🟣 How to use
• Add the indicator to your chart
• Select an indicator you woud like to use for entry analysis. Combine more indicators for more entry filtering
• Configure entry conditions per indicator. It is recommended to add and configure one indicator at a time
• Analyse your buy/sell entries
• Connect to CryptoGraph Strategizer as external input source for backtesting purposes
🟣 Indicator Filters
• ATR :
Average True Range (ATR) is a tool used in technical analysis to measure volatility .
Possible options for ATR entry filtering are an ATR value greater/smaller than your input variable for trade entries, or the ATR crossing your input variable for trade entries.
This enables the possibility to only enter positions when the market has a certain degree of volatility .
• ADX :
The Average Directional Index ( ADX ) helps traders determine the strength of a trend, not its actual direction. It can be used to find out whether the
market is ranging or starting a new trend.
Possible options for ADX entry filtering are an ADX value greater/smaller than your input variable for trade entries, or the ADX crossing your input variable for trade entries.
• OBV :
The On Balance Volume indicator (OBV) is used in technical analysis to measure buying and selling pressure. It is a cumulative indicator meaning that on days where price went up, that day's volume is added to the cumulative OBV total.
Possible options for OBV entry filtering are Regular, Hidden or Regular&Hidden divergences. Divergence is when the price of an asset is moving in the opposite direction of a technical indicator, such as an oscillator, or is moving contrary to other data. Divergence warns that the current price trend may be weakening, and in some cases may lead to the price changing direction.
• Moving Average :
Moving Average (MA) is a price based, lagging (or reactive) indicator that displays the average price of a security over a set period of time. A Moving Average is a good way to gauge momentum as well as to confirm trends, and define areas of support and resistance .
Possible options for MA entry filtering are price being above/below Moving Average 1, price crossing up/down Moving Average 1, Moving Average 1 being above/below Moving Average 2 and Moving Average 1 crossing up/down Moving Average 2.
• Supertrend :
Supertrend (ST) is a trend-following indicator based on Average True Range (ATR). The calculation of its single line combines trend detection and volatility . It can be used to detect changes in trend direction and to position stops.
Possible options for ST entry filtering are Supertrend being in upward/downward direction, or Supertrend changing direction.
• RSI :
The Relative Strength Index ( RSI ) is a well versed momentum based oscillator which is used to measure the speed (velocity) as well as the change (magnitude) of directional price movements.
Possible options for RSI entry filtering are RSI being smaller/greater than your input value, or RSI crossing up/down your input value.
• Stochastic RSI :
The Stochastic RSI indicator ( Stoch RSI ) is essentially an indicator of an indicator. It is used in technical analysis to provide a stochastic calculation to the RSI indicator. This means that it is a measure of RSI relative to its own high/low range over a user defined period of time.
Possible options for Stoch RSI entry filtering are Stoch RSI crossing below or above your input value.
• VWAP Bands :
Volume Weighted Average Price ( VWAP ) is a technical analysis tool used to measure the average price weighted by volume . VWAP is typically used with intraday charts as a way to determine the general direction of intraday prices.
We use standard deviations, determined by user input, to create VWAP bands.
Possible options for VWAP long entry filtering are: price being below the lower VWAP band, price crossing back up the lower VWAP band or price crossing down the lower VWAP band.
Possible options for VWAP short entry filtering are: price being above the upper VWAP band, price crossing back down the upper VWAP band, or price crossing up the upper VWAP band.
• Bollinger Bands :
Bollinger Bands (BB) are a widely popular technical analysis instrument created by John Bollinger in the early 1980’s. Bollinger Bands consist of a band of three lines which are plotted in relation to security prices. The line in the middle is usually a Simple Moving Average ( SMA ) set to a period of 20 days (the type of trend line and period can be changed by the trader; however a 20 day moving average is by far the most popular).
Possible options for BB long entry filtering are: price being below the lower Bollinger band , price crossing back up the lower Bollinger band or price crossing down the lower Bollinger band .
Possible options for BB short entry filtering are: price being above the upper Bollinger band , price crossing back down the upper Bollinger band , or price crossing up the upper Bollinger band .
• WaveTrend :
WaveTrend (WT) is a smoothed momentum oscillator which enables it to detect true reversals in an accurate manner.
Possible options for WT entry filtering are: Green/red dots below or above a certain WaveTrend value, Regular Divergence, Hidden Divergence and Regular&Hidden Divergence.
Dca-bots

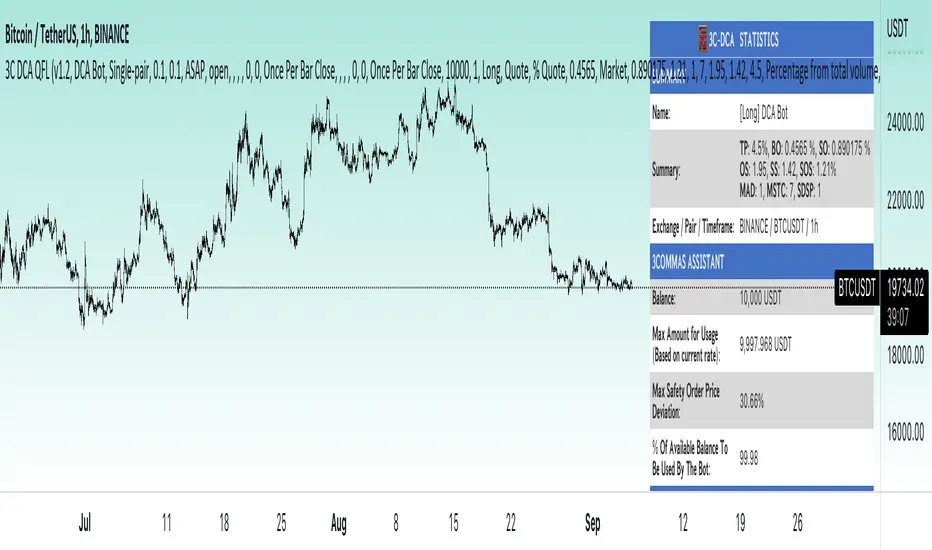
3Commas dollar cost averaging (DCA) QFL IndicatorAs investors, we often face the dilemma of willing high stock prices when we sell, but not when we buy. There are times when this dilemma causes investors to wait for a dip in prices, thereby potentially missing out on a continual rise. This is how investors get lured away from the markets and become tangled in the slippery slope of market timing, which is not advisable to a long-term investment strategy.
Skyrex developed a complex indicator based on dollar-cost averaging in Quick Fingers Luc's interpretation. It is a combinations of strategies which allows to systematically accumulate assets by investing scaled amounts of money at defined market cycle global support levels. Dollar-cost averaging can reduce the overall impact of price volatility and lower the average cost per asset thus even during market slumps only a small bounce is required to reach take profit.
The indicator script monitors a chart price action and identifies bases as they form. When bases are reached the script provides entry alerts. During price action development an asset value can go lower and in this way the script will perform safety entries alerts at each subsequent accumulation levels. When weighted average entry price reaches target profit the script will perform a take profit action alert.
Bases are identified as pivot lows in a fractal pattern and validated by an adjustable decrease/rise percentage to ensure significancy of identified bases. To qualify a pivot low, the indicator will perform the following validation:
Validate the price rate of change on drops and bounces is above a given threshold amount.
Validate the volume at the low pivot point is above the volume moving average (using a given length).
Validate the volume amount is a given factor of magnitude above is above the volume moving average.
Validate the potential new base is not too close to the previous range by using a given price percent difference threshold amount.
A fractal pattern is a recurring pattern on a price chart that can predict reversals among larger, more chaotic price movements. These basic fractals are composed of five or more bars. The rules for identifying fractals are as follows:
A bearish turning point occurs when there is a pattern with the highest high in the middle and two lower highs on each side.
A bullish turning point occurs when there is a pattern with the lowest low in the middle and two higher lows on each side.
Basic dollar-cost averaging approach is enhances by implementation of adjustable accumulation levels in order to provide opportunity of setting them at defined global support levels and Martingale volume coefficient to increase averaging effect. According to Quick Fingers Luc's principles trading principles we added volume validation of a base because it allows to confirm that the market is resistant to further price decrease.
The indicator supports traditional and cryptocurrency spot, futures , options and marginal trading exchanges. It works accurately with BTC , USD, USDT, ETH and BNB quote currencies. Best to use with 1H timeframe charts and limit orders. The indicator can be and should be configured for each particular asset according to its global support and resistance levels and price action cycles. You can modify levels and risk management settings to receive better performance
The difference between core script and this interpretation is that this strategy is specially designed for 3Commas bots
How to use?
1. Apply indicator to a trading pair your are interested in using 1H timeframe chart
2. Configure the indicator: change layer values, order size multiple and take profit/stop loss values according to current market cycle stage
3. Set up a TradingView custom alert using the indicator settings to trigger on a condition you are interested in
4. The indicator will send alerts when to enter and when to exit positions which can be applied to your portfolio using external trading platforms
5. Update settings once market conditions are changed using backtests on a monthly period
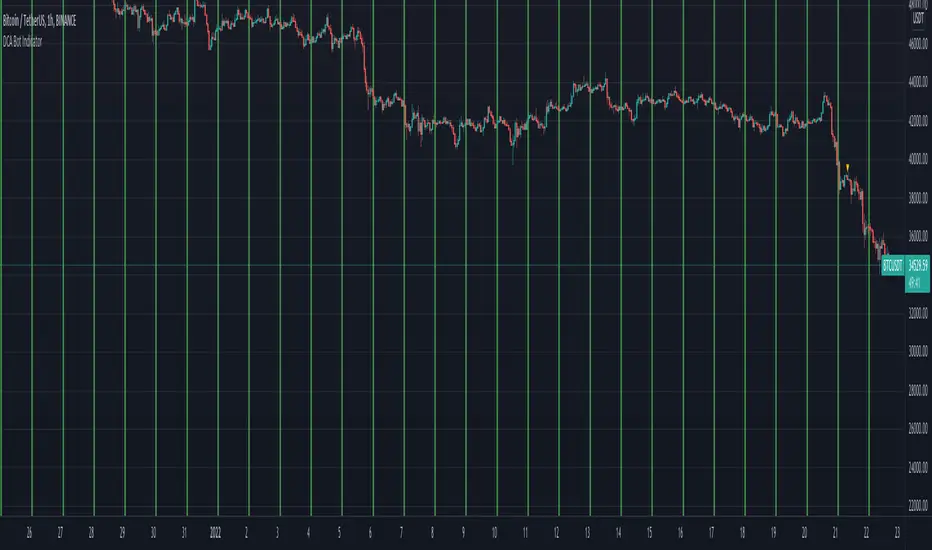
DCA Bot IndicatorName: DCA Bot Indicator
Category: Dollar Cost Average.
Operating mode: Alerts at a specific time, day of the week and day of the month.
Trades duration: N/A.
Timeframe: 1H
Suggested usage: long-term investing DCA strategies.
Entry: Only indicates the time and then the day of the week or the day of the month to buy.
Exit: As per long-term Investor’s strategy.
Usage: If you want to perform a Dollar Cost Averaging approach with:
- Daily purchases (at a specific time)
- Weekly purchases (at a specific time and day of the week)
- Monthly purchases (at a specific time and day of the month)
It is then possible to set the alert text with a preferred message or for use with trade automation systems. The green background identify the specific time chosen.
It is possible to identify through the Bias Analyzer the best time for the daily purchase.
Configuration:
- Buy Time: hour you would like to buy, please consider that the script is executed at the end of the defined time, so if you would like to buy at 2, have to put 1.
- Buy only Days of the Week: you can select the day you want.
- Buy only on Day of Month, you can specify a specific day.
Credits:
- dsteaves for inspiration
DCA RSI Add funds exit simulatorThis script helps with planning on how to exit DCA deals that are in the negative.
The following deal information is required
- Current average position price
- Funds invested
- Required take profit
Additional indicator settings are
- The date/time on which to start the simulator
- Minimum deviation % to start adding funds
- Expected bounceback from when funds are added
The RSI trigger
Adding funds is triggered when the selected RSI settings yield a value that is at or beyond the selected threshold.
How it works
The amount of funds needed are calculated based on the supplied settings, such that the new average price matches the expected bounceback.
It will also show if the exit strategy has failed to hit the TP (this happens when the RSI threshold is hit again)

QaSH DCA AlgorithmQaSH DCA Algorithm implements a DCA strategy that takes advantage of price volatility by buying dips to average down, and adjusting price targets as the break-even price gets lower.
How does the DCA strategy work?
When the specified entry condition has occurred, the indicator will set up several limit orders below the current price. If price goes up a specified amount, then the layers will be overwritten at the higher prices. If price goes down and fills the first layer (limit order), then the Take Profit price is plotted and will be sent in an alert. If more layers are filled, then the TP price will move down accordingly as it’s based on the average entry price (alerts on each TP update). This action of lowering the average entry and TP price mitigates your risk, and increases the likelihood of a Take Profit event happening. More entry conditions will be added as time goes on, although complex entry conditions are not necessary for the strategy to work. All the meat of the DCA strategy is in the layer placement, order volume , and TP %.
How does this differ from other DCA bots?
1) The layer placements, order volume , and “take profit %” for each layer or “safety order” is much more customizable than what you get from other services. For example, I can choose to have my TP% change, depending on how big the price dip was. Maybe on safety order 1 I want 10% TP, but on safety order 7 might want a 2% TP.
2) Settings optimization. You can take advantage of the replay feature and see how trades would have played out, and how much PnL you would have made (strategy version is coming soon)
3) You can use this indicator on more than just crypto. You can easily set up alerts for manual trades on stocks, or you can integrate it with your stock broker API of choice and automate your trades.
4) When combining this with an automation service, you will get unmatched execution speed by running it on your dedicated machine.
5) I can offer a lifetime subscription to the indicator upon request.
What kind of market is it best used on?
QaSH DCA Algorithm is best used on cryptocurrencies and stocks, and it is best used on assets that are volatile. That means large swings up and down. Also I recommend running this on many uncorrelated assets at the same time.
What settings should I use?
The default settings are decent for most markets, and provide a good balance between profit potential and downside protection, although you can use a wide variety of settings. In a strong bull market its best to either bring up your layers to catch smaller dips, or you can go big on the first few layers (maybe 4 layers, 25% on each layer for example). In a sideways or brearish market you'll want more downside protection, so you'll want the larger orders to be at lower prices.
What should I do if price goes below my last layer?
The best solution is to keep a cash reserve on the side at all times. If price looks like it has reached a low point below your lowest layer, then manually buy more to average down further. This action will help it along and get you in the green sooner.
Disclaimer: In order to get a large position in an asset, you need to have most of your layers fill. That means you have to be comfortable with buying more as the price goes down, patiently waiting for the bounce that occurs afterward. This is the working principle of Dollar Cost Averaging, and it's a proven method for most markets.

Alert for 3Commas Bollinger StrategyThis is just an alert for the 3Commas Bollinger Strategy written by tedwardd
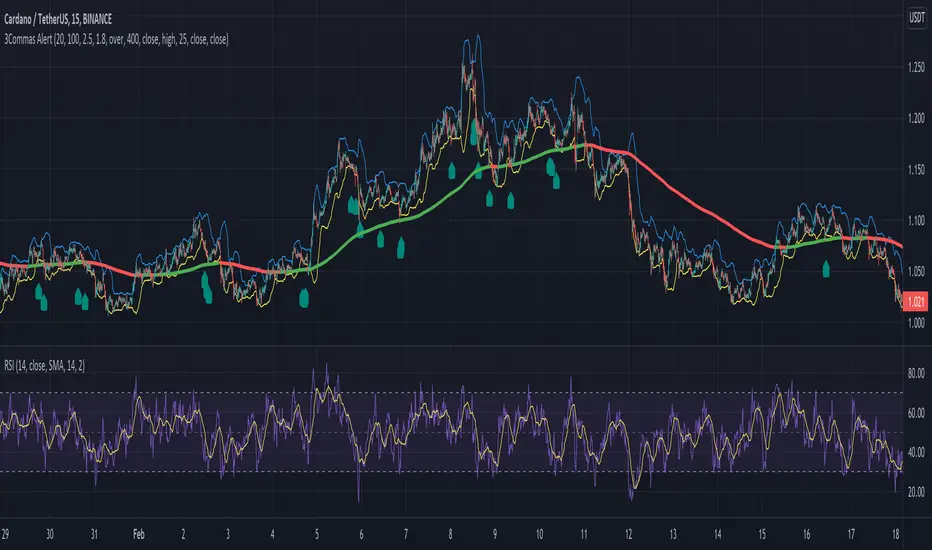
Bollinger Bands + RSI Alerts for 3commas/DCA botHey Folks !
This is in indicator that generates buy alerts combining Bollinger Bands and RSI.
RSI validates the BB signal by confirming we are not in an oversold area.
Interval: 3m to 15m
Recommended settings for 3commas DCA bot
- TP/TTP: 0.3%/0.1%,
- Base Order: Your choice ,
- Safety Order: 1.2 * Your choice of base order
- Safety Order Volume Scale: 1.2,
- Safety Order Step Scale: 1.5,
- Price Deviation to Open Safety Order (% from initial order): 0.25%,
- Max Safety Trades Count: 7
- DO NOT USE STOP LOSS
> Create Alert with Buy Alert and link it to "Message for deal start signal"
