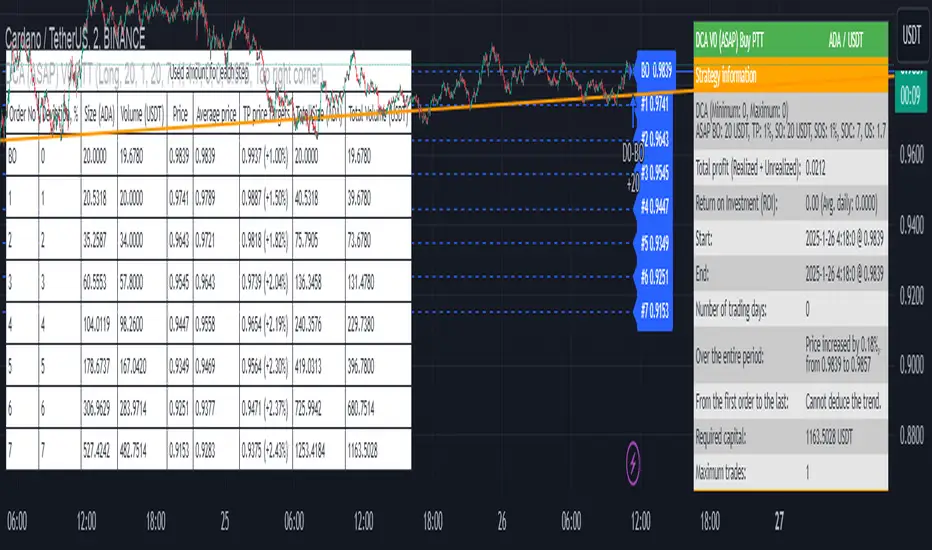
DCA (ASAP) V0 PTTScript Name: DCA (ASAP) V0 PTT
Detailed Description:
This script implements the Dollar-Cost Averaging (DCA) strategy, allowing you to automatically manage buy/sell orders safely and efficiently. Below are the key features of this script:
1. Purpose and Operation:
o Supports both Long and Short trading modes.
o Designed to optimize profitability using the DCA method, where Safety Orders are triggered when the price moves against the predicted direction.
o Helps users maintain their Target Profit in various market conditions.
2. Main Features:
o Automatic Order Placement: The initial Base Order is opened as soon as no active order exists.
o Safety Order Management: Safety Orders are automatically placed when the price moves against the initial order. The volume and distance of these orders are customizable.
o Order Closing: Orders are closed upon reaching the Target Profit, accounting for transaction fees.
o Detailed Information Display: Displays open orders, trading statistics, and performance metrics directly on the chart.
3. Customizable Parameters:
o Base Order Size: The size of the initial order.
o Target Profit (%): Target profit as a percentage of the total order volume.
o Safety Order Size: The size of each Safety Order.
o Price Deviation (%): The percentage distance between consecutive Safety Orders.
o Safety Order Volume Scale: The scaling factor for increasing the volume of subsequent Safety Orders.
o Max Safety Orders: The maximum number of Safety Orders allowed per deal.
4. Unique Features:
o Backtest Range Support: Enables you to limit backtesting to a specific time range of interest.
o Comprehensive Statistics: Displays detailed tables including open trades, pending orders, ROI, trading days, and realized profit.
o Integrated Trading Fees: Includes transaction fees in profit calculations for precise results.
5. Usage Instructions:
o Select the trading mode (Long or Short) from the "Strategy" input.
o Customize parameters such as Base Order, Safety Order, and Target Profit according to your requirements and the asset being traded.
o Monitor the performance of the strategy through the displayed information tables.
Notes:
• This script does not disclose detailed calculation logic but provides an overview of the concepts and usage.
• Designed for trading on exchanges that support margin or spot trading.
Dca-bots
DCA Buy v1Key Features
1. Selective Entry Filters
Trend Filter
Enabled through "Enable Trend Filter?" using the "EMA Length" setting to ensure entries align with prevailing trends.
Momentum Filter
Configured using "Enable Momentum Filter?" combined with "RSI Length" and "RSI Source" to detect oversold conditions.
Bollinger Filter
Activated via "Enable Bollinger Filter?" along with "BB Length" and "BB Multiplier" to focus entries on deeper price dips below Bollinger Bands.
2. DCA Configuration
Base Order Settings
Choose between a percentage ("Base Order % of Equity/Initial Capital") or fixed value ("Base Order Value ($)").
Safety Order Settings
Fine-tune "Initial Deviation (%)" and "Price Deviation Multiplier" to control the spacing of safety orders.
Use "Volume Scaling Factor (Qty)" to scale the size of each subsequent safety order.
Customize the "First Safety Order Type" as either value-based or a multiplier of the base order using "1st Safety Order Value ($)" or "1st Safety Order Multiplier (Qty)".
Set the maximum number of safety orders through "Max Safety Orders".
3. Profit and Risk Management
Take Profit Settings
"Take Profit (%)" triggers a sell when a specific profit percentage above the average entry is reached.
Use "Trailing Take Profit (%)" to lock in profits while capturing additional upside if prices continue to rise.
Stop Loss Settings
Configure "Stop Loss (%)" to prevent excessive drawdowns by closing all positions when prices drop below a defined percentage.
4. Time Control & Visualization
Time Filters
Define trading windows with "Start Time" and "End Time".
Use "Cooldown (Seconds)" to avoid frequent entries during rapid price movements.
Visualization
Enable "Show Average Entry Price", "Show Take Profit Level", and "Show Stop Loss Level" to plot key levels on the chart for better monitoring.
5. Performance Metrics
Built-in performance tracking includes:
Net Profit (%): Measures overall profitability.
Win Rate (%): Displays the ratio of winning trades.
Max Drawdown (%): Tracks the largest equity decline.
Trading Days: Calculates the duration of active trades.
Profit/Day (%): Evaluates daily returns.
The performance table also shows average cycle duration and utilization of available capital.

Martingale + Grid DCA Strategy [YinYangAlgorithms]This Strategy focuses on strategically Martingaling when the price has dropped X% from your current Dollar Cost Average (DCA). When it does Martingale, it will create a Purchase Grid around this location to likewise attempt to get you a better DCA. Likewise following the Martingale strategy, it will sell when your Profit has hit your target of X%.
Martingale may be an effective way to lower your DCA. This is due to the fact that if your initial purchase; or in our case, initial Grid, all went through and the price kept going down afterwards, that you may purchase more to help lower your DCA even more. By doing so, you may bring your DCA down and effectively may make it easier and quicker to reach your target profit %.
Grid trading may be an effective way of reducing risk and lowering your DCA as you are spreading your purchases out over multiple different locations. Likewise we offer the ability to ‘Stack Grids’. What this means, is that if a single bar was to go through 20 grids, the purchase amount would be 20x what each grid is valued at. This may help get you a lower DCA as rather than creating 20 purchase orders at each grid location, we create a single purchase order at the lowest grid location, but for 20x the amount.
By combining both Martingale and Grid DCA techniques we attempt to lower your DCA strategically until you have reached your target profit %.
Before we start, we just want to make it known that first off, this Strategy features 8% Commission Fees, you may change this in the Settings to better reflect the Commission Fees of your exchange. On a similar note, due to Commission Fees being one of the number one profit killers in fast swing trade strategies, this strategy doesn’t focus on low trades, but the ideology of it may result in low amounts of trades. Please keep in mind this is not a bad thing. Since it has the ability to ‘Stack Grid Purchases’ it may purchase more for less and result in more profit, less commission fees, and likewise less # of trades.
Tutorial:
In this example above, we have it set so we Martingale twice, and we use 100 grids between the upper and lower level of each martingale; for a total of 200 Grids. This strategy will take total capital (initial capital + net profit) and divide it by the amount of grids. This will result in the $ amount purchased per grid. For instance, say you started with $10,000 and you’ve made $2000 from this Strategy so far, your total capital is $12,000. If you likewise are implementing 200 grids within your Strategy, this will result in $12,000 / 200 = $60 per grid. However, please note, that the further down the grid / martingale is, the more volume it is able to purchase for $60.
The white line within the Strategy represents your DCA. As the Strategy makes purchases, this will continue to get lower as will your Target Profit price (Blue Line). When the Close goes above your Target Profit price, the Strategy will close all open positions and claim the profit. This profit is then reinvested back into the Strategy, which may exponentially help the Strategy become more profitable the longer it runs for.
In the example above, we’ve zoomed in on the first example. In this we want to focus on how the Strategy got back into the trades shortly after it sold. Currently within the Settings we have it set so our entry is when the Lowest with a length of 3 is less than the previous Lowest with a length of 3. This is 100% customizable and there are multiple different entry options you can choose from and customize such as:
EMA 7 Crossover EMA 21
EMA 7 Crossunder EMA 21
RSI 14 Crossover RSI MA 14
RSI 14 Crossunder RSI MA 14
MFI 14 Crossover MFI MA 14
MFI 14 Crossunder MFI MA 14
Lowest of X Length < Previous Lowest of X Length
Highest of X Length > Previous Highest of X Length
All of these entry options may be tailored to be checked for on a different Time Frame than the one you are currently using the Strategy on. For instance, you may be running the Strategy on the 15 minute Time Frame yet decide you want the RSI to cross over the RSI MA on the 1 Day to be a valid entry location.
Please keep in mind, this Strategy focuses on DCA, this means you may not want the initial purchase to be the best location. You may want to buy when others think it is a good time to sell. This is because there may be strong bearish momentum which drives the price down drastically and potentially getting you a good DCA before it corrects back up.
We will continue to add more Entry options as time goes on, and if you have any in mind please don’t hesitate to let us know.
Now, back to the example above, if we refer to the Yellow circle, you may see that the Lowest of a length of 3 was less than its previous lowest, this triggered the martingales to create their grids. Only a few bars later, the price went into the first grid and went a little lower than its midpoint (Yellow line). This caused about 60% of the first grid to be purchased. Shortly after the price went even lower into this grid and caused the entire first martingale grid to be purchased. However, if you notice, the white line (your DCA) is lower than the midpoint of the first grid. This is due to the fact that we have ‘Stack Grid Purchases’ enabled. This allows the Strategy to purchase more when a single bar crosses through multiple grid locations; and effectively may lower your average more than if it simply executed a purchase order at each grid.
Still looking at the same location within our next example, if we simply increase the Martingale amount from 2 to 3 we can see something strange happens. What happened is our Target Profit price was reached, then our entry condition was met, which caused all of the martingale grids to be formed; however, the price continued to increase afterwards. This may not be a good thing, sure the price could correct back down to these grid locations, but what if it didn’t and it just kept increasing? This would result in this Strategy being stuck and unable to make any trades. For this reason we have implemented a Failsafe in the Settings called ‘Reset Grids if no purchase happens after X bars’.
We have enabled our Failsafe ‘Reset Grids if no purchase happens after X bars’ in this example above. By default it is set to 100 bars, but you can change this to whatever works best for you. If you set it to 0, this Failsafe will be disabled and act like the example prior where it is possible to be stuck with no trades executing.
This Failsafe may be an important way to ensure the Strategy is able to make purchases, however it may also mean the Grids increase in price when it is used, and if a massive correction were to occur afterwards, you may lose out on potential profit.
This Strategy was designed with WebHooks in mind. WebHooks allow you to send signals from the Strategy to your exchange. Simply set up a Custom TradingView Bot within the OKX exchange or 3Commas platform (which has your exchange API), enter the data required from the bot into the settings here, select your bot type in ‘Webhook Alert Type’, and then set up the alert. After that you’re good to go and this Strategy will fully automate all of its trades within your exchange for you. You need to format the Alert a certain way for it to work, which we will go over in the next example.
Add an alert for this Strategy and simply modify the alert message so all it says is:
{{strategy.order.alert_message}}
Likewise change from the Alert ‘Settings’ to Alert ‘Notifications’ at the top of the alert popup. Within the Notifications we will enable ‘Webhook URL’ and then we will pass the URL we are sending the Webhook to. In this example we’ve put OKX exchange Webhook URL, however if you are using 3Commas you’ll need to change this to theirs.
OKX Webhook URL:
www.okx.com
3Commas Webhook URL:
app.3commas.io
Make sure you click ‘Create’ to actually create this alert. After that you’re all set! There are many Tutorials videos you can watch if you are still a little confused as to how Webhook trading works.
Due to the nature of this Strategy and how it is designed to work, it has the ability to never sell unless there it will make profit. However, because of this it also may be stuck waiting in trades for quite a long period of time (usually a few months); especially when your Target Profit % is 15% like in the example above. However, this example above may be a good indication that it may maintain profitability for a long period of time; considering this ‘Deep Backtest’ is from 2017-8-17.
We will conclude the tutorial here. Hopefully you understand how this Strategy has the potential to make calculated and strategic DCA Grid purchases for you and then based on a traditional Martingale fashion, bulk sell at the desired Target Profit Percent.
Settings:
Purchase Settings:
Only Purchase if its lower than DCA: Generally speaking, we want to lower our Average, and therefore it makes sense to only buy when the close is lower than our current DCA and a Purchase Condition is met.
Purchase Condition: When creating the initial buy location you must remember, you want to Buy when others are Fearful and Sell when others are Greedy. Therefore, many of the Buy conditions involve times many would likewise Sell. This is one of the bonuses to using a Strategy like this as it will attempt to get you a good entry location at times people are selling.
Lower / Upper Change Length: This Lower / Upper Length is only used if the Purchase Condition is set to 'Lower Changed' or 'Upper Changed'. This is when the Lowest or Highest of this length changes. Lowest would become lower or Highest would become higher.
Purchase Resolution: Purchase Resolution is the Time Frame that the Purchase Condition is calculated on. For instance, you may only want to start a new Purchase Order when the RSI Crosses RSI MA on the 1 Day, but yet you run this Strategy on the 15 minutes.
Sell Settings:
Trailing Take Profit: Trailing Take Profit is where once your Target Profit Percent has been hit, this will trail up to attempt to claim even more profit.
Target Profit Percent: What is your Target Profit Percent? The Strategy will close all positions when the close price is greater than your DCA * this Target Profit Percent.
Grid Settings:
Stack Grid Purchases: If a close goes through multiple Buy Grids in one bar, should we amplify its purchase amount based on how many grids it went through?
Reset Grids if no purchase happens after X Bars: Set this to 0 if you never want to reset. This is very useful in case the price is very bullish and continues to increase after our Target Profit location is hit. What may happen is, Target Profit location is hit, then the Entry condition is met but the price just keeps increasing afterwards. We may not want to be sitting waiting for the price to drop, which may never happen. This is more of a failsafe if anything. You may set it very large, like 500+ if you only want to use it in extreme situations.
Grid % Less than Initial Purchase Price: How big should our Buy Grid be? For instance if we bought at 0.25 and this value is set to 20%, that means our Buy Grid spans from 0.2 - 0.25.
Grid Amounts: How many Grids should we create within our Buy location?
Martingale Settings:
Amount of Times 'Planned' to Martingale: The more Grids + the More Martingales = the less $ spent per grid, however the less risk. Remember it may be better to be right and take your time than risk too much and be stuck too long.
Martingale Percent: When the current price is this percent less than our DCA, lets create another Buy Grid so we can lower our average more. This will make our profit location less.
Webhook Alerts:
Webhook Alert Type: How should we format this Alert? 3Commas and OKX take their alerts differently, so please select the proper one or your webhooks won't work.
3Commas Webhook Alerts:
3Commas Bot ID: The 3Commas Bot ID is needed so we know which BOT ID we are sending this webhook too.
3Commas Email Token: The 3Commas Email Token is needed for your webhooks to work properly as it is linked to your account.
OKX Webhook Alerts:
OKX Signal Token: This Signal Token is attached to your OKX bot and will be used to access it within OKX.
If you have any questions, comments, ideas or concerns please don't hesitate to contact us.
HAPPY TRADING!

DCA EMA Simple Bot [Starbots]
This is a simple idea of DCA trading on EMA crosses. Strategy is not repainting.
The difference between this and any other strategy is, that this script allows you to preset DCA buy triggers at desired levels and customize each DCA order size independently. Alerts are working, this strategy is easily used for automatic trading.
I mainly trade on Cryptohopper, Pionex, 3commas. This was created for community, alerts are working and non-repainting. Should work on any other as well.
Trading Condition:
It's buying when Fast EMA crosses up Slow EMA. Set your paramters.
It's selling if EMA's crosses back, signaling a sell. Optional.
DCA:
You can enter DCA on 20 custom levels or layers. It buys DCA when price hits the plotted blue line on the chart that's set by input % triggers. (buy 1st DCA at 2% drop, buy 2nd DCA at 5% drop,...)
Set your Inital Capital and Pyramiding in Properties tab, Initial Order Size and DCA Order Size (lot1,lot2,lot3,..), Order Type are changed in strategy inputs.
-By default you can see that we buy when EMA's cross up and signal a buy for 10% of equity, if market is dropping you will then place a first DCA order ( 20% equity) at 2% drop (lower) from initial order. If market keeps dropping you have more DCA levels where you can buy and average down your holding position. For selling you can use Take profit and Stop Loss targets that averages down multiple open positions, it will sell it once it reaches your desirable Take Profit and close a deal. You can also close your trade if EMA signals a sell.
Pyramiding - number of orders you can open at a time
Your first buy order is pyramiding 1. To allow it to buy 1 DCA or merge one time, set pyramding to 2.
Want to DCA 10 times? Set pyramiding at 11. (+1 always)
More features:
- Profit Calendar
- Show Balance label before every new trade
- DCA table - visualize how much of your investment is used in trades. If a background of the table is green you are okay, if the background color is red - you are using more money for orders than you actually have.
Buy Orders << Strategy Equity/Capital
- Show / Hide DCA lines - if your chart processing is getting slow you should hide some DCA levels to speed it up
- Backtesting Range - for testing the strategy in different time windows
- Alerts
When all trades are closed on your chart, winning rate of the strategy is 100% actually.
Win rate is shown differently as it's actually closing and opening every trade individually by default in TradingView system. We merge positions together and average it down into one big position to later sell for a profit (DCA).
You use this Trading Algorithm at your own risk. Do not trade before testing or invest something you cannot afford to lose on markets.

CryptoGraph StrategizerA complete system to backtest and automate comprehensive trading strategies
═════════════════════════════════════════════════════════════════════════
🟣 How it works
This indicator allows you to use buy & sell signals from external CryptoGraph indicators, and fully backtest these signals in the TradingView strategy tester. After configuring buy & sell signals, the trader can look into exit criteria with this indicator. The indicator offers percentage based an ATR based take profit/stop losses, as well as safety orders (DCA) in order to get a better average entry price.
Once your strategy is fully set up to your desired results, it's possible to set up alerts and connect the indicator through an automation platform ( API connection), to your broker. Alertatron & Wick Hunter auto configuration is included, meaning everything configured in the indicator settings, will automatically be carried out with Alertatron & Wick Hunter syntaxes.
🟣 Features
• Multiple methods of scaling in entries (Multiple DCA/Pyramiding methods). There will be an option to scale up or down your volume per order and distance between orders.
• Multiple methods of determining order sizes. Methods are percentage risk per trade, dollar risk per trade, position size in contracts, position size in percentage and position size in dollar.
• Multiple methods and levels of taking profits and losses. Both percentage based and ATR based take profit and stop loss.
• Option to use external indicator buy/sell signals for entry.
• Visualised liquidation prices in TradingView (both cross and isolated)
• Information panel on chart with additional information regarding your strategy results
• Bot setup directly from indicator inputs tab with Wick Hunter & Alertatron
🟣 How to use
• Choose a symbol that corresponds to your bot pair and exchange
• Pick a chart time frame
• Always use the regular candle type
• Configure your deal start condition
• Configure your profit target
• Use the Take Profit/Stop Loss feature to set a target for profit and loss
• Configure your safety orders
• Check your backtest parameters
•Make sure that the initial capital and order size make sense. Since you can use pyramiding in your strategy with safety orders, the sum of all deals should not be bigger than the initial capital

DCA Average Arbitrage - The Quant ScienceDCA Average Arbitrage - The Quant Science™ is a quantitative algorithm based on a DCA model that uses averaging to create a statistical arbitrage system.
DESCRIPTION
The algorithm can be set long or short.
1. Long algorithm: opens long positions with 100% of the capital every time the price deviates negatively for a certain percentage distance from the average.
2. Short algorithm: opens short positions with 100% of capital every time the price deviates positively for a certain percentage distance from the average.
The closing of positions depends on the parameters activated by the user. The user can set the closing on the reverse condition and/or add functions such as stop loss, take profit and closing after a certain bar period.
USER INTERFACE SETTING
The user chooses the long or short direction and sets the parameters for average as length, source and percent distance.
AUTO TRADING COMPLIANT
With the user interface, the trader can easily set up this algorithm for automatic trading. Automating it is very simple, activate the alert functions and enter the links generated by your broker.
BACKTESTING INCLUDED
With the user interface, the trader can adjust the backtesting period of the strategy before putting it live. You can analyze large periods such as years or months or focus on short-term periods.
NO LIMIT TIMEFRAME
This algorithm can be used on all timeframes and is ideal for lower timeframes.
GENERAL FEATURES
Multi-strategy: the algorithm can apply either the long strategy or the short strategy.
Built-in alerts: the algorithm contains alerts that can be customized from the user interface.
Integrated indicator: the quantity indicator is included.
Backtesting included: automatic backtesting of the strategy is generated based on the values set.
Auto-trading compliant: functions for auto trading are included.
ABOUT THE BACKTEST
Backtesting refers to the period 1 January 2022 - today, ticker: ICP/USDT, timeframe 5 minutes.
Initial capital: $1000.00
Commission per trade: 0.03%

3C QFL Mean reversalWhat is QFL trading strategy?
QFL stands for Quickfingersluc, and sometimes it is referred to as the Base Strategy or Mean Reversals. Its main idea is about identifying the moment of panic selling and buying below the base level and utilizing Safety orders.
What is Base level or Support Level?
Base level or Support Level refers to the lowest price level that was reached before the moment the price started increasing again. At that level, you can notice that buyers of some cryptocurrencies make a strong reaction.
In this strategy we can also reverse the strategy and go short. But i must warn you that that is alot riskier.
QFL is meant to be used on higher TF's like 1hr, 2hr and 4hr. But this strategy also work well on lower Timeframes.
The script also simulates DCA strategy with parameters used in 3commas DCA bots for futures trading.
Experiment with parameters to find your trading setup.
Beware how large your total leveraged position is and how far can market go before you get liquidated!
Do that with the help of futures liquidation calculators you can find online!
Included:
An internal average price and profit calculating, instead of TV`s native one, which is subject to severe slippage.
A graphic interface, so levels are clearly visible and back-test analyzing made easier.
Long & Short direction of the strategy.
Table display a summary of past trades
Vertical colored lines appear when the new maximum deviation from the original price has
been reached
All the trading happens with total account capital, and all order sizes inputs are expressed in percent.

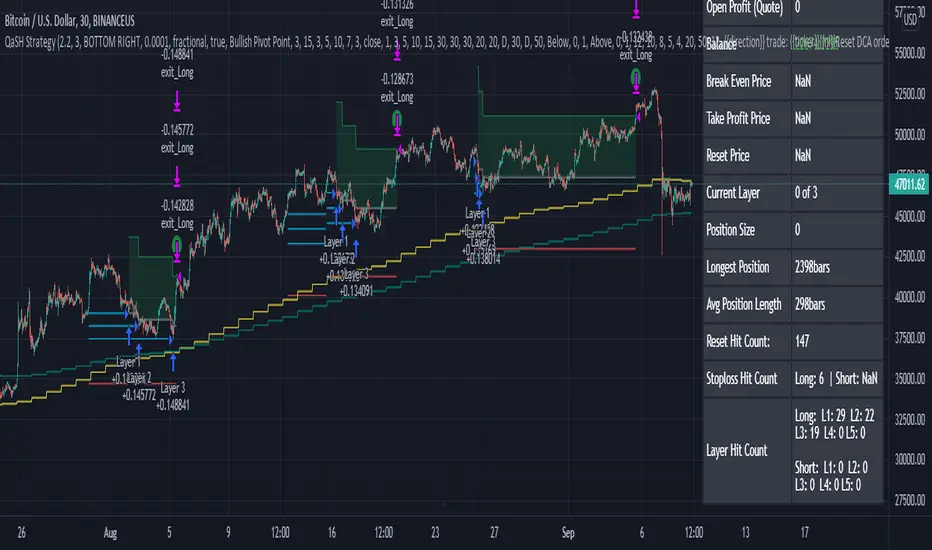
QaSH DCA StrategyThis is a backtesting script that demonstrates the power of incorporating dollar cost averaging into your trading strategies. Catch the bottom of those lightning fast dips buy placing your limit orders ahead of time.
Four entry conditions have been included:
- ASAP mode
- Quickfinger's Luc
- Bullish pivot point
- Bearish pivot point
An EMA-based entry condition filter is included
Placement of all DCA orders is adjustable, and "take profit" % is also variable and can depend on the size of the price dip.
Cava Signals Backtesting/VisualizerPLEASE READ THE DESCRIPTION CAREFULLY
Trying this again, as it seems I keep violating the rules unintentionally. Moderator, please forgive me as I try to make this right.
This backtesting/visualizer script was created for me to get a visual idea of the Cava Signals indicator throughout its development time and continuous optimization.
This script is to be used on the 30-minute timeframe on supported markets, and whether I can only publish strategies on regular candles, the indicator is meant to trigger on heikin ashi candles.I understand backtesting on non-regular candles produces unrealistic results, but I emphasize that this script is more for visualization purposes rather than accurate $ amounts from the trades. The signals are used along with a dedicated bot configuration, so part of the strategy is not managed by the script, but by the bot's config.
Some behind the scenes on what we are looking at:
a combination of ema and sma crosses on different time frames (5m, 15m, 30m, 60m and 90m) - we call this the wave trend
a combination of stochastic rsi on different time frames (10m, 30m)
a combination of schaff trend cycles on different time frames (5m, 20m and 30m)
a combination of money flow index on different time frames (10m and 30m)
volume information for each supported market/pair
and a couple of other info particular to each pair
With the above combination of data points, we try to optimize our strategy for an entry, for dca'ing down in case the coin goes down as well as dca'ing up to maximize profit when a coin is going up, take profit levels when we recognize a good time to do so, and of course, a closing level. I would like to emphasize the *visualization* purpose of this script in recognizing lows, highs, and market structure to identify the important levels to signal - this script is NOT to be used for accurate backtesting, but for an idea of the overall performance of when signals are triggered.
Let me try to explain the workflow and icons you see on the chart:
The colored circles on the bottom of the chart are all buy signals; each color corresponds to a particular buy signal, we have a combination of 9 possible situations that would trigger a buy signal. Some would trigger a buy signal only in combination with other buy signals or other indicators within the script. we also display a green upwards arrow below bars when a buy signal is triggered.
The colored arrows pointing down on the top of the chart are close signals. We have a combination of 5 closing criteria each color corresponds to one, just like the buy signals do. We only close a trade in profit. If not in profit, we will look to DCA down.
DCA signals are shown by the green flag above bars. they are signals to DCA up or down depending on the trade being negative or positive. DCA'ing up or down is also managed by the bot's configuration for limits on when to accept the signal.
Take Profit levels are shown by the green diamond above bars and work in conjunction with the bot's config on when to take the signal if at all and other take profit levels. Usually, when we hit the first take profit level we move our stop loss to entry via the bot's take profit safety feature. You can see this call with the close entry named TPS .
The black bars you may see on the chart is to illustrate when the market is extended based on a particular strategy. During this period we will not trigger a buy signal unless there is a huge spike in positive volume .
The green number below the bars is the total positive delta volume on the buy candles.
On the table on the right upper corner, we show some information on the market and performance of the backtesting - for visualization purposes only!
Currently, the script is tailored to work with the following markets/pairs:
Binance Spot: ADA, ALGO, ATOM, AVAX, BNB, BTC , DOT, ETH, LINK, LUNA, MATIC, SOL, VET, XRP, XTZ
Binance Futures: BTC , ETH, ADA, ALGO, ATOM, BNB, COMP, DOT, ENJ , LINK, OCEAN, OMG, SOL, VET, XMR, XRP, XTZ, AVAX, AAVE, DOGE, LTC, LUNA, MKR , NEAR, ONT, RUNE, SUSHI, LTC, XLM , COMP, ONT, THETA, FTM , EGLD , WAVES, ONE, HTN , CHZ , HOT, MANA, CRV , RVN, BAT, ANKR, 1INCH, ALICE, ATA , AXS , CHR , COTI, NKN , RAY, REN, SRM , SXP , TLM
ByBit Inverse Perpetual: BTCUSD , ETHUSD
ByBit Futures: AAVE, ADA, ALGO, AVAX, AXS , BNB, BTC , DOT, ETH, LINK, LTC, MATIC, SOL, SUSHI, UNI , XEM, XRP, XTZ
The chosen pairs are subject to change based on the best-performing assets we are constantly analyzing.
I hope this helps to understand the script, its purpose and ideas. I hope this satisfies the community rules - it was not my intention to break them - if there's anything on the above or the script that still violates the guidelines, please let me know and accept my apologies in advance.
If anyone would like to know more, let me know in the comment section.
Thank you!

DCA Bot Long/Short Thanks to @TheTradingParrot for the inspiration and knowledge shared.
Thanks to @ericlin0122 for the original DCA Bot Emulator which is the backbone of this strategy.
The script simulates DCA strategy with parameters used in 3commas DCA bots for futures trading. Experiment with parameters
to find your trading setup.
Beware how large your total leveraged position is and how far can market go before you get liquidated!
Do that with the help of futures liquidation calculators you can find online!
I`ve added:
1) an internal average price and profit calculating, instead of TV`s native one, which is subject to severe slippage.
2) I`ve built a graphic interface, so levels are clearly visible and back-test analyzing made easier.
3) now both Long & Short direction of the strategy exist.
4) trailing TP which was featured in the initial script has been removed because TV`s execution model makes
it impossible to know how the real world trailing would have unfolded.
5) the table is self explanatory, and it is there to help you discover what happened and where.
6) vertical colored lines appear when the new maximum deviation from the original price has
been reached
All the trading happens with total account capital, and all order sizes inputs are expressed in percent.
Known issues:
When deviation is small, and the same candle triggers safety AND the close order, the initial orders are closed, but a
new one opens on the next candle. This is "resolved" by closing the unwanted trade forcefully on the next candle, affecting
profit calculating minimally and guaranteeing that what should be closed has been closed.
The code could be improved through use of arrays, making the table flexible so the number of rows should be dynamic depending
on the number of SOs.
!!!!! IMPORTANT!!!!!
This strategy script is made to receive a signal from an exterior study script, which should plot +100 for long or -100 for short
entry (that is by default - values can be changed in the strategy settings menu). That plot should be found in "Enter Trigger" input
dropdown menu at the bottom of strategy settings menu. Removing the "and trigger == long/short_trigger" condition from strategy entry
conditions makes the strategy open trades ASAP.
Cheers!

Crypto Strategy for Bearish Markets (Binance, FTX, Futures...)BINANCE:BTCUSDTPERP
Even in months like May '21 you can win by going long on Bitcoin. This strategy proves it and is not overwhelmed by Elon's ...
The backtest was carried out during the month of May of this year and, as you can see, all the long operations opened during the fall were successful.
So if we are going to continue to have a bear market for some time, why not take advantage of it while we remain bulls?
This strategy uses Dollar-Cost-Average (DCA) to average the entry price. Thanks to this, it is able to close profitable trades even in times of great volatility and bearish pressure.
It includes alerts that can be configured that will be sent every time the conditions to operate are met. These alerts can also be linked with 3commas for a fully automatic operation.
For Leverage Futures or Margin traders, all you have to do is divide the initial capital by the leverage used.
Enjoy!

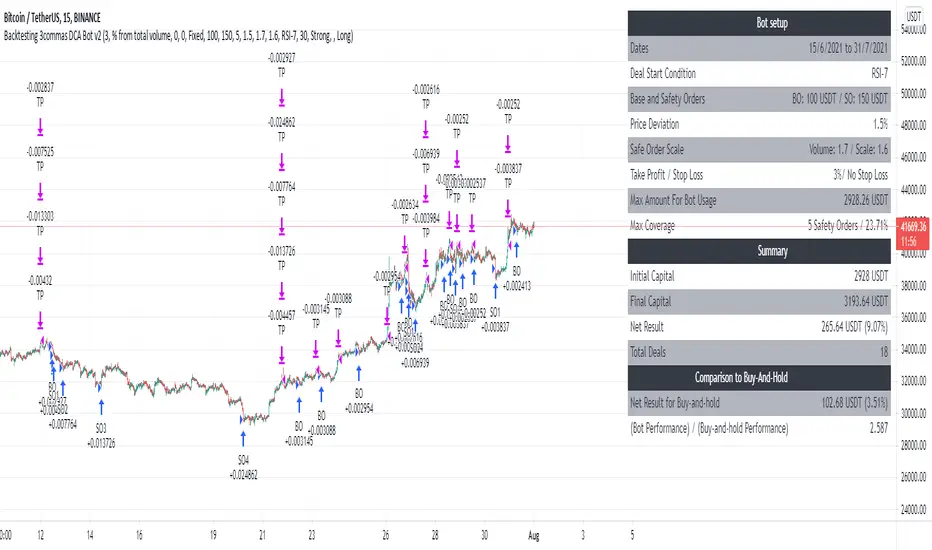
Backtesting 3commas DCA Bot v2Updating previously published simulated 3commas DCA logic with a sexier insert and more meaningful default parameters.