Dema Vstop | viResearchTitle: Dema Vstop | viResearch
Conceptual Foundation and Innovation
The "Dema Vstop" indicator combines the Double Exponential Moving Average (DEMA) with the Volatility Stop (Vstop) concept to improve trend-following and trend-reversal signals. This script provides a more responsive and dynamic approach to identifying trends and capturing market movements by integrating these two powerful tools. It is particularly effective for traders who seek a balance between smoothing out price action and quickly adapting to volatile changes in the market.
The DEMA smooths the price action more effectively than a traditional moving average, while the Vstop introduces a volatility-adjusted stop-loss mechanism, allowing traders to adapt to the market's changing conditions. The result is a robust system that captures both trend direction and potential reversal points with improved precision.
Technical Composition and Calculation
At the core of the "Dema Vstop" script are two primary components:
Double Exponential Moving Average (DEMA): This is used to smooth the source price over a user-defined period (dema_len), making it ideal for trend identification.
Volatility Stop (Vstop): The Vstop mechanism uses the Average True Range (ATR) to adjust stop-loss levels based on market volatility, allowing the indicator to account for changes in market conditions.
Key Calculations:
DEMA Calculation: Based on the selected length and source, the DEMA smooths the price data.
Vstop Calculation: The ATR (with customizable length) is used to adjust the stop distance, and the Vstop level is calculated based on whether the price is trending up or down.
Features and User Inputs
The "Dema Vstop" script offers a high degree of customization:
DEMA Length and Source: Control the smoothness of the DEMA and the price data being smoothed.
Vstop Length: Customize the length of the ATR calculation to control how reactive the Vstop is to price volatility.
Multiplier: Adjust the sensitivity of the Vstop to market volatility. A higher multiplier results in a wider stop, while a lower multiplier tightens the stop, making it more sensitive to price changes.
Practical Applications
The "Dema Vstop" is designed for traders looking for a hybrid trend-following system that is both smooth and responsive. It can be particularly useful for:
Identifying Trends: The combination of DEMA and Vstop makes trend-following easier, helping traders stay in profitable positions longer.
Volatility Protection: The Vstop dynamically adjusts based on market volatility, providing a built-in risk management tool that reduces exposure to volatile markets.
Reversals and Entries: The Vstop helps identify potential reversals by flipping its stop level when the trend direction changes, making it effective for signaling entries and exits with improved accuracy.
Advantages and Strategic Value
The key advantage of the "Dema Vstop" script lies in its ability to offer smoother trend detection through the DEMA while dynamically adapting to volatility using the Vstop. This combination reduces false signals, providing traders with a more stable and reliable tool for trend trading. Additionally, the customizable parameters allow traders to fine-tune the indicator to suit different trading styles and market conditions.
Alerts and Visual Cues
The script comes with built-in alert conditions that trigger when a trend shift is detected:
- Dema Vstop Long: Signals a potential upward trend.
- Dema Vstop Short: Signals a potential downward trend.
These alerts ensure that traders can stay informed about critical market changes without constantly monitoring the chart.
Summary and Usage Tips
The "Dema Vstop | viResearch" script is an innovative trend-following tool that combines the smoothness of DEMA with the adaptive qualities of Vstop. By offering a customizable and dynamic system, this indicator helps traders navigate the complexities of volatile markets while reducing noise and false signals. Incorporating this script into your trading strategy can improve trend analysis and increase the accuracy of entries and exits.
Note: Backtests are based on past results and are not indicative of future performance.
Double Exponential Moving Average (DEMA)

Dema Supertrend | viResearchDema Supertrend | viResearch
Conceptual Foundation and Innovation
The "Dema Supertrend" indicator by viResearch combines the benefits of the Double Exponential Moving Average (DEMA) with the popular Supertrend method to provide an advanced tool for trend detection and volatility management. By integrating DEMA into the Supertrend calculation, the indicator reduces lag while enhancing responsiveness to market changes. This results in more accurate trend identification and a refined method for capturing directional movements.
Technical Composition and Calculation
The "Dema Supertrend" builds on the core principles of the Supertrend indicator by incorporating DEMA for smoother and more responsive trend detection. The key innovation lies in replacing the raw price data with the DEMA-smoothed values, allowing traders to identify trends with reduced noise and enhanced precision.
DEMA and ATR-Based Supertrend Calculation:
DEMA Calculation (demalen): The Double Exponential Moving Average is applied to the price data (hlc3 by default) over a user-defined length, providing a smoothed representation of the market trend. DEMA minimizes lag compared to simple or exponential moving averages, allowing for more timely trend identification.
Supertrend Bands (u, l): The Supertrend upper and lower bands are calculated by adding or subtracting a multiple of the Average True Range (ATR) from the DEMA value. These bands dynamically adjust to market volatility, acting as support and resistance levels to guide trading decisions.
Trend Logic (L, S): The script determines whether the price is above or below the bands to signal an uptrend (L) or downtrend (S). Crosses above or below these bands trigger visual alerts and trend changes, with alerts built in for potential long or short positions.
Trend Continuation and Reversal:
The indicator ensures that once a trend is identified, it persists until clear reversal criteria are met. This is achieved through a comparison of the current and previous values of the Supertrend bands, reducing the occurrence of false signals in volatile markets.
Features and User Inputs
The "Dema Supertrend" script offers a range of customizable options, allowing traders to tailor the indicator to different market conditions and trading strategies:
Supertrend Length: The length of the Supertrend period can be adjusted, allowing traders to control the sensitivity of the trend detection.
Multiplier: The ATR multiplier adjusts the distance between the DEMA and the Supertrend bands. A higher multiplier reduces the frequency of trend changes, while a lower multiplier increases sensitivity to price movements.
DEMA Length: The length of the DEMA calculation can be customized to smooth price data over different timeframes, helping traders capture long-term trends or short-term movements more effectively.
Practical Applications
The "Dema Supertrend" is an ideal tool for traders who seek to follow trends while minimizing the impact of market noise. Its combination of DEMA and Supertrend provides a clear, dynamic view of the market's direction, making it especially effective in volatile environments.
Key Uses:
- Trend Following: The Dema Supertrend helps traders align their positions with the prevailing market trend by providing clear signals for uptrends and downtrends based on DEMA-smoothened price action.
- Volatility Management: The integration of ATR ensures that the Supertrend bands adapt to changes in market volatility, allowing traders to avoid entering trades during choppy, unpredictable price movements.
- Signal Confirmation: The script includes visual and alert-based signals for trend continuation and reversal, enabling traders to confirm entries and exits with greater accuracy.
Advantages and Strategic Value
The "Dema Supertrend" offers several strategic advantages:
- Reduced Lag: By integrating DEMA into the Supertrend calculation, the indicator responds more quickly to price changes, reducing the lag inherent in traditional moving averages.
- Noise Reduction: The use of DEMA filters out short-term fluctuations, providing a clearer signal for traders looking to capture significant market trends.
- Dynamic Adjustments: The combination of ATR and DEMA allows the indicator to adapt to both trending and ranging markets, making it suitable for a variety of trading strategies.
Summary and Usage Tips
The "Dema Supertrend" is a powerful tool for trend-following traders, offering a precise and adaptive method for identifying and confirming market direction. Traders can experiment with different settings for the Supertrend and DEMA lengths, as well as the ATR multiplier, to optimize the indicator for various trading environments. For best results, use the "Dema Supertrend" in conjunction with other technical analysis tools to confirm trends and manage risk. Whether you're seeking to capture long-term market moves or react to short-term volatility, the "Dema Supertrend" provides a reliable and flexible solution for your trading strategy.

Inverted SD Dema RSI | viResearchInverted SD Dema RSI | viResearch
The "Inverted SD Dema RSI" developed by viResearch introduces a new approach to trend analysis by combining the Double Exponential Moving Average (DEMA), Standard Deviation (SD), and Relative Strength Index (RSI). This unique indicator provides traders with a tool to capture market trends by integrating volatility-based thresholds. By using the smoothed DEMA along with standard deviation, the indicator offers improved responsiveness to price fluctuations, while RSI thresholds offer insight into overbought and oversold market conditions.
At the core of the "Inverted SD Dema RSI" is the combination of DEMA and standard deviation for a more nuanced view of market volatility. The use of RSI further aids in detecting price extremes and potential trend reversals.
DEMA Calculation (sublen): The Double Exponential Moving Average (DEMA) smoothes out price data over a user-defined period, reducing lag compared to traditional moving averages. This provides a clearer representation of the market's overall direction.
Standard Deviation Calculation (sublen_2): The standard deviation of the DEMA is used to define the upper (u) and lower (d) bands, highlighting areas where price volatility may signal a change in trend. These dynamic bands help traders gauge price volatility and potential breakouts or breakdowns.
RSI Calculation (len): The script applies the Relative Strength Index (RSI) to the smoothed DEMA values, allowing traders to detect momentum shifts based on a modified data set. This provides a more accurate reflection of market strength when combined with the DEMA.
Thresholds: The RSI is compared to user-defined thresholds (70 for overbought and 55 for oversold conditions). These thresholds help in identifying potential market reversals, especially when the price breaks outside of the calculated standard deviation bands.
Uptrend (L): An uptrend signal is generated when the RSI exceeds the upper threshold (70) and the price is not above the upper standard deviation band, indicating that there may be room for further price appreciation.
Downtrend (S): A downtrend signal occurs when the RSI falls below the lower threshold (55), indicating that the price may continue to decline.
The "Inverted SD Dema RSI" offers a wide range of customizable settings, allowing traders to adjust the indicator based on their trading style or market conditions.
DEMA Length (sublen): Controls the period used to smooth the price data, impacting the sensitivity of the DEMA to recent price movements.
Standard Deviation Length (sublen_2): Defines the length over which the standard deviation is calculated, helping traders control the width of the upper and lower bands.
RSI Length (len): Adjusts the period used for the RSI calculation, providing flexibility in determining overbought and oversold conditions.
RSI Thresholds: Traders can define their own levels for detecting trend reversals, with default values of 70 for an uptrend and 55 for a downtrend.
The "Inverted SD Dema RSI" is particularly well-suited for traders looking to capture trends while accounting for volatility and momentum. By using a smoothed DEMA as the foundation, it effectively filters out noise, making it ideal for detecting reliable trends in volatile markets.
Key Uses:
Trend Following: The indicator’s combination of DEMA, standard deviation, and RSI helps traders follow trends more effectively by reducing noise and identifying key momentum shifts.
Volatility Filtering: The use of standard deviation bands provides a dynamic measure of volatility, ensuring that traders are aware of potential breakouts or breakdowns in the market.
Momentum Detection: The inclusion of RSI ensures that the indicator is not only focused on trend direction but also on the strength of the underlying momentum, helping traders avoid entering trades during weak trends.
The "Inverted SD Dema RSI" provides several key advantages over traditional trend-following indicators:
Reduced Lag: The use of DEMA ensures faster trend detection, reducing the lag associated with simple moving averages.
Noise Reduction: The integration of standard deviation helps filter out irrelevant price movements, making it easier to identify significant trends.
Momentum Awareness: The addition of RSI provides valuable insight into the strength of trends, helping traders avoid false signals during periods of weak momentum.
The "Inverted SD Dema RSI" offers a powerful blend of trend-following and momentum detection, making it a versatile tool for modern traders. By integrating DEMA, standard deviation, and RSI, the indicator provides a comprehensive view of market trends and volatility. Traders are encouraged to experiment with different settings for the DEMA length, standard deviation, and RSI thresholds to fine-tune the indicator for their specific trading strategies. Whether used for trend confirmation, volatility assessment, or momentum analysis, the "Inverted SD Dema RSI" offers a valuable tool for traders seeking a comprehensive approach to market analysis.

Median Standard Deviation | viResearchMedian Standard Deviation | viResearch
The "Median Standard Deviation" indicator, developed by viResearch, introduces a unique combination of median smoothing and standard deviation to detect trends and volatility in market data. This tool provides traders with a stable and accurate measure of price trends by integrating median smoothing with a customized calculation of the standard deviation. This innovative approach allows for enhanced sensitivity to market fluctuations while filtering out short-term price noise.
Technical Composition and Calculation:
The "Median Standard Deviation" indicator incorporates median smoothing and dynamic standard deviation calculations to build upon traditional volatility measures.
Median Smoothing:
DEMA Calculation (len_dema): The script applies a Double Exponential Moving Average (DEMA) to smooth the price data over a user-defined period, reducing noise and helping traders focus on broader market trends.
Median Calculation (median_len): The smoothed DEMA data is further refined by calculating the 50th percentile (median) over a specified length, ensuring that the central tendency of price data is captured more accurately than with a simple moving average.
Volatility Measurement:
ATR Calculation (atr_len, atr_mul): The script incorporates the Average True Range (ATR) to measure market volatility. The user-defined ATR multiplier is applied to this value to calculate upper and lower trend bands around the median, providing a dynamic measure of potential price movement based on recent volatility.
Standard Deviation Analysis:
Standard Deviation Calculation (len_sd): The script calculates the standard deviation of the median over a user-defined length, providing another layer of volatility measurement. The upper and lower standard deviation bands (sdd, sdl) act as additional indicators of price extremes.
Trend Detection:
Trend Logic: The indicator uses the calculated bands to identify whether the price is moving within or outside the standard deviation and ATR bands. Crosses above or below these bands are used to signal potential uptrends or downtrends, offering traders a clear view of market direction.
Features and User Inputs:
The "Median Standard Deviation" script offers a variety of user inputs to customize the indicator to suit traders' styles and market conditions:
DEMA Length: Allows traders to adjust the sensitivity of the DEMA smoothing to control the amount of noise filtered from the price data.
Median Length: Users can define the length over which the median price is calculated, providing flexibility in capturing short-term or long-term trends.
ATR Length and Multiplier: These inputs let traders fine-tune the ATR calculation, affecting the size of the dynamic upper and lower bands.
Standard Deviation Length: Controls how the standard deviation is calculated, allowing for further customization in detecting price volatility.
Practical Applications:
The "Median Standard Deviation" indicator is particularly effective in volatile markets where price swings can lead to false signals using traditional methods. By combining median smoothing and standard deviation, this tool provides a more robust analysis of trends and price movements.
Key Uses:
Trend Following: The upper and lower bands provide clear signals for entering and exiting trades based on whether the price is moving outside the calculated ranges.
Volatility Detection: The integration of ATR and standard deviation bands allows traders to assess market volatility in real time, enabling more informed trading decisions.
Noise Reduction: The use of median smoothing ensures that short-term price fluctuations do not interfere with broader trend analysis, making this indicator ideal for traders looking to avoid whipsaws in volatile markets.
Advantages and Strategic Value:
The "Median Standard Deviation" indicator offers several key advantages:
Precision in Trend Detection: The combination of median smoothing and standard deviation allows traders to detect trends with greater accuracy, reducing the risk of false signals.
Customization: With several adjustable parameters, traders can fine-tune the indicator to suit different timeframes and trading strategies.
Volatility Sensitivity: By incorporating ATR and standard deviation, this indicator provides an adaptive measure of market volatility, ensuring that traders are always aware of potential price swings.
Summary and Usage Tips:
The "Median Standard Deviation" indicator is a powerful tool for traders looking to refine their analysis of market trends and volatility. Its combination of median smoothing and standard deviation provides a nuanced view of market movements, helping traders make better-informed decisions. It's recommended to experiment with the various input parameters to optimize the indicator for specific needs, whether used for trend detection, volatility analysis, or noise reduction. The "Median Standard Deviation" offers a reliable and adaptable solution for modern trading strategies.
Please keep in mind the following text: Backtests are based on past results and are not indicative of future performance.

Simplified MA Crossover indicatorThis is my first script, it is really simple logic and you probably saw something similar before. Is a crossover indicator between 2 Moving Average, one fast MA and the second slow MA.
Inputs you can adjust:
- 8 different source of MA's
- lenght of the MA's
- 7 different types of MA's ("EMA", "SMA", "RMA", "WMA", "DEMA", "TEMA", "HMA")
- 3 smoothing level of the fast MA
- plotting fast MA into the chart
- plotting crossover triangle shapes
I really enjoed the creation of this simple concept indicator, maybe not the fastest because of his nature but I liked work on it. I am sure is a good base to improve, study and try new idea.
Uptrick: MultiMA_VolumePurpose:
The "Uptrick: MultiMA_Volume" indicator, identified by its abbreviated title 'MMAV,' is meticulously designed to provide traders with a comprehensive view of market dynamics by incorporating multiple moving averages (MAs) and volume analysis. With adjustable inputs and customizable visibility options, traders can tailor the indicator to their specific trading preferences and strategies, thereby enhancing its utility and usability.
Explanation:
Input Variables and Customization:
Traders have the flexibility to adjust various parameters, including the lengths of different moving averages (SMA, EMA, WMA, HMA, and KAMA), as well as the option to show or hide each moving average and volume-related components.
Customization options empower traders to fine-tune the indicator according to their trading styles and market preferences, enhancing its adaptability across different market conditions.
Moving Averages and Trend Identification:
The script computes multiple types of moving averages, including Simple (SMA), Exponential (EMA), Weighted (WMA), Hull (HMA), and Kaufman's Adaptive (KAMA), allowing traders to assess trend directionality and strength from various perspectives.
Traders can determine potential price movements by observing the relationship between the current price and the plotted moving averages. For example, prices above the moving averages may suggest bullish sentiment, while prices below could indicate bearish sentiment.
Volume Analysis:
Volume analysis is integrated into the indicator, enabling traders to evaluate volume dynamics alongside trend analysis.
Traders can identify significant volume spikes using a customizable threshold, with bars exceeding the threshold highlighted to signify potential shifts in market activity and liquidity.
Determining Potential Price Movements:
By analyzing the relationship between price and the plotted moving averages, traders can infer potential price movements.
Bullish biases may be suggested when prices are above the moving averages, accompanied by rising volume, while bearish biases may be indicated when prices are below the moving averages, with declining volume reinforcing the potential for downward price movements.
Utility and Potential Usage:
The "Uptrick: MultiMA_Volume" indicator serves as a comprehensive tool for traders, offering insights into trend directionality, strength, and volume dynamics.
Traders can utilize the indicator to identify potential trading opportunities, confirm trend signals, and manage risk effectively.
By consolidating multiple indicators into a single chart, the indicator streamlines the analytical process, providing traders with a concise overview of market conditions and facilitating informed decision-making.
Through its customizable features and comprehensive analysis, the "Uptrick: MultiMA_Volume" indicator equips traders with actionable insights into market trends and volume dynamics. By integrating trend analysis and volume assessment into their trading strategies, traders can navigate the markets with confidence and precision, thereby enhancing their trading outcomes.

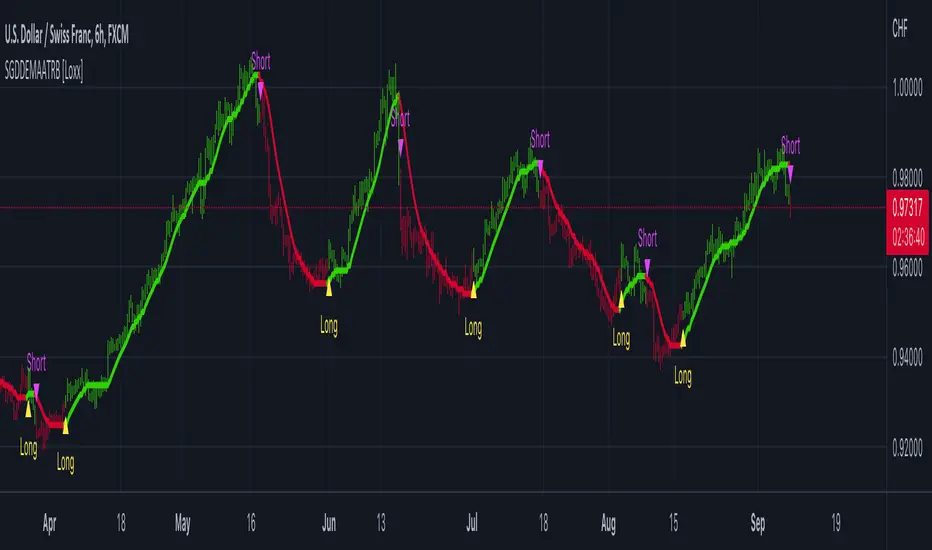
Volatility Adjusted Weighted DEMA [BackQuant]Volatility Adjusted Weighted DEMA
The Volatility Adjusted Weighted Double Exponential Moving Average (VAWDEMA) by BackQuant is a sophisticated technical analysis tool designed for traders seeking to integrate volatility into their moving average calculations. This innovative indicator adjusts the weighting of the Double Exponential Moving Average (DEMA) according to recent volatility levels, offering a more dynamic and responsive measure of market trends.
Primarily, the single Moving average is very noisy, but can be used in the context of strategy development, where as the crossover, is best used in the context of defining a trading zone/ macro uptrend on higher timeframes.
Why Volatility Adjustment is Beneficial
Volatility is a fundamental aspect of financial markets, reflecting the intensity of price changes. A volatility adjustment in moving averages is beneficial because it allows the indicator to adapt more quickly during periods of high volatility, providing signals that are more aligned with the current market conditions. This makes the VAWDEMA a versatile tool for identifying trend strength and potential reversal points in more volatile markets.
Understanding DEMA and Its Advantages
DEMA is an indicator that aims to reduce the lag associated with traditional moving averages by applying a double smoothing process. The primary benefit of DEMA is its sensitivity and quicker response to price changes, making it an excellent tool for trend following and momentum trading. Incorporating DEMA into your analysis can help capture trends earlier than with simple moving averages.
The Power of Combining Volatility Adjustment with DEMA
By adjusting the weight of the DEMA based on volatility, the VAWDEMA becomes a powerful hybrid indicator. This combination leverages the quick responsiveness of DEMA while dynamically adjusting its sensitivity based on current market volatility. This results in a moving average that is both swift and adaptive, capable of providing more relevant signals for entering and exiting trades.
Core Logic Behind VAWDEMA
The core logic of the VAWDEMA involves calculating the DEMA for a specified period and then adjusting its weighting based on a volatility measure, such as the average true range (ATR) or standard deviation of price changes. This results in a weighted DEMA that reflects both the direction and the volatility of the market, offering insights into potential trend continuations or reversals.
Utilizing the Crossover in a Trading System
The VAWDEMA crossover occurs when two VAWDEMAs of different lengths cross, signaling potential bullish or bearish market conditions. In a trading system, a crossover can be used as a trigger for entry or exit points:
Bullish Signal: When a shorter-period VAWDEMA crosses above a longer-period VAWDEMA, it may indicate an uptrend, suggesting a potential entry point for a long position.
Bearish Signal: Conversely, when a shorter-period VAWDEMA crosses below a longer-period VAWDEMA, it might signal a downtrend, indicating a possible exit point or a short entry.
Incorporating VAWDEMA crossovers into a trading strategy can enhance decision-making by providing timely and adaptive signals that account for both trend direction and market volatility. Traders should combine these signals with other forms of analysis and risk management techniques to develop a well-rounded trading strategy.
Alert Conditions For Trading
alertcondition(vwdema>vwdema , title="VWDEMA Long", message="VWDEMA Long - {{ticker}} - {{interval}}")
alertcondition(vwdema

DEMA RSI Overlay [BackQuant]DEMA RSI Overlay
PLEASE Read the following, knowing what an indicator does at its core before adding it into a system is pivotal. The core concepts can allow you to include it in a logical and sound manner.
Anyways,
BackQuant's new trading indicator that blends the Double Exponential Moving Average (DEMA) with the Relative Strength Index (RSI) to create a unique overlay on the trading chart. This combination is not arbitrary; both the DEMA and RSI are revered for their distinct advantages in trading strategy development. Let's delve into the core components of this script, the rationale behind choosing DEMA and RSI, the logic of long and short signals, and its practical trading applications.
Understanding DEMA
DEMA is an enhanced version of the conventional exponential moving average that aims to reduce the lag inherent in traditional averages. It does this by applying more weight to recent prices. The reduction in lag makes DEMA an excellent tool for tracking price trends more closely. In the context of this script, DEMA serves as the foundation for the RSI calculation, offering a smoother and more responsive signal line that can provide clearer trend indications.
Why DEMA?
DEMA is chosen for its responsiveness to price changes. This characteristic is particularly beneficial in fast-moving markets where entering and exiting positions quickly is crucial. By using DEMA as the price source, the script ensures that the signals generated are timely and reflective of the current market conditions, reducing the risk of entering or exiting a trade based on outdated information.
Integrating RSI
The RSI, a momentum oscillator, measures the speed and change of price movements. It oscillates between zero and 100 and is typically used to identify overbought or oversold conditions. In this script, the RSI is calculated based on DEMA, which means it inherits the responsiveness of DEMA, allowing traders to spot potential reversals or continuation signals sooner.
Why RSI?
Incorporating RSI offers a measure of price momentum and market conditions relative to past performance. By setting thresholds for long (buy) and short (sell) signals, the script uses RSI to identify potential turning points in the market, providing traders with strategic entry and exit points.
Calculating Long and Short Signals
Long Signals : These are generated when the RSI of the DEMA crosses above the longThreshold (set at 70 by default) and the closing price is not above the upper volatility band. This suggests that the asset is gaining upward momentum while not being excessively overbought, presenting a potentially favorable buying opportunity.
Short Signals : Generated when the RSI of the DEMA falls below the shortThreshold (set at 55 by default). This indicates that the asset may be losing momentum or entering a downtrend, signaling a possible selling or shorting opportunity.
Logical Soundness
The logic of combining DEMA with RSI for generating trade signals is sound for several reasons:
Timeliness : The use of DEMA ensures that the price source for RSI calculation is up-to-date, making the momentum signals more relevant.
Balance : By setting distinct thresholds for long and short signals, the script balances sensitivity and specificity, aiming to minimize false signals while capturing genuine market movements.
Adaptability : The inclusion of user inputs for periods and thresholds allows traders to customize the indicator to fit various trading styles and timeframes.
Trading Use-Cases
This DEMA RSI Overlay indicator is versatile and can be applied across different markets and timeframes. Its primary use-cases include:
Trend Following: Traders can use it to identify the start of a new trend or the continuation of an existing trend.
Swing Trading: The indicator's sensitivity to price changes makes it ideal for swing traders looking to capitalize on short to medium-term price movements.
Risk Management: By providing clear long and short signals, it helps traders manage their positions more effectively, potentially reducing the risk of significant losses.
Final Note
We have also decided to add in the option of standard deviation bands, calculated on the DEMA, this can be used as a point of confluence rendering trading ranges. Expanding when volatility is high and compressing when it is low.
For example:
This provides the user with a 1, 2, 3 standard deviation band of the DEMA.
Thus following all of the key points here are some sample backtests on the 1D Chart
Disclaimer: Backtests are based off past results, and are not indicative of the future.
INDEX:BTCUSD
INDEX:ETHUSD
BINANCE:SOLUSD
DEMA Adjusted Average True Range [BackQuant]The use of the Double Exponential Moving Average (DEMA) within your Adjusted Average True Range (ATR) calculation serves as a cornerstone for enhancing the indicator's responsiveness to market changes. To delve deeper into why DEMA is employed specifically in the context of your ATR calculation, let's explore the inherent qualities of DEMA and its impact on the ATR's performance.
DEMA and Its Advantages
As previously mentioned, DEMA was designed to offer a more responsive alternative to the traditional Exponential Moving Average (EMA). By giving more weight to recent price data, DEMA reduces the lag typically associated with moving averages. This reduction in lag is especially beneficial for short-term traders looking to capitalize on trend reversals and other market movements as swiftly as possible.
The calculation of DEMA involves the following steps:
Calculate EMA1: This is the Exponential Moving Average of the price.
Calculate EMA2: This is the Exponential Moving Average of EMA1, thus it is a smoothing of a smoothing, leading to a greater lag.
Formulate DEMA: The formula
EMA1 = EMA of price
EMA2 = EMA of EMA1
DEMA = (2 x EMA1) - EMA2
effectively doubles the weighting of the most recent data points by subtracting the lagged, double-smoothed EMA2 from twice the single-smoothed EMA1.
This process enhances the moving average's sensitivity to recent price movements, allowing the DEMA to adhere more closely to the price bars than either EMA1 or EMA2 alone.
Integration with ATR
In the context of your ATR calculation, the integration of DEMA plays a crucial role in defining the indicator's core functionality. Here's a detailed explanation of how DEMA affects the ATR calculation:
Initial Determination of DEMA : By applying the DEMA formula to the chosen source data (which can be adjusted to use Heikin Ashi candle close prices for an even smoother analysis), you set a foundation for a more reactive trend-following mechanism within the ATR framework.
Application to ATR Bands : The calculated DEMA serves as the central line from which the ATR bands are derived. The ATR value, multiplied by a user-defined factor, is added to and subtracted from the DEMA to form the upper and lower bands, respectively. This dynamic adjustment not only reflects the volatility based on the ATR but does so in a way that is closely aligned with the most recent price action, thanks to the utilization of DEMA.
Enhanced Signal Quality : The responsiveness of DEMA ensures that the ATR bands adjust more promptly to changes in market conditions. This quality is vital for traders who rely on the ATR bands to identify potential entry and exit points, trend reversals, or to assess market volatility.
By employing DEMA as the core component in calculating the Adjusted Average True Range, your indicator leverages DEMA's reduced lag and increased weight on recent data to provide a more timely and accurate measure of market volatility. This innovative approach enhances the utility of the ATR by making it not only a tool for assessing volatility but also a more reactive indicator for trend analysis and trading signal generation.
The main concept of combining these is to reduce lag, get a more robust signal and still capture clear trends over medium time horizons.
For me, this is best used in confluence with other indicators, it can be made faster in order to get fasters response time, or slower. This is all depending on the needs of you as a trader.
User Inputs:
The script offers several user-configurable inputs, such as the period lengths for DEMA and ATR calculations, the multiplication factor for the ATR, and options to use Heikin Ashi candles or standard price data. Additionally, it allows for the toggling of visual features, like the plotting of the DEMA ATR and its moving average, and the application of color-coded trends on price bars.
Additional Features:
Moving Average Confluence: Traders can opt to display a moving average of the DEMA ATR, choosing from various types (e.g., SMA, EMA, HMA). This feature provides a layer of confluence, aiding in the identification of trend direction and strength.
Trend Identification :
The script employs logical conditions to ascertain the trend direction based on the movement of the DEMA ATR. It assigns colors to represent bullish or bearish trends, which are reflected in the plotted lines and the coloring of price bars.
Alerts :
Customizable alert conditions for trend reversals enhance the utility of the indicator for active trading, notifying users of significant changes in trend direction.
1D Backtests
We include these backtests as a general proxy for how they work.
Please do your own calibrating to suit it to your own needs and backtest.
Past results don't = future results but they can help you understand how it functions.
INDEX:BTCUSD
INDEX:ETHUSD
BINANCE:SOLUSD

REMA CROSSOVER BY JUGNUThis indicator triggers alerts for long and short positions on DAILY TIME FRAME for SWING trades based on the conditions which described below. This script will generate alerts when the following conditions are met:
LONG POSITION:
RSI(14) above 50.
EMA(5) crosses above EMA(10).
Indicator Triangle Green below price bars
SHORT POSITION:
RSI(14) below 50.
EMA(5) crosses down EMA(10).
Indicator Triangle RED above price bars
This script plots green and red triangles below and above the price bars to indicate long and short alert conditions, respectively. It also triggers alerts when these conditions are met.
Dee EMA 5.0
1. Indicator Features:
- The indicator can plot four different sets of EMA on a chart.
- The EMA values can be displayed on the chart with their respective names (e.g., ema9, ema20, etc.).
- The indicator allows customization of the EMA values.
2. Purpose of Dee_EMA 5.0:
- Dee_EMA 5.0 is a unique EMA indicator specially designed for traders to provide better insights and aid in trading decisions.
- The primary reason for building this indicator is to address the challenge of managing multiple time frames while using normal EMA tables.
- Traditional EMA tables might not show all EMA values across different time frames simultaneously, leading to time-consuming processes like shifting time frames and refreshing charts.
- Dee_EMA 5.0 solves this issue by displaying EMA values for different time frames in one table, allowing traders to make quick judgments without repeatedly changing time frames and refreshing charts.
3. Importance of Different Time Frame EMA Values:
- Different time frames EMA values are crucial in trading because they provide valuable insights into the market dynamics at various levels.
- When using shorter time frames (e.g., 1-minute), EMA values can help identify short-term trends, support, and resistance levels.
- On the other hand, using larger time frames (e.g., 5-minute or 15-minute) provides more data and increases the accuracy of EMA-based analysis, enabling traders to identify longer-term trends and potential price movements.
4. EMA Crossover Table:
- Traders often prefer a clutter-free chart without too many lines, but they still need access to EMA values for analysis.
- The EMA table and EMA crossover table serve this purpose by providing EMA values and EMA crossover information in a structured table format.
- With the EMA crossover table, traders can quickly check EMA values and crossovers across different time frames without having to switch time frames repeatedly, saving time and facilitating faster decision-making during trading.
In summary, Dee_EMA 5.0 is an EMA indicator designed to help traders efficiently analyze EMA values across different time frames, allowing for faster and more informed trading decisions. The EMA crossover table provides additional convenience by presenting EMA crossovers without cluttering the chart.

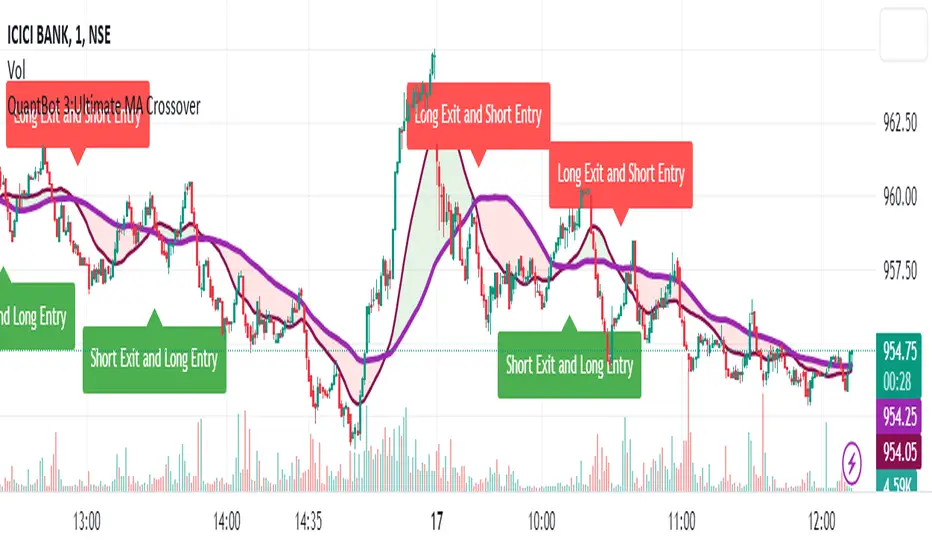
QuantBot 3:Ultimate MA CrossoverTHIS IS A SAMPLE CODE TO AUTOMATE WITH QUANTBOT
The moving average strategy is a popular and widely used technique in financial analysis and trading. It involves the calculation and analysis of moving averages, which are mathematical indicators that smooth out price data over a specified period. This strategy is primarily applied in the context of stock trading, but it can be used for other financial instruments as well.
The concept behind the moving average strategy is to identify trends and potential entry or exit points in the market. By calculating and analyzing moving averages of different timeframes, traders aim to capture the overall direction of the price movement and filter out short-term fluctuations or noise.
To implement the moving average strategy, a trader typically selects two or more moving averages with different periods. The most common combinations include the 50-day and 200-day moving averages. The shorter-term moving average is considered more reactive to price changes, while the longer-term moving average provides a smoother trend line. When the shorter-term moving average crosses above the longer-term moving average, it generates a buy signal, indicating a potential upward trend. Conversely, when the shorter-term moving average crosses below the longer-term moving average, it generates a sell signal, indicating a potential downward trend.
Traders can use various variations of the moving average strategy based on their trading objectives and risk tolerance. For instance, some traders may prefer to use exponential moving averages (EMAs) instead of simple moving averages (SMAs) to give more weight to recent price data. Others may incorporate additional indicators or filters to confirm signals or avoid false signals.
One of the strengths of the moving average strategy is its simplicity and ease of interpretation. It provides a clear visual representation of the trend direction and potential entry or exit points. However, it's important to note that the moving average strategy is a lagging indicator, meaning that it relies on past price data. Therefore, it may not always accurately predict future market movements or capture sudden reversals.
Like any trading strategy, the moving average strategy is not foolproof and carries risks. It is crucial for traders to conduct thorough analysis, consider other relevant factors, and manage their risk through proper position sizing and risk management techniques. Additionally, it's important to adapt the strategy to specific market conditions and combine it with other complementary strategies or indicators for improved decision-making.
Overall, the moving average strategy serves as a valuable tool for traders to identify and follow trends in financial markets, aiding in the analysis of price movements and potential trading opportunities.
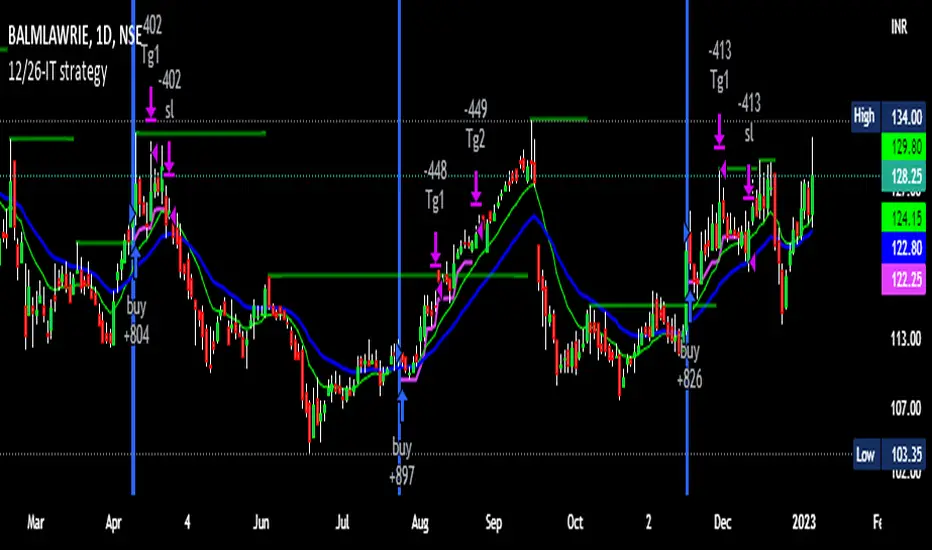
12/26-IT strategyBase of this Strategy is crossover of 12EMA on 26EMA.
Also multiple other criteria has to meet for buy signal, Criterias mentioned below
//////////////////////////////////
There two entry option to select. Either one or both can be selected:
1. Only 12/26 Cross over
a. 12/26 crossover.
b. RSI (14) value to be between a range (RSI is inbuilt, but lower and upper range can be defined in settings)
c. MACD (12, 26) to be positive and above signal line (this is inbuilt)
2. Recent 12/26 Cross over and closing above pivot point(resistance)
a. 12/26 crossover has to be recent, CrossOverLookbackCandles value will look for crossover in # previous candles..
b. RSI (14) value to be between a range (RSI is inbuilt, but lower and upper range can be defined in settings)
c. MACD (12, 26) to be positive and above signal line (this is inbuilt)
d. closing above resistance line
//////////////////////////////////
For Exit we have three options. you can select any SL as per your need, multiple SLs can also be selected
1. Trailing Stop Loss.
Source for TSL is adjustable(open, close, high or low), also you have to mention % below your source TSL has to be placed.
Once closing is below TSL, exit will be triggered.
2. Closing below 7SMA
After 7SMA SL is enabled, 7SMA will be plotted on chart and exit signal will be triggered when closing is below 7SMA.
Choose this option for LESS risk and rewards
3. 12/26 Crossdown
Once 12EMA crossdown below 26EMA, exit will be triggered.
Choose this option for HIGH risk and rewards
//////////////////////////////////
Resistance line is plotted based on left and right candles, if 10(can be changed) is used for both left and right, indicator will look for 10 candles in left and 10 candles in right and if both left and right candle are lower then a line is plotted.
Source has to be selected (close or high)
//////////////////////////////////
Qty mentioned in Buy trigger will be based on BUYVALUE entered
//////////////////////////////////
Multiple Target option is available, if first target is matched how much percentage of qty to be sold can be defined.
If you wish to have only one Target, then exit qty in first target must be 100
Smooth EMA/DEMA/TEMA/EHMA (SEMA)This is my attempt at smoothing the exponential moving average any its cousins. I literally just smoothed the source and alpha and this is what we got. I really like this because you get a nice smooth yet fast acting moving average that works better than a traditional simple moving average. This script also included directional alerts.
Smooth EMA
Smooth DEMA
Smooth TEMA
Smooth EHMA

SUPER MULTI MOVING AVERAGE [Gabbo]📈 Moving Average Indicator Update - Version 2
🔹 New Features and Improvements:
1️⃣ Enhanced MA Selection for Table Lines:
Previously, the indicator did not allow users to choose a different Moving Average type for the table lines. Now, you can select the MA type for the table.
2️⃣ New Table Text Customization Inputs:
Added inputs to choose the table text color and size for a more personalized display.
3️⃣ Improved Input Visibility and Organization:
We’ve reorganized the inputs so that the most commonly used options are now placed at the beginning for quicker and more convenient configuration.
4️⃣ Bug Fixes and Code Improvements:
Minor bugs have been fixed, and the code has been optimized for improved stability and performance. The code is now cleaner and fully functional in version 6.
5️⃣ Cometreon Public Library Integration:
To lighten the code and improve modularity, we’ve integrated the Cometreon public library. This makes the code more efficient and reduces the need to duplicate common functions.
☄️ With this update, the Moving Average indicator becomes even more versatile and user-friendly, offering a refined table interface and enhanced customization options!

GAIN MORE GURU 7 EMA7 ema in a single indicator for all those who cant add more than three ema in chart

RSI-Adaptive, GKYZ-Filtered DEMA [Loxx]RSI-Adaptive, GKYZ-Filtered DEMA is a Garman-Klass-Yang-Zhang Historical Volatility Filtered, RSI-Adaptive Double Exponential Moving Average. This is an experimental indicator. The way this is calculated is by turning RSI into an alpha value that is then injected into a DEMA function to output price. Price is then filtered using GKYZ Historical volatility. This process of creating an alpha out of RSI is only relevant to EMA-based moving averages that use an alpha value for it's calculation.
What is Garman-Klass-Yang-Zhang Historical Volatility?
Yang and Zhang derived an extension to the Garman Klass historical volatility estimator that allows for opening jumps. It assumes Brownian motion with zero drift. This is currently the preferred version of open-high-low-close volatility estimator for zero drift and has an efficiency of 8 times the classic close-to-close estimator. Note that when the drift is nonzero, but instead relative large to the volatility , this estimator will tend to overestimate the volatility . The Garman-Klass-Yang-Zhang Historical Volatility calculation is as follows:
GKYZHV = sqrt((Z/n) * sum((log(open(k)/close( k-1 )))^2 + (0.5*(log(high(k)/low(k)))^2) - (2*log(2) - 1)*(log(close(k)/open(2:end)))^2))
Included
Alerts
Signals
Loxx's Expanded Source Types
Bar coloring

Step Generalized Double DEMA (ATR based) [Loxx]Step Generalized Double DEMA (ATR based) works like a T3 moving average but is less smooth. This is on purpose to catch more signals. The addition of ATR stepped filtering reduces noise while maintaining signal integrity. This one comes via Mr. Tools.
Theory:
The double exponential moving average (DEMA), was developed by Patrick Mulloy in an attempt to reduce the amount of lag time found in traditional moving averages. It was first introduced in the February 1994 issue of the magazine Technical Analysis of Stocks & Commodities in Mulloy's article "Smoothing Data with Faster Moving Averages". The way to calculate is the following :
The Double Exponential Moving Average calculations are based combinations of a single EMA and double EMA into a new EMA:
1. Calculate EMA
2. Calculate Smoothed EMA by applying EMA with the same period to the EMA calculated in the first step
3. Calculate DEMA
DEMA = (2 * EMA) - (Smoothed EMA)
This version:
For our purposes here, we are using Tim Tillson's (the inventor of T3) work, specifically, we are using the GDEMA of GDEMA for calculation (which is the "middle step" of T3 calculation). Since there are no versions showing that "middle step, this version covers that too. The result is smoother than Generalized DEMA, but is less smooth than T3 - one has to do some experimenting in order to find the optimal way to use it, but in any case, since it is "faster" than the T3 (Tim Tillson T3) and still smooth, it looks like a good compromise between speed and smoothness.
Usage:
You can use it as any regular average or you can use the color change of the indicator as a signal.
Included
Alerts
Signals
Bar coloring
Loxx's Expanded Source Types
Variety N-Tuple Moving Averages [Loxx]Variety N-Tuple Moving Averages is a moving average indicator that allows you to create 1- 30 tuple moving average types; i.e., Double-MA, Triple-MA, Quadruple-MA, Quintuple-MA, ... N-tuple-MA. This version contains 5 different moving average types including T3. A list of tuples can be found here if you'd like to name the order of the moving average by depth: Tuples extrapolated
You'll notice that this is a lot of code and could normally be packed into a single loop in order to extract the N-tuple MA, however due to Pine Script limitations and processing paradigm this is not possible ... yet.
If you choose the EMA option and select a depth of 2, this is the classic DEMA; EMA with a depth of 3 is the classic TEMA, and so on and so forth this is to help you understand how this indicator works. This version of NTMA is restricted to a maximum depth of 30 or less. Normally this indicator would include 50 depths but I've cut this down to 30 to reduce indicator load time. In the future, I'll create an updated NTMA that allows for more depth levels.
This is considered one of the top ten indicators in forex. You can read more about it here: forex-station.com
How this works
Step 1: Run factorial calculation on the depth value,
Step 2: Calculate weights of nested moving averages
factorial(nemadepth) / (factorial(nemadepth - k) * factorial(k); where nemadepth is the depth and k is the weight position
Examples of coefficient outputs:
6 Depth: 6 15 20 15 6
7 Depth: 7 21 35 35 21 7
8 Depth: 8 28 56 70 56 28 8
9 Depth: 9 36 34 84 126 126 84 36 9
10 Depth: 10 45 120 210 252 210 120 45 10
11 Depth: 11 55 165 330 462 462 330 165 55 11
12 Depth: 12 66 220 495 792 924 792 495 220 66 12
13 Depth: 13 78 286 715 1287 1716 1716 1287 715 286 78 13
Step 3: Apply coefficient to each moving average
For QEMA, which is 5 depth EMA, the caculation is as follows
ema1 = ta.ema(src, length)
ema2 = ta.ema(ema1, length)
ema3 = ta.ema(ema2, length)
ema4 = ta.ema(ema3, length)
ema5 = ta.ema(ema4, length)
qema = 5 * ema1 - 10 * ema2 + 10 * ema3 - 5 * ema4 + ema5
Included:
Alerts
Loxx's Expanded Source Types
Bar coloring

3EMATiranga3 EMAs 48 High, 48 Low and 10 Close
Trade can be taken when purple line crosses the high (green)

2 Ema Pullback StrategyHi everyone!
CAUTION... This is only an indicator. Do not rely 100% on it.
I made this indicator hoping to help everyone with this specific Pull Back Scalping Strategy.
RULES:
Time Chart of 5minuts
LONG Condition - "EMA Red Line" below the "EMA Blue Line" and wait for a green long signal.
SHORT Condition - "EMA Red Line" below the "EMA Blue Line" and wait for a red short signal
Feel free to add any adjustments or give feedback so we can improve.
The strategy idea and guidelines came from "The Master" Juan Luis.
Autor: © Germangroa

Price Action Signals V2Indicator that shows buy/sell signals based on price action and volume as it relates to a double EMA. If the candle is above the double EMA, we look for candles with long wicks on the top indicating selling pressure. If the candle is below the double EMA , we look for candles with a long bottom wick indicating buying pressure. The user defined parameters are the length of the double EMA and the length of the volume moving average. Lower timeframes such as 5 minutes and lower are better off using lower lengths while higher timeframes should user higher lengths. Your mileage will vary.
Note, while this indicator can signal the beginning of long term trends, it will also signal minor retracements. Do not blindly buy or sell based on a signal appearing, pay attention to where the candle is in the overall trend and wait for confirmation to avoid losses.