Double Exponential Moving Average (DEMA)


EMA/DEMA_group_stdThis indicator is like its sister indicator in that it measures dispersion but instead of being cumulative it measures distance between moving averages in each group.
Group 1:11, 13, 18, 21
Group 2:18, 21, 29, 34
Group 3: 29, 34, 47, 55
Group 4: 47, 55, 76, 89
Group 5: 76, 89 123, 144
Group 6: 123, 144, 199, 233
Group 7: 199, 233, 322, 377
How to use
1. Divergences
2. Moving average crosses
3. Momentum
Plotshape colors show when moving averages are nearing a crossover and level can be manually set in menu.

BTCs RSI Dip & EMA Crossover AlertThis indicator helps you catch potential reversal opportunities after a stock or crypto asset becomes oversold.
🛠 How it works:
Watches RSI (Relative Strength Index)
First, it waits for RSI to dip below a level you choose (default is 30), which often signals the asset is oversold and due for a bounce.
Waits for Price Confirmation
After the RSI dip, the indicator watches for the first time price closes above both the 55 EMA and 200 EMA — a strong sign that momentum may be shifting upward.
Sends a “Buy” Signal
When that happens, the script:
Plots a green “Buy” label on the chart
Triggers an alert (labeled "Buy Indicator") so you’re notified immediately
⚙️ Customizable Inputs:
RSI threshold (e.g. 30 or 25)
RSI period (e.g. 14)
EMA lengths (default: 55 and 200)
✅ Designed to:
Avoid false signals by requiring both RSI weakness and price strength
Only trigger once per RSI dip, so you’re not spammed with repeat alerts
Use it to stay patient during downtrends and get alerted when the technicals show a possible turnaround. Great for swing traders and longer-term entries.

ema/dema_cum_stdThis indicator measures distance between moving averages by first calculating the variance of a group of moving averages the converting to standard deviation by taking the square root of the variance and then normalized by dividing by price (close) and multiplying by 100 ( percent). Here are the groups
Group 1 :11,13, 18, 21
Group 2: 11, 13, 18, 21, 29, 34
Group 3: 11, 13, 18, 21, 29, 34, 47, 55
Group 4: 11, 13, 18, 21, 29, 34, 47, 55, 76, 89
Group 5: 11, 13, 18, 21, 29, 34, 47, 55, 76, 89, 123, 144
Group 6: 11, 13, 18, 21, 29, 34, 47, 55, 76, 89, 123, 144, 199, 233
Group 7: 11, 13, 18, 21, 29, 34, 47, 55, 76, 89, 123, 144, 199, 233, 322, 377
Group 8: 11, 13, 18, 21, 29, 34, 47, 55, 76, 89, 123, 144, 199, 233, 322, 377, 521, 610
Great for showing compression and expansion levels and showing divergences. I try to only use Groups 1-4 or Groups 1-5
Shows when moving average groups squeeze below the set level you set using plot shape function. Shape colors are color coordinated to match moving average dispersion plots
Uses DEMA and EMA

FinhedgesFinhedges is a professional-grade trend analysis tool designed for precision trading. Built for traders who demand clarity, accuracy, and reliability, this indicator empowers users with real-time market insights while maintaining a clean and user-friendly visual interface.
✅ Key Features:
📈 Advanced Trend Detection: Accurately identifies prevailing market trends to guide directional bias.
🟢🔴 Intelligent Signal System: Displays high-quality Buy and Sell signals optimized for both swing and intraday trading.
🧠 Smart Filtering Logic: Reduces noise and false signals for higher conviction entries.
📊 Customizable Trend Line: Visualizes trend direction clearly across all timeframes.
⏰ Built-in Alerts: Real-time notifications so you never miss a key opportunity.
📋 Optional Market Status Table: Provides a quick overview of trend and price data directly on the chart.

EMA Cross with Alert and LabelThis simple yet effective indicator helps you identify trend changes using the classic Exponential Moving Average (EMA) crossover strategy. It's designed to be clean, easy to read, and highly functional.
Features:
EMA Crossover Signals: Visualizes the crossover between a fast EMA and a slow EMA.
On-Chart Labels: Automatically plots "Buy" (green) and "Sell" (red) labels directly on the chart when a crossover occurs, making signals impossible to miss.
Built-in Alerts: Comes with pre-configured alert conditions for both bullish ("Buy Signal") and bearish ("Sell Signal") crosses. You can easily set up notifications from the TradingView "Alerts" menu.
Customizable: Easily change the lengths for the Fast and Slow EMAs from the indicator's settings menu to fit your trading style and timeframe.
How to Use:
Add the indicator to your chart.
A "Buy" label appears when the fast EMA crosses above the slow EMA (potential uptrend).
A "Sell" label appears when the fast EMA crosses below the slow EMA (potential downtrend).
To receive notifications, go to the "Alerts" panel, create a new alert, select this indicator as the condition, and choose between the "Buy Signal" or "Sell Signal".

VWAP + EMA Retracement Indicator SwiftEdgeVWAP + EMA Retracement Indicator
Overview
The VWAP + EMA Retracement Indicator is a powerful and visually engaging tool designed to help traders identify high-probability buy and sell opportunities in trending markets. By combining the Volume Weighted Average Price (VWAP) with two Exponential Moving Averages (EMAs) and a unique retracement-based signal logic, this indicator pinpoints moments when the price pulls back to a key zone before resuming its trend. Its modern, AI-inspired visuals and customizable features make it both intuitive and adaptable for traders of all levels.
What It Does
This indicator generates buy and sell signals based on a sophisticated yet straightforward strategy:
Buy Signals: Triggered when the price is above VWAP, has recently retraced to the zone between two EMAs (default 12 and 21 periods), and a strong bullish candle closes above both EMAs.
Sell Signals: Triggered when the price is below VWAP, has retraced to the EMA zone, and a strong bearish candle closes below both EMAs.
Signal Filtering: A customizable cooldown period ensures that only the first signal in a sequence is shown, reducing noise while preserving opportunities for new trends.
Confidence Scores: Each signal includes an AI-inspired confidence score (0-100%), calculated from candle strength and price distance to VWAP, helping traders gauge signal reliability.
The indicator’s visuals enhance decision-making with dynamic gradient lines, a highlighted retracement zone, and clear signal labels, all customizable to suit your preferences.
How It Works
The indicator integrates several components that work together to create a cohesive trading tool:
VWAP: Acts as a dynamic support/resistance level, reflecting the average price weighted by volume. It filters signals to ensure buys occur in uptrends (price above VWAP) and sells in downtrends (price below VWAP).
Dual EMAs: Two EMAs (default 12 and 21 periods) define a retracement zone where the price is likely to consolidate before continuing its trend. Signals are generated only after the price exits this zone with conviction.
Retracement Logic: The indicator looks for price pullbacks to the EMA zone within a user-defined lookback window (default 5 candles), ensuring signals align with trend continuation patterns.
Candle Strength: Signals require strong candles (bullish for buys, bearish for sells) with a minimum body size based on the Average True Range (ATR), filtering out weak or indecisive moves.
Cooldown Mechanism: A unique feature that prevents signal clutter by allowing only the first signal within a user-defined period (default 3 candles), balancing responsiveness with clarity.
Confidence Score: Combines candle body size and price distance to VWAP to assign a score, giving traders an at-a-glance measure of signal strength without needing external analysis.
These components are carefully combined to capture high-probability setups while minimizing false signals, making the indicator suitable for both short-term and swing trading.
How to Use It
Add to Chart: Apply the indicator to a 15-minute chart (recommended) or your preferred timeframe.
Customize Settings:
VWAP Source: Choose the price source (default: hlc3).
EMA Periods: Adjust the fast and slow EMA periods (default: 12 and 21).
Retracement Window: Set how many candles to look back for retracement (default: 5).
ATR Period & Body Size: Define candle strength requirements (default: 14 ATR period, 0.3 multiplier).
Cooldown Period: Control the minimum candles between signals (default: 3; set to 0 to disable).
Candle Requirements: Toggle whether signals require bullish/bearish candles or entire candle above/below EMAs.
Visuals: Enable/disable gradient colors, retracement zone, confidence scores, and choose a color scheme (Neon, Light, or Dark).
Interpret Signals:
Buy: A green "Buy" label with a confidence score appears below the candle when conditions are met.
Sell: A red "Sell" label with a confidence score appears above the candle.
Use the confidence score to prioritize higher-probability signals (e.g., above 80%).
Trade Management: Combine signals with your risk management strategy, such as setting stop-loss below the retracement zone and targeting a 1:2 risk-reward ratio.
Why It’s Unique
The VWAP + EMA Retracement Indicator stands out due to its thoughtful integration of classic indicators with modern enhancements:
Balanced Signal Filtering: The cooldown mechanism ensures clarity without missing key opportunities, unlike many indicators that overwhelm with frequent signals.
AI-Inspired Confidence: The confidence score simplifies decision-making by quantifying signal strength, mimicking advanced analytical tools in an accessible way.
Elegant Visuals: Dynamic gradients, a highlighted retracement zone, and customizable color schemes (Neon, Light, Dark) create a sleek, futuristic interface that’s both functional and visually appealing.
Flexibility: Extensive customization options let traders tailor the indicator to their style, from conservative swing trading to aggressive scalping.

EMA Crossover Strategy with 50 & 200 EMAs - Faisal AnwarThis indicator uses 50 and 200-day Exponential Moving Averages (EMAs) to identify significant trend directions and potential trading opportunities through golden crossovers and death crosses. It highlights the role of EMAs as dynamic support in uptrends and downtrends, enhancing trend-following strategies.
Detailed Explanation:
EMAs Used:
The strategy utilizes two key EMAs — the 50-day EMA and the 200-day EMA. The 50-day EMA is often seen as a medium-term trend indicator, while the 200-day EMA is regarded as a benchmark for the long-term market trend.
Golden Crossover:
This occurs when the 50-day EMA crosses above the 200-day EMA, traditionally considered a bullish signal indicating potential long positions.
Death Cross:
This event is marked by the 50-day EMA crossing below the 200-day EMA, typically viewed as a bearish signal suggesting potential short positions.
Trend Support Identification:
The script also identifies when the price is above the 50-day EMA during an uptrend (indicating ongoing support) and when the price is above the 200-day EMA during a downtrend, suggesting the EMA is acting as resistance turning into support.
Visual Tools:
The indicator plots these EMAs on the chart with distinct colors for easy differentiation and uses background color changes to visually indicate when these EMAs act as support. Buy and sell signals are clearly marked with shapes and text directly on the chart for actionable insights.
Usage Tips:
Trading Decisions:
This indicator is best used in markets with clear trends, where EMAs can effectively identify shifts in momentum and serve as reliable support or resistance levels.
Complementary Tools:
Consider combining this EMA strategy with other technical analysis tools like RSI or MACD for confirmation of signals to enhance the reliability of the trading signals.
Ideal for:
Traders looking for a visual tool to assist in identifying trend directions and optimal points for entering or exiting trades based on established technical analysis principles.
Gauti Market Maker Killzone EMA1. Identifying the Trend
Use Daily (1D) and Hourly (1H) Exponential Moving Averages (EMAs) to define the overall trend:
Bullish Trend: Both 1D and 1H EMAs are upward sloping, and the price is above these EMAs.
Bearish Trend: Both 1D and 1H EMAs are downward sloping, and the price is below these EMAs.
2. Confirmation with Higher Timeframes
Bullish Conditions:
Check 1D and 4H charts for price action above the EMA bands.
Look for price forming higher highs and higher lows or respecting support at the EMA bands.
Bearish Conditions:
Check 1D and 4H charts for price action below the EMA bands.
Look for price forming lower highs and lower lows or respecting resistance at the EMA bands.
Note: Crossover of EMAs on higher timeframes is an optional extra confirmation, but not mandatory for entry.
3. Entry Strategy
Use the 15-Minute (15M) timeframe for entries.
Entries are taken only during Killzones:
Killzones: London Open, New York Open, or other intraday key trading sessions. (Define the time ranges for these zones based on your trading hours.)
Wait for the price to touch or pull back to the EMA band during the Killzones in the direction of the overall trend:
In a bullish trend, enter long when the price touches the EMA band and shows signs of rejection or reversal.
In a bearish trend, enter short when the price touches the EMA band and shows signs of rejection or reversal.
4. Checklist for Entry
Confirm the following before entering:
1D Trend aligns with the 1H Trend.
Price Action in 1D and 4H supports the trend.
Killzone session is active.
Price is reacting to the EMA band on the 15M chart in the trend direction.

Adaptive DEMA Momentum Oscillator (ADMO)Overview:
The Adaptive DEMA Momentum Oscillator (ADMO) is an open-source technical analysis tool developed to measure market momentum using a Double Exponential Moving Average (DEMA) and adaptive standard deviation. By dynamically combining price deviation from the moving average with normalized standard deviation, ADMO provides traders with a powerful way to interpret market conditions.
Key Features:
Double Exponential Moving Average (DEMA):
The core calculation of the indicator is based on DEMA, which is known for being more responsive to price changes compared to traditional moving averages. This makes the ADMO capable of capturing trend momentum effectively.
Standard Deviation Integration:
A normalized standard deviation is used to adaptively weight the oscillator. This makes the indicator more sensitive to market volatility, enhancing responsiveness during high volatility and reducing sensitivity during calmer periods.
Oscillator Representation:
The final oscillator value is derived from the combination of the DEMA-based Z-score and the normalized standard deviation. This final value is visualized as a color-coded histogram, reflecting bullish or bearish momentum.
Color-Coded Histogram:
Bullish Momentum: Values above zero are colored using a customizable bullish color (default: light green).
Bearish Momentum: Values below zero are colored using a customizable bearish color (default: red).
How It Works:
Inputs:
DEMA Length: Defines the period used for calculating the Double Exponential Moving Average. It can be adjusted from 1 to 200 to suit different trading styles.
Standard Deviation Length: Sets the lookback period for standard deviation calculations, which influences the responsiveness of the oscillator.
Standard Deviation Weight (StdDev Weight): Controls the weight given to the normalized standard deviation, allowing customization of the oscillator's sensitivity to volatility.
Calculation Steps:
Double Exponential Moving Average Calculation:
The DEMA is calculated using two exponential moving averages, which helps in reducing lag compared to a simple moving average.
Z-score Calculation:
The Z-score is derived by comparing the difference between the DEMA and its smoothed average (LSMA) to the standard deviation. This indicates how far the current value is from the mean in units of standard deviation.
Normalized Standard Deviation:
The standard deviation is normalized by subtracting the mean standard deviation and dividing by the standard deviation of the values. This helps to make the oscillator adaptive to recent changes in volatility.
Final Oscillator Value:
The final value is calculated by multiplying the Z-score with a factor based on the normalized standard deviation, resulting in a momentum indicator that adapts to different market conditions.
Visualization:
Histogram: The oscillator is plotted as a histogram, with color-coded bars showing the strength and direction of market momentum.
Positive (bullish) values are shown in green, indicating upward momentum.
Negative (bearish) values are shown in red, indicating downward momentum.
Zero Line: A zero line is plotted to provide a reference point, helping users quickly determine whether the current momentum is bullish or bearish.
Example Use Cases:
Momentum Identification:
ADMO helps identify the current market momentum by dynamically adapting to changes in market volatility. When the histogram is above zero and green, it indicates bullish conditions, whereas values below zero and red suggest bearish momentum.
Volatility-Adjusted Signals:
The normalized standard deviation weighting allows the ADMO to provide more reliable signals during different market conditions. This makes it particularly useful for traders who want to be responsive to market volatility while avoiding false signals.
Trend Confirmation and Divergence:
ADMO can be used to confirm the strength of a trend or identify potential divergences between price and momentum. This helps traders spot potential reversal points or continuation signals.
Summary:
The Adaptive DEMA Momentum Oscillator (ADMO) offers a unique approach by combining momentum analysis with adaptive standard deviation. The integration of DEMA makes it responsive to price changes, while the standard deviation adjustment helps it stay relevant in both high and low volatility environments. It's a versatile tool for traders who need an adaptive, momentum-based approach to technical analysis.
Feel free to explore the code and adapt it to your trading strategy. The open-source nature of this tool allows you to adjust the settings and visualize the output to fit your personal trading preferences.

MA Touch Alert SystemThis is a alert system This Pine Script creates an alert system in TradingView to notify you whenever the price touches a specified moving average. With adjustable settings, you can set your preferred moving average period, such as 50 or 200. The script calculates this moving average and triggers an alert if the price crosses it from above or below, enabling you to stay informed about important trend reversals. A visual on-chart label marks these points, and the alert condition ensures you receive notifications through TradingView. Perfect for traders looking to automate key level monitoring, this script supports trend-following and reversal strategies.

Dema Percentile Standard DeviationDema Percentile Standard Deviation
The Dema Percentile Standard Deviation indicator is a robust tool designed to identify and follow trends in financial markets.
How it works?
This code is straightforward and simple:
The price is smoothed using a DEMA (Double Exponential Moving Average).
Percentiles are then calculated on that DEMA.
When the closing price is below the lower percentile, it signals a potential short.
When the closing price is above the upper percentile and the Standard Deviation of the lower percentile, it signals a potential long.
Settings
Dema/Percentile/SD/EMA Length's: Defines the period over which calculations are made.
Dema Source: The source of the price data used in calculations.
Percentiles: Selects the type of percentile used in calculations (options include 60/40, 60/45, 55/40, 55/45). In these settings, 60 and 55 determine percentile for long signals, while 45 and 40 determine percentile for short signals.
Features
Fully Customizable
Fully Customizable: Customize colors to display for long/short signals.
Display Options: Choose to show long/short signals as a background color, as a line on price action, or as trend momentum in a separate window.
EMA for Confluence: An EMA can be used for early entries/exits for added signal confirmation, but it may introduce noise—use with caution!
Built-in Alerts.
Indicator on Diffrent Assets
INDEX:BTCUSD 1D Chart (6 high 56 27 60/45 14)
CRYPTO:SOLUSD 1D Chart (24 open 31 20 60/40 14)
CRYPTO:RUNEUSD 1D Chart (10 close 56 14 60/40 14)
Remember no indicator would on all assets with default setting so FAFO with setting to get your desired signal.
Exponantial Spread StrategyIt is strongly recommended to evaluate the strategy's performance on long time frames such as 1D or 4H.
This strategy calculates a custom moving average by the formula EMA+(TEMA-DEMA)*G,
G being the gain parameter. The main idea behind that is since TEMA is much more adaptive than DEMA their spread give us momentum, and incorporating this with a gain allows us to calculate a very responsive but yet not noisy moving average.
We calculate 4 MAs like described with gains 0,1,2,3 from less adaptive (normal EMA) to most adaptive. When they align in terms of position and the price is above the original MA we enter a long position, and do partial exits at each crossunder weighted by how adaptive ma is, the more adaptive the less weight, we do a full stop when the price crossed below under the original MA or the position aligment changed.

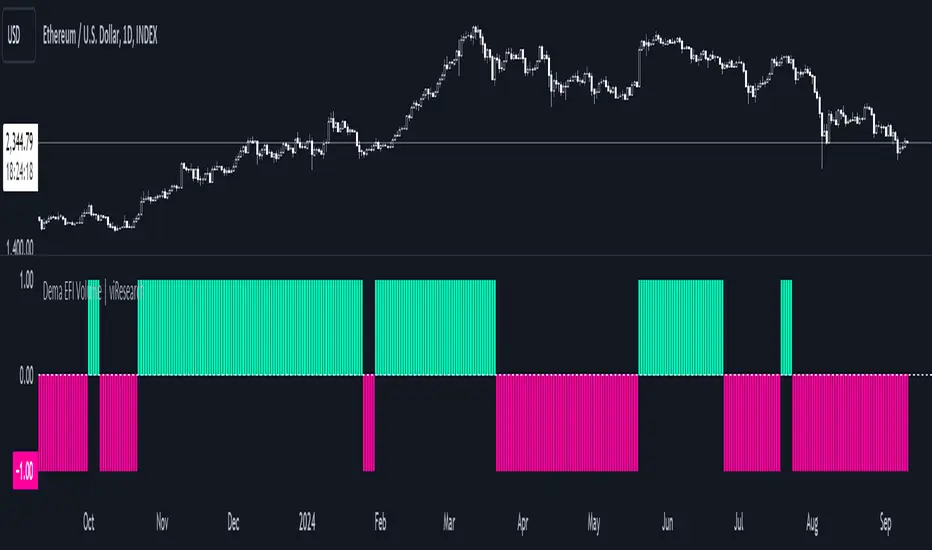
Dema EFI Volume | viResearchDema EFI Volume | viResearch
Conceptual Foundation and Innovation
The "Dema EFI Volume" indicator from viResearch integrates the Double Exponential Moving Average (DEMA) with the Elder Force Index (EFI), providing a dynamic approach to analyzing both price trends and volume strength. The DEMA is applied to smooth out price fluctuations while minimizing lag, which enhances the ability to detect trend direction. The EFI, developed by Dr. Alexander Elder, measures the power behind price movements by incorporating both price change and volume. This indicator, when combined with DEMA smoothing, gives traders a more accurate understanding of whether the current price movements are supported by significant volume, helping them make more informed trading decisions. The combination of DEMA and EFI allows traders to track trend strength while assessing the market’s volume dynamics, offering a more reliable method for identifying potential trend continuations or reversals.
Technical Composition and Calculation
The "Dema EFI Volume" script consists of two key components: the Double Exponential Moving Average (DEMA) and the Elder Force Index (EFI). The DEMA is applied to the selected source price over a user-defined length, providing a smoothed representation of price movements while reducing the noise that can occur with traditional moving averages. The EFI is calculated by multiplying the change in the DEMA by the volume over a user-defined period, which indicates whether the price movement is being driven by strong or weak volume. The script monitors the EFI values and volume data to generate trend signals. If the EFI is positive and volume increases, this indicates bullish pressure, while a negative EFI with decreasing volume suggests bearish conditions. The combination of these signals helps traders determine whether a price move is backed by sufficient volume, making it easier to identify trend continuations or potential reversals.
Features and User Inputs
The "Dema EFI Volume" script offers several customizable inputs, allowing traders to adapt the indicator to their specific strategies. The DEMA Length controls the smoothing applied to the price data, while the EFI Length defines the period over which the force index is calculated. Additionally, traders can set alert conditions for when a bullish or bearish EFI signal occurs, enabling them to react quickly to changing market conditions.
Practical Applications
The "Dema EFI Volume" indicator is designed for traders who want to combine price trend analysis with volume dynamics in a single tool. This makes it particularly effective for identifying trend continuations, as rising volume alongside a positive EFI suggests that the market move is supported by strong momentum. Conversely, decreasing volume and a negative EFI may indicate a weakening trend, giving traders early warning of potential reversals. The combination of DEMA and EFI also makes this indicator valuable for detecting trend strength by measuring whether price movements are backed by strong volume, confirming trend reversals by comparing price changes with volume activity, and improving trade entries and exits by analyzing both price and volume for more robust signals.
Advantages and Strategic Value
The "Dema EFI Volume" script offers significant advantages by combining the DEMA’s smoothing power with the EFI’s volume analysis. This integration allows traders to filter out noise in price data while ensuring that trend signals are backed by meaningful volume. The result is a more reliable tool for trend-following and reversal detection, making it easier for traders to stay aligned with strong market moves while avoiding false signals caused by low-volume fluctuations. The dual focus on price and volume makes the "Dema EFI Volume" an ideal tool for traders who value a comprehensive approach to market analysis.
Alerts and Visual Cues
The script includes alert conditions that notify traders when a significant EFI signal occurs. The "EFI Volume Long" alert is triggered when the EFI is positive and volume increases, indicating a potential upward trend. The "EFI Volume Short" alert signals a possible downward trend when the EFI turns negative and volume decreases. Visual cues, such as the color and direction of the plotted EFI line, help traders quickly identify trend shifts and make timely decisions.
Summary and Usage Tips
The "Dema EFI Volume | viResearch" indicator provides traders with a powerful tool for analyzing both price trends and volume strength. By incorporating this script into your trading strategy, you can improve your ability to detect trend continuations and reversals, making more informed decisions based on a combination of price movement and volume dynamics. Whether you are focused on identifying trend strength or looking for early reversal signals, the "Dema EFI Volume" offers a reliable and customizable solution for traders of all levels.
Note: Backtests are based on past results and are not indicative of future performance.
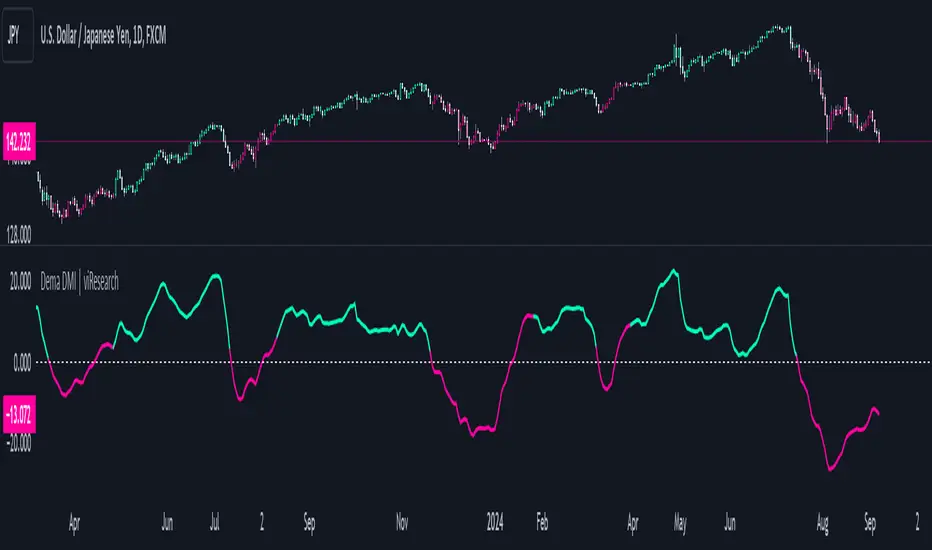
Dema DMI | viResearchDema DMI | viResearch
Conceptual Foundation and Innovation
The "Dema DMI" indicator integrates the Double Exponential Moving Average (DEMA) with the Directional Movement Index (DMI), creating a more responsive and precise trend-following system. The DEMA is used to smooth price data while minimizing lag, making it highly effective for trend detection. The DMI, on the other hand, measures the strength and direction of a trend by analyzing positive and negative directional movements. By combining these two elements, the "Dema DMI" offers traders a powerful tool for identifying trend changes and evaluating the strength of ongoing trends. This combination helps filter out noise in price data while maintaining sensitivity to market movements, providing better trend signals and decision-making opportunities.
Technical Composition and Calculation
The "Dema DMI" script uses two main components: the Double Exponential Moving Average (DEMA) and the Directional Movement Index (DMI). The DEMA is applied to both the high and low prices, creating smoothed versions of these prices based on a user-defined length. The DMI is then calculated by comparing changes in the smoothed high and low prices to measure directional movement. Positive directional movement (DM+) and negative directional movement (DM−) are calculated by evaluating whether the price is trending upward or downward, and the Average Directional Index (ADX) is computed to measure the strength of the trend. The ADX is smoothed to provide a more stable signal of trend strength.
Features and User Inputs
The "Dema DMI" script provides several customizable inputs, enabling traders to tailor the indicator to their strategies. The DEMA Length controls the period over which the DEMA is calculated for both high and low prices. The DMI Length sets the window for calculating directional movement, while the ADX Smoothing Length determines how smooth the ADX line appears, making it easier to assess whether a trend is strengthening or weakening. The script also includes customizable bar colors and alert conditions, providing traders with clear visual cues and notifications when a trend change occurs.
Practical Applications
The "Dema DMI" indicator is designed for traders looking to assess trend strength and direction more effectively. The DEMA smooths price movements, while the DMI highlights shifts in directional movement, providing early signals of potential trend reversals. The ADX helps gauge whether a trend is gaining momentum, allowing traders to improve the timing of trade entries and exits. Additionally, the customizable inputs make the indicator adaptable to different market conditions, ensuring its usefulness in both trending and ranging environments.
Advantages and Strategic Value
The "Dema DMI" script offers significant value by merging the smoothing effects of DEMA with the directional analysis of the DMI. This combination reduces the lag commonly associated with trend-following indicators, providing more timely and accurate trend signals. The ADX further enhances the indicator’s utility by measuring the strength of the trend, helping traders filter out weak signals and stay aligned with stronger trends. This makes the "Dema DMI" an ideal tool for traders seeking to improve their trend-following strategies and optimize their market positioning.
Alerts and Visual Cues
The script includes alert conditions that notify traders when a significant trend change occurs. The "Dema DMI Long" alert is triggered when the indicator detects an upward trend, while the "Dema DMI Short" alert signals a potential downward trend. Visual cues, such as changes in the bar color and the difference between positive and negative directional movement, help traders quickly identify trend shifts and act accordingly.
Summary and Usage Tips
The "Dema DMI | viResearch" indicator combines the smoothing benefits of the DEMA with the directional analysis of the DMI, providing traders with a reliable tool for detecting trend changes and confirming trend strength. By incorporating this script into your trading strategy, you can improve your ability to detect early trend reversals, confirm trend direction, and reduce noise in price data. The "Dema DMI" is a flexible and adaptable solution for traders looking to enhance their technical analysis in various market conditions.
Note: Backtests are based on past results and are not indicative of future performance.
Dema AFR | viResearchDema AFR | viResearch
Conceptual Foundation and Innovation
The "Dema AFR" indicator combines the Double Exponential Moving Average (DEMA) with an Average True Range (ATR)-based adaptive factor to create a responsive and adaptable trend-following system. The DEMA is known for its ability to smooth price data while reducing lag, making it highly effective for trend detection. By incorporating the ATR as a volatility factor, this indicator adapts dynamically to market conditions, allowing traders to capture trends while accounting for changes in volatility. The result is the Adaptive Factor Range (AFR), which provides clear signals for potential trend shifts and helps manage risk through its adaptive nature. This combination of DEMA smoothing and an ATR-based factor enables traders to follow trends more effectively while maintaining sensitivity to changing market conditions.
Technical Composition and Calculation
The "Dema AFR" script consists of two main components: the Double Exponential Moving Average (DEMA) and the Adaptive Factor Range (AFR). The DEMA is calculated over a user-defined length, smoothing out price fluctuations while reducing lag compared to traditional moving averages. The ATR is used to create a dynamic factor that adjusts the AFR based on market volatility. The factor is calculated by multiplying the ATR by a user-defined factor value, which scales the ATR to define upper and lower bounds for the AFR. The Adaptive Factor Range is derived from the DEMA, with upper and lower bounds set by adding or subtracting the ATR-based factor from the DEMA. When the price moves outside these bounds, the AFR is adjusted, and signals are generated. If the lower bound is exceeded, the AFR adjusts upward, while exceeding the upper bound causes the AFR to adjust downward. This dynamic adjustment helps the indicator stay responsive to market movements.
Features and User Inputs
The "Dema AFR" script provides several customizable inputs, allowing traders to tailor the indicator to their strategies. The DEMA Length controls the smoothing period for the DEMA, while the ATR Period defines the window for calculating the Average True Range. The ATR Factor determines the scale of the adaptive factor, controlling how much the AFR adjusts to volatility. Additionally, customizable bar colors and alert conditions allow traders to visualize the trend direction and receive notifications when key trend shifts occur.
Practical Applications
The "Dema AFR" indicator is designed for traders who want to capture trends while adapting to market volatility. The adaptive nature of the AFR makes it responsive to trend changes, providing early signals of potential trend reversals as the AFR adjusts to market movements. By incorporating ATR into the AFR calculation, the indicator adjusts to changing volatility, helping traders manage risk by staying aligned with market conditions. The AFR also helps confirm whether a price move is supported by momentum, improving the accuracy of trade entries and exits.
Advantages and Strategic Value
The "Dema AFR" script offers a significant advantage by combining the smoothness of the DEMA with the adaptability of the ATR-based factor. This dynamic combination allows the indicator to adjust to market conditions, providing more reliable trend signals in both trending and volatile markets. The adaptive nature of the AFR reduces the risk of false signals and helps traders stay on the right side of the trend while managing risk through volatility-adjusted ranges.
Alerts and Visual Cues
The script includes alert conditions that notify traders of key trend changes. The "Dema AFR Long" alert is triggered when the AFR indicates a potential upward trend, while the "Dema AFR Short" alert signals a potential downward trend. Visual cues such as color changes in the bar chart help traders quickly identify shifts in trend direction, allowing them to make informed decisions in real time.
Summary and Usage Tips
The "Dema AFR | viResearch" indicator provides traders with a powerful tool for trend analysis by combining DEMA smoothing with an ATR-based adaptive factor. This script helps traders stay aligned with trends while accounting for market volatility, improving their ability to detect trend reversals and manage risk. By incorporating this indicator into your trading strategy, you can make more informed decisions, whether in trending or volatile market environments. The "Dema AFR" offers a reliable and flexible solution for traders at all levels.
Note: Backtests are based on past results and are not indicative of future performance.

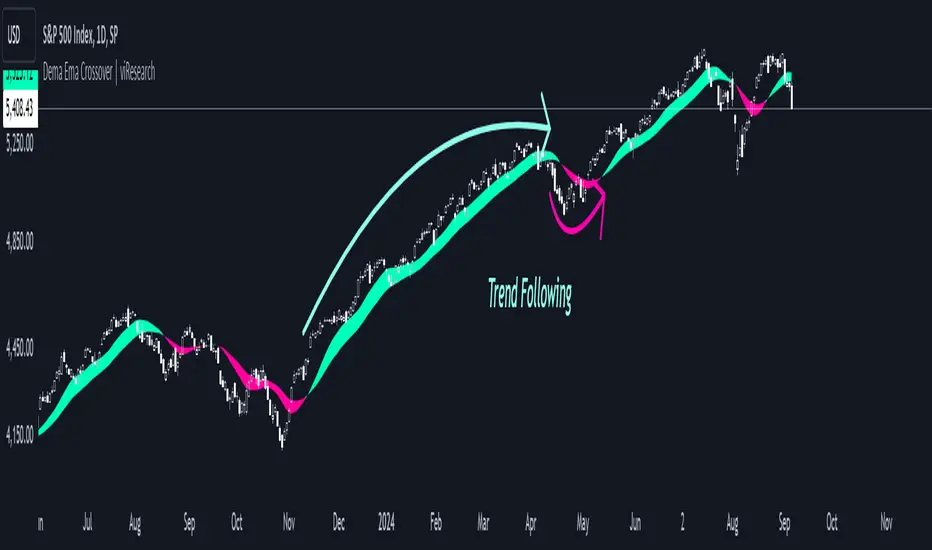
Dema Ema Crossover | viResearchDema Ema Crossover | viResearch
Conceptual Foundation and Innovation
The "Dema Ema Crossover" indicator combines the strengths of the Double Exponential Moving Average (DEMA) with an Exponential Moving Average (EMA) crossover strategy. The DEMA is well-known for its ability to reduce lag compared to standard moving averages, offering smoother trend-following signals. In this script, the DEMA is used as the foundation, with two EMAs applied on top of it to further refine the trend detection and crossover points. This combination provides traders with a robust tool for identifying trend shifts and potential entry or exit points.
By leveraging the faster responsiveness of the DEMA and using EMA crossovers, the "Dema Ema Crossover" indicator helps traders detect and act on trend reversals more efficiently, making it a powerful solution for capturing both short- and long-term market movements.
Technical Composition and Calculation
The "Dema Ema Crossover" script consists of three main components: the Double Exponential Moving Average (DEMA), the fast EMA, and the slow EMA. The DEMA is calculated based on the selected length and source price, providing a smooth representation of market trends. Two EMAs are then applied to the DEMA, with one being faster (shorter period) and the other slower (longer period). The crossover between these two EMAs generates the signals for trend changes.
For the DEMA, the calculation uses the ta.dema function, which reduces lag while maintaining smoothness in the moving average. The fast and slow EMAs are calculated using the ta.ema function, with the fast EMA responding more quickly to price changes, while the slow EMA captures broader trends. The crossover between these two EMAs is used to generate buy and sell signals based on the direction of the crossover.
Features and User Inputs
The "Dema Ema Crossover" script offers several customizable inputs that allow traders to tailor the indicator to their trading strategies. The DEMA Length controls how smooth the DEMA is, with a longer length creating a slower-moving average and a shorter length providing a more responsive one. The Fast EMA Length and Slow EMA Length are also customizable, allowing traders to adjust the sensitivity of the crossover signals based on their market outlook and preferred trading timeframe.
Practical Applications
The "Dema Ema Crossover" indicator is designed for traders looking for a reliable crossover strategy that combines the responsiveness of the DEMA with the precision of EMA crossovers. This tool is particularly effective for:
Identifying Trend Reversals: The crossover between the fast and slow EMAs applied to the DEMA provides early signals of potential trend reversals, allowing traders to position themselves in the market more effectively. Confirming Trend Direction: The combined effect of the DEMA and EMA crossovers helps confirm the strength of a trend, improving decision-making around trade entries and exits. Adapting to Different Market Conditions: The customizable parameters allow traders to adjust the sensitivity of the crossover signals, making the indicator suitable for both fast-moving markets and slower, trending environments.
Advantages and Strategic Value
The "Dema Ema Crossover" script offers a significant advantage by combining the smoothness of the DEMA with the accuracy of EMA crossovers. The DEMA’s ability to reduce lag while maintaining responsiveness makes it ideal for trend-following strategies, while the crossover between the fast and slow EMAs provides precise entry and exit points. This combination reduces false signals and helps traders adapt to changing market conditions, resulting in a more reliable and efficient trend-following system.
Alerts and Visual Cues
The script includes alert conditions to notify traders of key crossover events. The "Dema Ema Crossover Long" alert is triggered when the fast EMA crosses above the slow EMA, signaling a potential upward trend. Conversely, the "Dema Ema Crossover Short" alert signals a possible downward trend when the fast EMA crosses below the slow EMA. Visual cues such as colored fills between the two EMAs highlight these crossover points on the chart, helping traders quickly identify trend shifts.
Summary and Usage Tips
The "Dema Ema Crossover | viResearch" indicator provides traders with a powerful combination of the DEMA and EMA crossovers, offering a smooth yet responsive tool for detecting trend reversals and confirming trend direction. By incorporating this script into your trading strategy, you can improve your ability to capture trend changes with greater accuracy, reducing the impact of market noise. Whether you are focused on short-term market moves or long-term trends, the "Dema Ema Crossover" indicator offers a flexible and reliable solution for traders at all levels.
Note: Backtests are based on past results and are not indicative of future performance.
Dema Vstop | viResearchTitle: Dema Vstop | viResearch
Conceptual Foundation and Innovation
The "Dema Vstop" indicator combines the Double Exponential Moving Average (DEMA) with the Volatility Stop (Vstop) concept to improve trend-following and trend-reversal signals. This script provides a more responsive and dynamic approach to identifying trends and capturing market movements by integrating these two powerful tools. It is particularly effective for traders who seek a balance between smoothing out price action and quickly adapting to volatile changes in the market.
The DEMA smooths the price action more effectively than a traditional moving average, while the Vstop introduces a volatility-adjusted stop-loss mechanism, allowing traders to adapt to the market's changing conditions. The result is a robust system that captures both trend direction and potential reversal points with improved precision.
Technical Composition and Calculation
At the core of the "Dema Vstop" script are two primary components:
Double Exponential Moving Average (DEMA): This is used to smooth the source price over a user-defined period (dema_len), making it ideal for trend identification.
Volatility Stop (Vstop): The Vstop mechanism uses the Average True Range (ATR) to adjust stop-loss levels based on market volatility, allowing the indicator to account for changes in market conditions.
Key Calculations:
DEMA Calculation: Based on the selected length and source, the DEMA smooths the price data.
Vstop Calculation: The ATR (with customizable length) is used to adjust the stop distance, and the Vstop level is calculated based on whether the price is trending up or down.
Features and User Inputs
The "Dema Vstop" script offers a high degree of customization:
DEMA Length and Source: Control the smoothness of the DEMA and the price data being smoothed.
Vstop Length: Customize the length of the ATR calculation to control how reactive the Vstop is to price volatility.
Multiplier: Adjust the sensitivity of the Vstop to market volatility. A higher multiplier results in a wider stop, while a lower multiplier tightens the stop, making it more sensitive to price changes.
Practical Applications
The "Dema Vstop" is designed for traders looking for a hybrid trend-following system that is both smooth and responsive. It can be particularly useful for:
Identifying Trends: The combination of DEMA and Vstop makes trend-following easier, helping traders stay in profitable positions longer.
Volatility Protection: The Vstop dynamically adjusts based on market volatility, providing a built-in risk management tool that reduces exposure to volatile markets.
Reversals and Entries: The Vstop helps identify potential reversals by flipping its stop level when the trend direction changes, making it effective for signaling entries and exits with improved accuracy.
Advantages and Strategic Value
The key advantage of the "Dema Vstop" script lies in its ability to offer smoother trend detection through the DEMA while dynamically adapting to volatility using the Vstop. This combination reduces false signals, providing traders with a more stable and reliable tool for trend trading. Additionally, the customizable parameters allow traders to fine-tune the indicator to suit different trading styles and market conditions.
Alerts and Visual Cues
The script comes with built-in alert conditions that trigger when a trend shift is detected:
- Dema Vstop Long: Signals a potential upward trend.
- Dema Vstop Short: Signals a potential downward trend.
These alerts ensure that traders can stay informed about critical market changes without constantly monitoring the chart.
Summary and Usage Tips
The "Dema Vstop | viResearch" script is an innovative trend-following tool that combines the smoothness of DEMA with the adaptive qualities of Vstop. By offering a customizable and dynamic system, this indicator helps traders navigate the complexities of volatile markets while reducing noise and false signals. Incorporating this script into your trading strategy can improve trend analysis and increase the accuracy of entries and exits.
Note: Backtests are based on past results and are not indicative of future performance.

Dema Supertrend | viResearchDema Supertrend | viResearch
Conceptual Foundation and Innovation
The "Dema Supertrend" indicator by viResearch combines the benefits of the Double Exponential Moving Average (DEMA) with the popular Supertrend method to provide an advanced tool for trend detection and volatility management. By integrating DEMA into the Supertrend calculation, the indicator reduces lag while enhancing responsiveness to market changes. This results in more accurate trend identification and a refined method for capturing directional movements.
Technical Composition and Calculation
The "Dema Supertrend" builds on the core principles of the Supertrend indicator by incorporating DEMA for smoother and more responsive trend detection. The key innovation lies in replacing the raw price data with the DEMA-smoothed values, allowing traders to identify trends with reduced noise and enhanced precision.
DEMA and ATR-Based Supertrend Calculation:
DEMA Calculation (demalen): The Double Exponential Moving Average is applied to the price data (hlc3 by default) over a user-defined length, providing a smoothed representation of the market trend. DEMA minimizes lag compared to simple or exponential moving averages, allowing for more timely trend identification.
Supertrend Bands (u, l): The Supertrend upper and lower bands are calculated by adding or subtracting a multiple of the Average True Range (ATR) from the DEMA value. These bands dynamically adjust to market volatility, acting as support and resistance levels to guide trading decisions.
Trend Logic (L, S): The script determines whether the price is above or below the bands to signal an uptrend (L) or downtrend (S). Crosses above or below these bands trigger visual alerts and trend changes, with alerts built in for potential long or short positions.
Trend Continuation and Reversal:
The indicator ensures that once a trend is identified, it persists until clear reversal criteria are met. This is achieved through a comparison of the current and previous values of the Supertrend bands, reducing the occurrence of false signals in volatile markets.
Features and User Inputs
The "Dema Supertrend" script offers a range of customizable options, allowing traders to tailor the indicator to different market conditions and trading strategies:
Supertrend Length: The length of the Supertrend period can be adjusted, allowing traders to control the sensitivity of the trend detection.
Multiplier: The ATR multiplier adjusts the distance between the DEMA and the Supertrend bands. A higher multiplier reduces the frequency of trend changes, while a lower multiplier increases sensitivity to price movements.
DEMA Length: The length of the DEMA calculation can be customized to smooth price data over different timeframes, helping traders capture long-term trends or short-term movements more effectively.
Practical Applications
The "Dema Supertrend" is an ideal tool for traders who seek to follow trends while minimizing the impact of market noise. Its combination of DEMA and Supertrend provides a clear, dynamic view of the market's direction, making it especially effective in volatile environments.
Key Uses:
- Trend Following: The Dema Supertrend helps traders align their positions with the prevailing market trend by providing clear signals for uptrends and downtrends based on DEMA-smoothened price action.
- Volatility Management: The integration of ATR ensures that the Supertrend bands adapt to changes in market volatility, allowing traders to avoid entering trades during choppy, unpredictable price movements.
- Signal Confirmation: The script includes visual and alert-based signals for trend continuation and reversal, enabling traders to confirm entries and exits with greater accuracy.
Advantages and Strategic Value
The "Dema Supertrend" offers several strategic advantages:
- Reduced Lag: By integrating DEMA into the Supertrend calculation, the indicator responds more quickly to price changes, reducing the lag inherent in traditional moving averages.
- Noise Reduction: The use of DEMA filters out short-term fluctuations, providing a clearer signal for traders looking to capture significant market trends.
- Dynamic Adjustments: The combination of ATR and DEMA allows the indicator to adapt to both trending and ranging markets, making it suitable for a variety of trading strategies.
Summary and Usage Tips
The "Dema Supertrend" is a powerful tool for trend-following traders, offering a precise and adaptive method for identifying and confirming market direction. Traders can experiment with different settings for the Supertrend and DEMA lengths, as well as the ATR multiplier, to optimize the indicator for various trading environments. For best results, use the "Dema Supertrend" in conjunction with other technical analysis tools to confirm trends and manage risk. Whether you're seeking to capture long-term market moves or react to short-term volatility, the "Dema Supertrend" provides a reliable and flexible solution for your trading strategy.

Inverted SD Dema RSI | viResearchInverted SD Dema RSI | viResearch
The "Inverted SD Dema RSI" developed by viResearch introduces a new approach to trend analysis by combining the Double Exponential Moving Average (DEMA), Standard Deviation (SD), and Relative Strength Index (RSI). This unique indicator provides traders with a tool to capture market trends by integrating volatility-based thresholds. By using the smoothed DEMA along with standard deviation, the indicator offers improved responsiveness to price fluctuations, while RSI thresholds offer insight into overbought and oversold market conditions.
At the core of the "Inverted SD Dema RSI" is the combination of DEMA and standard deviation for a more nuanced view of market volatility. The use of RSI further aids in detecting price extremes and potential trend reversals.
DEMA Calculation (sublen): The Double Exponential Moving Average (DEMA) smoothes out price data over a user-defined period, reducing lag compared to traditional moving averages. This provides a clearer representation of the market's overall direction.
Standard Deviation Calculation (sublen_2): The standard deviation of the DEMA is used to define the upper (u) and lower (d) bands, highlighting areas where price volatility may signal a change in trend. These dynamic bands help traders gauge price volatility and potential breakouts or breakdowns.
RSI Calculation (len): The script applies the Relative Strength Index (RSI) to the smoothed DEMA values, allowing traders to detect momentum shifts based on a modified data set. This provides a more accurate reflection of market strength when combined with the DEMA.
Thresholds: The RSI is compared to user-defined thresholds (70 for overbought and 55 for oversold conditions). These thresholds help in identifying potential market reversals, especially when the price breaks outside of the calculated standard deviation bands.
Uptrend (L): An uptrend signal is generated when the RSI exceeds the upper threshold (70) and the price is not above the upper standard deviation band, indicating that there may be room for further price appreciation.
Downtrend (S): A downtrend signal occurs when the RSI falls below the lower threshold (55), indicating that the price may continue to decline.
The "Inverted SD Dema RSI" offers a wide range of customizable settings, allowing traders to adjust the indicator based on their trading style or market conditions.
DEMA Length (sublen): Controls the period used to smooth the price data, impacting the sensitivity of the DEMA to recent price movements.
Standard Deviation Length (sublen_2): Defines the length over which the standard deviation is calculated, helping traders control the width of the upper and lower bands.
RSI Length (len): Adjusts the period used for the RSI calculation, providing flexibility in determining overbought and oversold conditions.
RSI Thresholds: Traders can define their own levels for detecting trend reversals, with default values of 70 for an uptrend and 55 for a downtrend.
The "Inverted SD Dema RSI" is particularly well-suited for traders looking to capture trends while accounting for volatility and momentum. By using a smoothed DEMA as the foundation, it effectively filters out noise, making it ideal for detecting reliable trends in volatile markets.
Key Uses:
Trend Following: The indicator’s combination of DEMA, standard deviation, and RSI helps traders follow trends more effectively by reducing noise and identifying key momentum shifts.
Volatility Filtering: The use of standard deviation bands provides a dynamic measure of volatility, ensuring that traders are aware of potential breakouts or breakdowns in the market.
Momentum Detection: The inclusion of RSI ensures that the indicator is not only focused on trend direction but also on the strength of the underlying momentum, helping traders avoid entering trades during weak trends.
The "Inverted SD Dema RSI" provides several key advantages over traditional trend-following indicators:
Reduced Lag: The use of DEMA ensures faster trend detection, reducing the lag associated with simple moving averages.
Noise Reduction: The integration of standard deviation helps filter out irrelevant price movements, making it easier to identify significant trends.
Momentum Awareness: The addition of RSI provides valuable insight into the strength of trends, helping traders avoid false signals during periods of weak momentum.
The "Inverted SD Dema RSI" offers a powerful blend of trend-following and momentum detection, making it a versatile tool for modern traders. By integrating DEMA, standard deviation, and RSI, the indicator provides a comprehensive view of market trends and volatility. Traders are encouraged to experiment with different settings for the DEMA length, standard deviation, and RSI thresholds to fine-tune the indicator for their specific trading strategies. Whether used for trend confirmation, volatility assessment, or momentum analysis, the "Inverted SD Dema RSI" offers a valuable tool for traders seeking a comprehensive approach to market analysis.

Median Standard Deviation | viResearchMedian Standard Deviation | viResearch
The "Median Standard Deviation" indicator, developed by viResearch, introduces a unique combination of median smoothing and standard deviation to detect trends and volatility in market data. This tool provides traders with a stable and accurate measure of price trends by integrating median smoothing with a customized calculation of the standard deviation. This innovative approach allows for enhanced sensitivity to market fluctuations while filtering out short-term price noise.
Technical Composition and Calculation:
The "Median Standard Deviation" indicator incorporates median smoothing and dynamic standard deviation calculations to build upon traditional volatility measures.
Median Smoothing:
DEMA Calculation (len_dema): The script applies a Double Exponential Moving Average (DEMA) to smooth the price data over a user-defined period, reducing noise and helping traders focus on broader market trends.
Median Calculation (median_len): The smoothed DEMA data is further refined by calculating the 50th percentile (median) over a specified length, ensuring that the central tendency of price data is captured more accurately than with a simple moving average.
Volatility Measurement:
ATR Calculation (atr_len, atr_mul): The script incorporates the Average True Range (ATR) to measure market volatility. The user-defined ATR multiplier is applied to this value to calculate upper and lower trend bands around the median, providing a dynamic measure of potential price movement based on recent volatility.
Standard Deviation Analysis:
Standard Deviation Calculation (len_sd): The script calculates the standard deviation of the median over a user-defined length, providing another layer of volatility measurement. The upper and lower standard deviation bands (sdd, sdl) act as additional indicators of price extremes.
Trend Detection:
Trend Logic: The indicator uses the calculated bands to identify whether the price is moving within or outside the standard deviation and ATR bands. Crosses above or below these bands are used to signal potential uptrends or downtrends, offering traders a clear view of market direction.
Features and User Inputs:
The "Median Standard Deviation" script offers a variety of user inputs to customize the indicator to suit traders' styles and market conditions:
DEMA Length: Allows traders to adjust the sensitivity of the DEMA smoothing to control the amount of noise filtered from the price data.
Median Length: Users can define the length over which the median price is calculated, providing flexibility in capturing short-term or long-term trends.
ATR Length and Multiplier: These inputs let traders fine-tune the ATR calculation, affecting the size of the dynamic upper and lower bands.
Standard Deviation Length: Controls how the standard deviation is calculated, allowing for further customization in detecting price volatility.
Practical Applications:
The "Median Standard Deviation" indicator is particularly effective in volatile markets where price swings can lead to false signals using traditional methods. By combining median smoothing and standard deviation, this tool provides a more robust analysis of trends and price movements.
Key Uses:
Trend Following: The upper and lower bands provide clear signals for entering and exiting trades based on whether the price is moving outside the calculated ranges.
Volatility Detection: The integration of ATR and standard deviation bands allows traders to assess market volatility in real time, enabling more informed trading decisions.
Noise Reduction: The use of median smoothing ensures that short-term price fluctuations do not interfere with broader trend analysis, making this indicator ideal for traders looking to avoid whipsaws in volatile markets.
Advantages and Strategic Value:
The "Median Standard Deviation" indicator offers several key advantages:
Precision in Trend Detection: The combination of median smoothing and standard deviation allows traders to detect trends with greater accuracy, reducing the risk of false signals.
Customization: With several adjustable parameters, traders can fine-tune the indicator to suit different timeframes and trading strategies.
Volatility Sensitivity: By incorporating ATR and standard deviation, this indicator provides an adaptive measure of market volatility, ensuring that traders are always aware of potential price swings.
Summary and Usage Tips:
The "Median Standard Deviation" indicator is a powerful tool for traders looking to refine their analysis of market trends and volatility. Its combination of median smoothing and standard deviation provides a nuanced view of market movements, helping traders make better-informed decisions. It's recommended to experiment with the various input parameters to optimize the indicator for specific needs, whether used for trend detection, volatility analysis, or noise reduction. The "Median Standard Deviation" offers a reliable and adaptable solution for modern trading strategies.
Please keep in mind the following text: Backtests are based on past results and are not indicative of future performance.

Simplified MA Crossover indicatorThis is my first script, it is really simple logic and you probably saw something similar before. Is a crossover indicator between 2 Moving Average, one fast MA and the second slow MA.
Inputs you can adjust:
- 8 different source of MA's
- lenght of the MA's
- 7 different types of MA's ("EMA", "SMA", "RMA", "WMA", "DEMA", "TEMA", "HMA")
- 3 smoothing level of the fast MA
- plotting fast MA into the chart
- plotting crossover triangle shapes
I really enjoed the creation of this simple concept indicator, maybe not the fastest because of his nature but I liked work on it. I am sure is a good base to improve, study and try new idea.