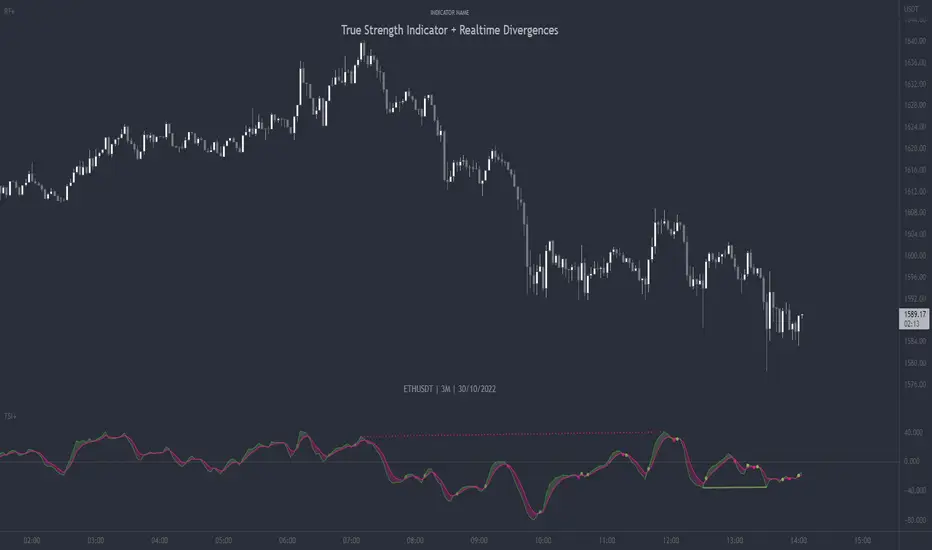
True Strength Indicator + Realtime DivergencesTrue Strength Indicator (TSI) + Realtime Divergences + Alerts + Lookback periods.
This version of the True Strength Indicator adds the following 5 additional features to the stock TSI by Tradingview:
- Optional divergence lines drawn directly onto the oscillator in realtime.
- Configurable alerts to notify you when divergences occur, as well as when the TSI and lagline bands crossover one another, when the oscillator begins heading up, or heading down.
- Configurable lookback periods to fine tune the divergences drawn in order to suit different trading styles and timeframes.
- Background colouring option to indicate when the two TSI bands, the TSI line and the TSI lagline, have crossed one another, either moving upwards or downwards, or optionally when the two TSI bands have crossed upwards and an external oscillator, which can be linked via the settings, has crossed above its centerline, and the TSI bands have crossed downwards and the external oscillator has crossed below its centerline.
- Alternate timeframe feature allows you to configure the oscillator to use data from a different timeframe than the chart it is loaded on.
This indicator adds additional features onto the stock TSI by Tradingview, whose core calculations remain unchanged, although this version has different settings as default to suit a shorter time period (it uses 6, 13, 4 by default, whereas the stock TSI typically ships with higher values, e.g. 25, 13, 13). Namely the configurable option to automatically, quickly and clearly draw divergence lines onto the oscillator for you as they occur in realtime. It also has the addition of unique alerts, so you can be notified when divergences occur without spending all day watching the charts. Furthermore, this version of the TSI comes with configurable lookback periods, which can be configured in order to adjust the sensitivity of the divergences, in order to suit shorter or higher timeframe trading approaches.
The True Strength Indicator
Tradingview describes the True Strength Indicator as follows:
“The True Strength Index (TSI) is a momentum oscillator that ranges between limits of -100 and +100 and has a base value of 0. Momentum is positive when the oscillator is positive (pointing to a bullish market bias) and vice versa. It was developed by William Blau and consists of 2 lines: the index line and an exponential moving average of the TSI, called the signal line. Traders may look for any of the following 5 types of conditions: overbought, oversold, centerline crossover, divergence and signal line crossover. The indicator is often used in combination with other signals..”
What are divergences?
Divergence is when the price of an asset is moving in the opposite direction of a technical indicator, such as an oscillator, or is moving contrary to other data. Divergence warns that the current price trend may be weakening, and in some cases may lead to the price changing direction.
There are 4 main types of divergence, which are split into 2 categories;
regular divergences and hidden divergences. Regular divergences indicate possible trend reversals, and hidden divergences indicate possible trend continuation.
Regular bullish divergence: An indication of a potential trend reversal, from the current downtrend, to an uptrend.
Regular bearish divergence: An indication of a potential trend reversal, from the current uptrend, to a downtrend.
Hidden bullish divergence: An indication of a potential uptrend continuation.
Hidden bearish divergence: An indication of a potential downtrend continuation.
Setting alerts.
With this indicator you can set alerts to notify you when any/all of the above types of divergences occur, on any chart timeframe you choose.
Configurable lookback values.
You can adjust the default lookback values to suit your prefered trading style and timeframe. If you like to trade a shorter time frame, lowering the default lookback values will make the divergences drawn more sensitive to short term price action.
How do traders use divergences in their trading?
A divergence is considered a leading indicator in technical analysis , meaning it has the ability to indicate a potential price move in the short term future.
Hidden bullish and hidden bearish divergences, which indicate a potential continuation of the current trend are sometimes considered a good place for traders to begin, since trend continuation occurs more frequently than reversals, or trend changes.
When trading regular bullish divergences and regular bearish divergences, which are indications of a trend reversal, the probability of it doing so may increase when these occur at a strong support or resistance level . A common mistake new traders make is to get into a regular divergence trade too early, assuming it will immediately reverse, but these can continue to form for some time before the trend eventually changes, by using forms of support or resistance as an added confluence, such as when price reaches a moving average, the success rate when trading these patterns may increase.
Typically, traders will manually draw lines across the swing highs and swing lows of both the price chart and the oscillator to see whether they appear to present a divergence, this indicator will draw them for you, quickly and clearly, and can notify you when they occur.
Disclaimer: This script includes code from the stock TSI by Tradingview as well as the Divergence for Many Indicators v4 by LonesomeTheBlue
Divergence
RSI + MA, LinReg, ZZ (HH HL LH LL), Div, Ichi, MACD and TSI HistRelative Strength Index with Moving Average, Linear Regression, Zig Zag (Highs and Lows), Divergence, Ichimoku Cloud, Moving Average Convergence Divergence and True Strength Index Histogram
This script is based on zdmre's RSI script, I revamped a lot of things and added a few indicators from ParkF's RSI script.
Disable Labels in the Style tab and the histogram if you don't enlarge the indicator and it seems too small.
Look to buy in the oversold area and bounce of the support of the linear regression.
Look to sell in the overbought area and bounce of the resistance of the linear regression.
Look for retracement to the moving average or horizontal lines, and divergences for potential reversal.
RSI
The Relative Strength Index (RSI) is a well versed momentum based oscillator which is used to measure the speed (velocity) as well as the change (magnitude) of directional price movements.
Moving Average
Moving Average (MA) is a good way to gauge momentum as well as to confirm trends, and define areas of support and resistance.
Linear Regression
The Linear Regression indicator visualizes the general price trend of a specific part of the chart based on the Linear Regression calculation.
Zig Zag (Highs and Lows)
The Zig Zag indicator is used to identify price trends, and in doing so plots points on the chart to mark whenever prices reverse by a larger percentage point than a predetermined variable or marker.
Divergence
The divergence indicator warns traders and technical analysts of changes in a price trend, oftentimes that it is weakening or changing direction.
Ichimoku Cloud
The Ichimoku Cloud is a package of multiple technical indicators that signal support, resistance, market trend, and market momentum.
MACD and TSI Histogram
MACD can be used to identify aspects of a security's overall trend.
The True Strength Index indicator is a momentum oscillator designed to detect, confirm or visualize the strength of a trend.

Multi-timeframe Squeeze Mom + ADX and DIsMulti-timeframe Squeeze and ADX
This indicator is designed to be able to get used in combination with others that can lead to a potential help for trading.
The indicator uses colors such us light green, dark green, light red and dark red. Light green and light red to indicate the second half and strongest movement of an upwards and downwards movement, respectively. The same for the first half of an upwards or downwards movement, dark red for the possible start of the upwards movement and dark green ad possible start of the downwards movement.
The indicator is multi-timeframe because the trader can configure within the menu a background timeframe, which plots a squeeze momentum for a different timeframe than the one selected for the main graph. It plots the background timeframe with an area style, while the main squeeze is plotted with a column style. This helps the traders to analyze whether entering a position countering a higher timeframe upwards or downwards squeeze momentum.
It also shows the divergences that occur between the price and the squeeze momentum that can add strength to a potential movement upwards or downwards.
The ADX, DI+ and DI- lines are also added to determine the potential strength of the movement in the monitor (squeeze momentum). If the DI+ is over the DI-, then the strength is likely higher upwards and the opposite for the downwards strength.
Fundamentals
Squeeze momentum: It shows the periods when volatility increases or decreases, in other words, when the market goes from the trend into flat movement and vice versa.
ADX (Average Directional Index): The ADX helps the indicator to estimate the strength of the movement, always considering the DI+ and DI- to not go against the trend strength.
Positive (DI+) and Negative DI (DI-): Both DI+ and DI- measure up and down price movement, in some cases crossovers of these lines can be used as trade signals.
Divergences: Divergence occur when the price of an asset is moving in the opposite direction of a technical indicator, such as an oscillator (squeeze momentum). Divergence warns that the current price trend may be weakening, and in some cases may lead to the price changing direction.
Panel
This panel allows the trader to have a summary of the values of the direction and strength of the movement. It has the following characteristics:
It is placed on the right middle side of the chart indicator by the default.
Its colors changes according to the indicator’s values.
The summary box shows the projection for the main squeeze plot and also for the background squeeze plot. If only one is needed, it can be changed on the menu of the indicator.
Summary
From all previously mentioned, it can be stated that the indicator allows users to:
Detect the direction of trends
Detect price and squeeze divergences
Get a table summarizing important values of the indicator to determine the strength of a trend.

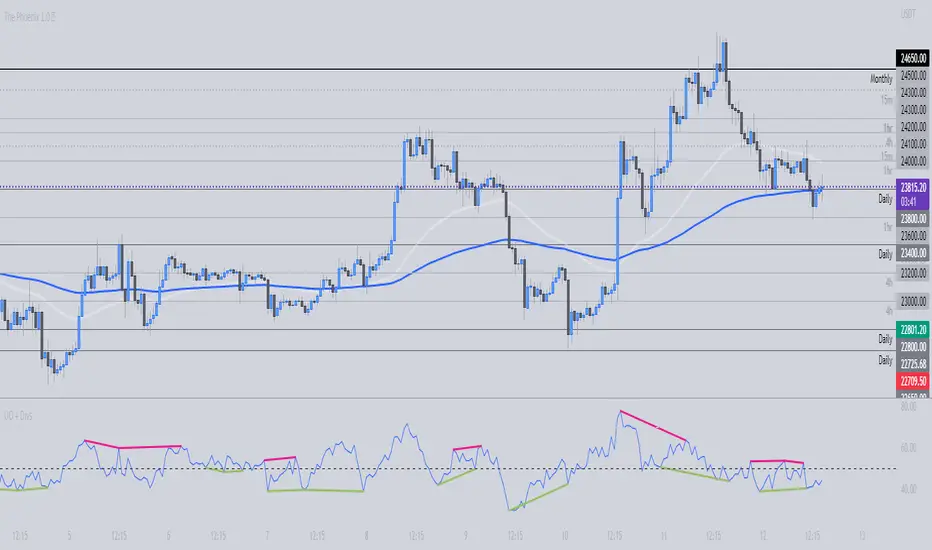
[_ParkF]cRSIHi, it's been a while since I posted a script.
This script basically puts the principle of convergence and divergence first.
(The Bollinger Band on the main chart is for reference)
The cRSI will move within the range of 0-100 just like the normal RSI
Along with that, there is a Donchian channel that will be the main activity area of the cRSI
If you know the characteristics of the Bollinger Band, it might be easy to understand
Basically, it will have the Expansion - Bulge - Squeeze Cycle
I wanted to express the movement of the wave visually.
Donchian Channel can be viewed to check Expansion - Bulge - Squeeze.
The centerline of the Donchian Channel is important because it plays a key role in identifying trends, such as 50 of the cRSI.
Also, Bear and Bull Divergence has 3 different colors
The reason is that the Divergence measurement period values are different.
Bear Divergence will be marked with Yellow, Orange, Red Label, and Bull Divergence will be marked with Green, Blue and Purple Label Purple. There will be a longer period of diversity in the order listed order.
I hope it helps your trading.
--------------------------------------------------------------------------------------------------------------------------------------------------------------------------------------------------------------------------------------------------------------------
안녕하세요, 오랜만에 새로운 지표를 올립니다.
이 지표는 기본적으로 수렴과 발산을 가장 중요하게 생각한 것입니다.
(메인 차트에 있는 볼린저 밴드는 참고를 위한 것입니다.)
cRSI는 일반적 RSI와 마찬가지로 0-100의 범위 안에서 움직이겠지만
그와 함께 cRSI의 주 활도 범위가 될 돈치안 채널이 함께 존재해서
볼린저 밴드의 특성을 알고 있다면 이해하기 쉬울 수 있을 것 같은데
기본적으로 Expansion - Bulge - Squeeze의 사이클을 가질 것이고
그 파동에 따른 RSI의 움직을 시각적으로 표현해보고 싶어서 만들었습니다.
돈치안 채널은 Expansion - Bulge - Squeeze 를 확인하기 위해 존재한다고 보면 될 것이고
돈치안 채널의 중심선은 cRSI의 50의 위치와 같이 추세를 확인하는데 있어
중점적인 역할을 하기 때문에 유의깊게 보면 좋습니다.
또, 하락과 상승 다이버전스는 각각 3가지 종류이고 색이 다릅니다.
이뉴는 각각의 다이버전스의 측정 기간값을 다르게 했기 때문이며,
하락 다이버전스는 노랑, 주황, 빨강 라벨로 표시 될 것이고
상승 다이버전스는 초록, 파랑, 보라 라벨로 표시 되며,
나열한 순서대로 더 긴 기간값의 다이버전스가 라벨로 플롯됩니다.
트레이딩에 도움이 됐으면 좋겠습니다.

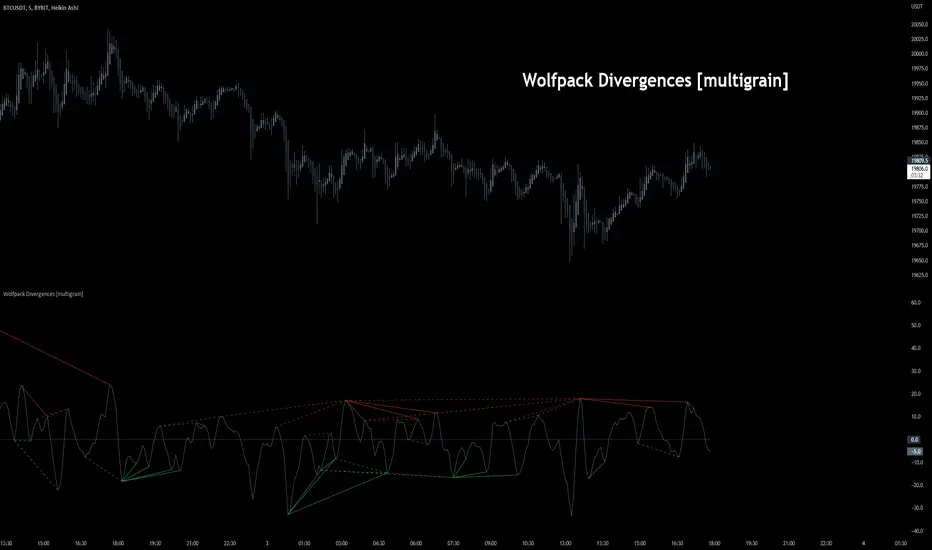
Wolfpack Divergences [multigrain]█ OVERVIEW
A fast and improved divergence finding algorithm that aims to be better than the built-in TradingView divergence algorithm.
█ CONCEPTS
Wolfpack
Wolfpack is an oscillator made popular by darrellfischer1 all the way back in 2017. Since then the Wolfpack oscillator has been utilized by a number of notable strategy/indicator creators. At some point it was realized that the oscillator was simply the Moving Average Crossover Divergence oscillator with the fast and slow length of 3 and 8, respectively. The true significance and reasoning behind these lengths are unknown, however one may surmise that they are chosen due to their relevance as Fibonacci numbers.
Divergences
Divergence is when the price of an asset is moving in the opposite direction of a technical indicator, such as an oscillator, or is moving contrary to other data. Divergence warns that the current price trend may be weakening, and in some cases may lead to the price changing direction.
█ USAGE
Wolfpack
Similar to many other oscillators, when the Wolfpack oscillator reports a value above the zero-line, this indicates a bullish trend in the price. Subsequently, a value below the zero-line indicate a bearish trend in the price.
Divergences
Divergence in technical analysis may signal a major positive or negative price move. A positive divergence occurs when the price of an asset makes a new low while an indicator, such as money flow, starts to climb. Conversely, a negative divergence is when the price makes a new high but the indicator being analyzed makes a lower high.
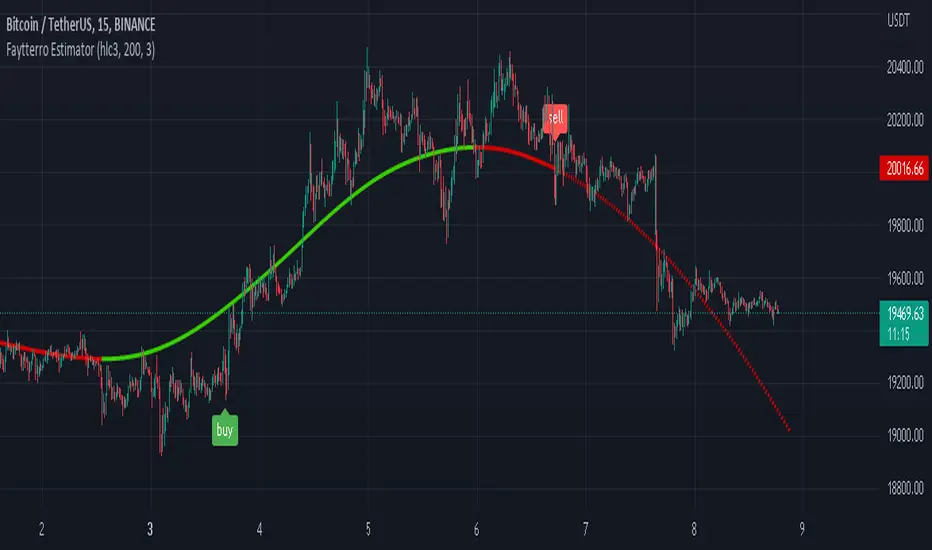
Faytterro EstimatorWhat is Faytterro Estimator?
This indicator is an advanced moving average.
What it does?
This indicator is both a moving average and at the same time, it predicts the future values that the price may take based on the values it has taken before.
How it does it?
takes the weighted average of data of the selected length (reducing the weight from the middle to the ends). then draws a parabola through the last three values, creating a predicted line.
How to use it?
it is simple to use. You can use it both as a regression to review past prices, and to predict the future value of a price. uptrends are in green and downtrends are in red. color change indicates a possible trend change.
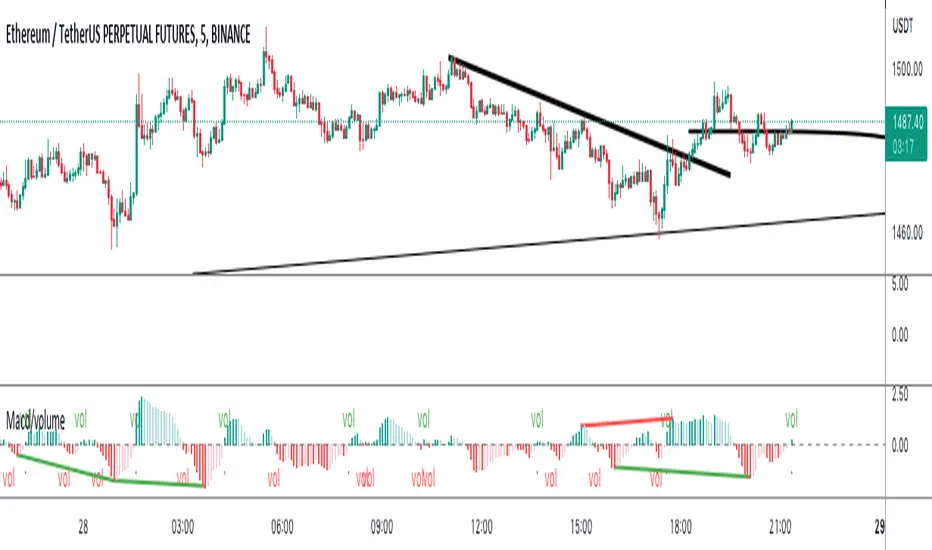
macd volume and divergence - papamallisIdicator the spots macd histogram divergence and filter macd signals based on volume percentage
MACD DivergencesUpdate of MACD indicator which shows the most recent, and developing, price action divergences with the histogram.

Price Convergence DivergenceSimple Price convergence divergence. Current close minus past or in other words lagging price.

Divergence MACD Sign/Alert [MsF]MACD divergence sign & alert notification.
With this router, you can choose which further indicators you want to see divergence in MACD.
In addition, in order to improve visibility, the sub-window is designed to display only the selected index and diversity.
Lookback Bars: When detecting divergence, you can set how many bars to look back in the past.
--------------
MACDダイバージェンスのサイン&アラートインジケータです。
このインジケータでは、MACDの中でさらにどの指標のダイバージェンスを見るか選択できます。"MACD"、"Signal"、"ヒストグラム"の3つから選べます。
なお、サブウィンドウには可視性向上のため、選択した指標とダイバージェンスのみを表示する仕様としています。
■設定について
Lookback Bars:ダイバージェンス検出する場合に、何個のバーを過去にさかのぼるか設定できます。

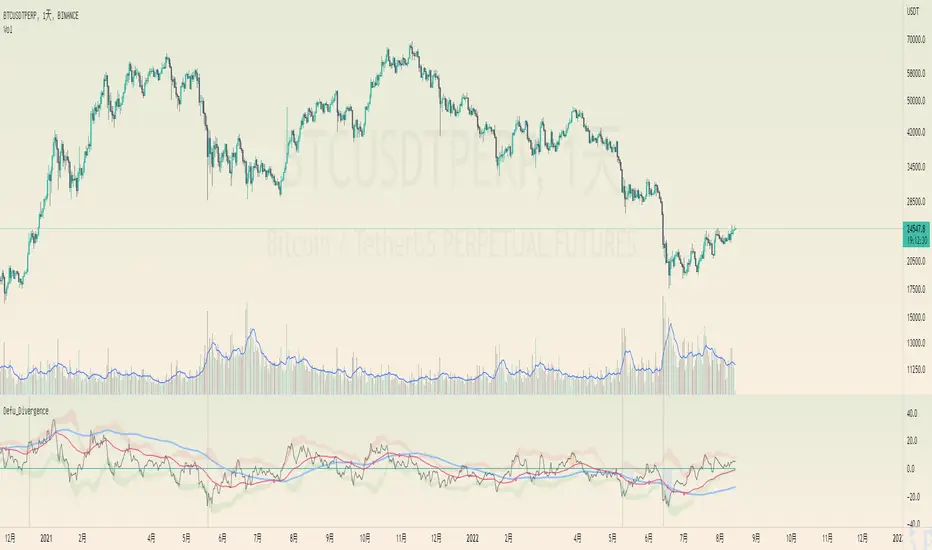
Defu_DivergenceThis is a composite indicator, a collection of multiple indicators
It includes the following:
1. the gray background has a huge trading volume ,
2. the market cost deviates, and the relationship between the closing price of the black line, the red line and the blue line and the short-term, medium-term and long-term average. Compare the difference after mutual subtraction.
3. blue orange column fund flow indicator MFI , color transparency indicates the value
4. the Bollinger belt signals with a short deviation rate, which is the Bollinger belt with a black line.
======================The above translation is from Google
这是一个复合指标,集合了多种指标
包括以下:
1.灰色背景成交量巨大,
2.市场成本乖离 ,黑色线、红色线、蓝色线收盘价与 短期 、中期、长期三条均线之间的关系。互减后比较差值。
3.蓝橙柱 资金流量指标MFI,颜色的透明度表示值的大小
4.布林带 以短期乖离率信号,就是黑色线的布林带。
TSI + DivergencesTrue Strength Indicator (TSI) + Divergences + Alerts + Lookback periods.
This version of the True Strength Indicator adds the following 3 additional features to the stock TSI by Tradingview:
- Optional divergence lines drawn directly onto the oscillator.
- Configurable alerts to notify you when divergences occur.
- Configurable lookback periods to fine tune the divergences drawn in order to suit different trading styles and timeframes.
This indicator adds additional features onto the stock TSI by Tradingview, whose core calculations remain unchanged. Namely the configurable option to automatically, quickly and clearly draw divergence lines onto the oscillator for you as they occur, with minimal delay. It also has the addition of unique alerts, so you can be notified when divergences occur without spending all day watching the charts. Furthermore, this version of the TSI comes with configurable lookback periods, which can be configured in order to adjust the sensitivity of the divergences, in order to suit shorter or higher timeframe trading approaches.
The True Strength Indicator
Tradingview describes the True Strength Indicator as follows:
“The True Strength Index (TSI) is a momentum oscillator that ranges between limits of -100 and +100 and has a base value of 0. Momentum is positive when the oscillator is positive (pointing to a bullish market bias) and vice versa. It was developed by William Blau and consists of 2 lines: the index line and an exponential moving average of the TSI, called the signal line. Traders may look for any of the following 5 types of conditions: overbought, oversold, centerline crossover, divergence and signal line crossover. The indicator is often used in combination with other signals..”
What are divergences?
Divergence is when the price of an asset is moving in the opposite direction of a technical indicator, such as an oscillator, or is moving contrary to other data. Divergence warns that the current price trend may be weakening, and in some cases may lead to the price changing direction.
There are 4 main types of divergence, which are split into 2 categories;
regular divergences and hidden divergences. Regular divergences indicate possible trend reversals, and hidden divergences indicate possible trend continuation.
Regular bullish divergence: An indication of a potential trend reversal, from the current downtrend, to an uptrend.
Regular bearish divergence: An indication of a potential trend reversal, from the current uptrend, to a downtrend.
Hidden bullish divergence: An indication of a potential uptrend continuation.
Hidden bearish divergence: An indication of a potential downtrend continuation.
Setting alerts.
With this indicator you can set alerts to notify you when any/all of the above types of divergences occur, on any chart timeframe you choose.
Configurable lookback values.
You can adjust the default lookback values to suit your prefered trading style and timeframe. If you like to trade a shorter time frame, lowering the default lookback values will make the divergences drawn more sensitive to short term price action.
How do traders use divergences in their trading?
A divergence is considered a leading indicator in technical analysis, meaning it has the ability to indicate a potential price move in the short term future.
Hidden bullish and hidden bearish divergences, which indicate a potential continuation of the current trend are sometimes considered a good place for traders to begin, since trend continuation occurs more frequently than reversals, or trend changes.
When trading regular bullish divergences and regular bearish divergences, which are indications of a trend reversal, the probability of it doing so may increase when these occur at a strong support or resistance level. A common mistake new traders make is to get into a regular divergence trade too early, assuming it will immediately reverse, but these can continue to form for some time before the trend eventually changes, by using forms of support or resistance as an added confluence, such as when price reaches a moving average, the success rate when trading these patterns may increase.
Typically, traders will manually draw lines across the swing highs and swing lows of both the price chart and the oscillator to see whether they appear to present a divergence, this indicator will draw them for you, quickly and clearly, and can notify you when they occur.
Disclaimer : This script includes code from the stock TSI by Tradingview as well as the RSI divergence indicator.

Ultimate Oscillator + DivergencesUltimate Oscillator (UO) + Divergences + Alerts + Lookback periods.
This version of the Ultimate Oscillator adds the following 3 additional features to the stock UO by Tradingview:
- Optional divergence lines drawn directly onto the oscillator.
- Configurable alerts to notify you when divergences occur.
- Configurable lookback periods to fine tune the divergences drawn in order to suit different trading styles and timeframes.
This indicator adds additional features onto the stock Ultimate Oscillator by Tradingview, whose core calculations remain unchanged. Namely the configurable option to automatically, quickly and clearly draw divergence lines onto the oscillator for you as they occur, with minimal delay. It also has the addition of unique alerts, so you can be notified when divergences occur without spending all day watching the charts. Furthermore, this version of the Ultimate Oscillator comes with configurable lookback periods, which can be configured in order to adjust the sensitivity of the divergences, in order to suit shorter or higher timeframe trading approaches.
The Ultimate Oscillator
Tradingview describes the Ultimate Oscillator as follows:
“The Ultimate Oscillator indicator (UO) indicator is a technical analysis tool used to measure momentum across three varying timeframes. The problem with many momentum oscillators is that after a rapid advance or decline in price, they can form false divergence trading signals. For example, after a rapid rise in price, a bearish divergence signal may present itself, however price continues to rise. The ultimate Oscillator attempts to correct this by using multiple timeframes in its calculation as opposed to just one timeframe which is what is used in most other momentum oscillators.”
More information on the history, use cases and calculations of the Ultimate Oscillator can be found here: www.tradingview.com
What are divergences?
Divergence is when the price of an asset is moving in the opposite direction of a technical indicator, such as an oscillator, or is moving contrary to other data. Divergence warns that the current price trend may be weakening, and in some cases may lead to the price changing direction.
There are 4 main types of divergence, which are split into 2 categories;
regular divergences and hidden divergences . Regular divergences indicate possible trend reversals, and hidden divergences indicate possible trend continuation.
Regular bullish divergence: An indication of a potential trend reversal, from the current downtrend, to an uptrend.
Regular bearish divergence: An indication of a potential trend reversal, from the current uptrend, to a downtrend.
Hidden bullish divergence: An indication of a potential uptrend continuation.
Hidden bearish divergence: An indication of a potential downtrend continuation.
Setting alerts.
With this indicator you can set alerts to notify you when any/all of the above types of divergences occur, on any chart timeframe you choose.
Configurable lookback values.
You can adjust the default lookback values to suit your prefered trading style and timeframe. If you like to trade a shorter time frame, lowering the default lookback values will make the divergences drawn more sensitive to short term price action.
How do traders use divergences in their trading?
A divergence is considered a leading indicator in technical analysis, meaning it has the ability to indicate a potential price move in the short term future.
Hidden bullish and hidden bearish divergences, which indicate a potential continuation of the current trend are sometimes considered a good place for traders to begin, since trend continuation occurs more frequently than reversals, or trend changes.
When trading regular bullish divergences and regular bearish divergences, which are indications of a trend reversal, the probability of it doing so may increase when these occur at a strong support or resistance level. A common mistake new traders make is to get into a regular divergence trade too early, assuming it will immediately reverse, but these can continue to form for some time before the trend eventually changes, by using forms of support or resistance as an added confluence, such as when price reaches a moving average, the success rate when trading these patterns may increase.
Typically, traders will manually draw lines across the swing highs and swing lows of both the price chart and the oscillator to see whether they appear to present a divergence, this indicator will draw them for you, quickly and clearly, and can notify you when they occur.
Disclaimer : This script includes code from the stock UO by Tradingview as well as the RSI divergence indicator.
Jurik Smoothed Stochastic - TraderHalaiJurik Smoothed Stochastic
The stochastic indicator has been long used by traders to identify inflection points in the price and to give a direction on Bullish and Bearish bias.
This indicator aims to improve on the plots the %K value smoothed using a Jurik Filter instead of a simple moving average. This allows for a more adaptive K value average price, whilst also providing superior smoothing to traditional moving averages.
As the Jurik Filter is a proprietary and non-open-source implementation, this script uses a common filters library implementation of Jurik MA which is a suitable proxy to the actual Jurik MA filter.
Big thanks to LastGuru for making his version freely available. You can find his version of the Jurik Filters in the credits section below.
%K is the Jurik Smoothed Version of the original Stochastic Formula
%D is calculated using the following formula. This idea was borrowed from John Ehler’s stochastic implementation and can be seen below:
%D = 0.05 + 0.95 * K
Features
%K line, Overbought and Oversold level and Mid Line Level
Oversold / Overbought reversal indicators and signals - Shown in Red and Green
Bullish / Bearish Divergences – Including Hidden divergences to spot reversals and continuations of trend (Big thanks to the developers of the built-in RSI Divergence indicator) - Shown as below:
Bullish / Bearish crossover of %K with %D - Shown in Cyan and Fuschia
Alerts for all of the above conditions
Double Jurik smoothing mode - similar to slow Stochastic
Credits :
Massive shoutout to the following scripts:
LastGuru JurikMA implementation (Common Filters Library)
Divergence Indicator – Built into TradingView and coded by TradingView Developers
This script is published as open source to allow for criticism, further development of this strategy and use by the community. Feel free to use this indicator/source code as you see fit.
Enjoy! :)

RSI Potential Divergence - FontiramisuIndicator showing potential momentum divergences on RSI Momentum.
The problem with the classic divergence is that when the signal appears, it is sometimes too late to enter a trade.
The potential divergence corrects this problem by signaling the beginning of a potential divergence.
RSI is a momentum indicator that offers relevant insights with divergences.
Potential divergences are indicated with the letter B and a red color for Bearish Div or Green color for Bullish Div .
Potential divergence is confirmed when the line and the label "Bear"' or "Bull" appear.

MA SLope Potential Divergence - FontiramisuIndicator showing potential momentum divergences on Moving Average's Slope.
The problem with the classic divergence is that when the signal appears, it is sometimes too late to enter a trade .
The potential divergence corrects this problem by signaling the beginning of a potential divergence .
Moving average slope is a momentum indicator that offers relevant insights with divergences
Potential divergences are indicated with the letter B and a red color for Bearish Div or Green color for Bullish Div .
Potential divergence is confirmed when the line and the label "Bear"' or "Bull" appear.
You can either show fast slope's divergences or slow slope's divergences or slow/fast diff's divergences.

RSI PacingThe RSI Pacing indicator compares the movement of the RSI directly with the movement of the asset to help identify divergences.
Bullish Divergences
The RSI is increasing at a greater rate than the pace of the asset.
The RSI is decreasing at a lesser rate than the pace of the asset.
Bearish Divergences
The RSI is decreasing at a greater rate than the pace of the asset.
The RSI is increasing at a lesser rate than the pace of the asset.
Warning: Does not yet work on higher timeframes yet. Working on getting the pace normalized to the RSI's bounds.

OBV with Volume/Momentum DivergenceCredits go to vyperphi696 and LazyBear for the original OBV with Divergence script.
This indicator has the new option to check for momentum divergence, which I have done by adding RSI and MACD data.
Hence the indicator allows combined testing of volume and momentum divergence. This feature aims to improve trend reversal detection by reducing false positives.
In summary, 3 divergence categories are shown by default as lines:
Volume + RSI + MACD (dark green/red)
Volume + RSI / Volume + MACD (light green/red)
Volume (gray)
Line colors can be adjusted via plot settings. Therefore it is also possible to distinguish Volume + RSI and Volume + MACD divergence if necessary.
Lastly, I edited the indicator scaling mechanism when changing from one timeframe to another; the transitions are smoother now. This only applies when auto-scaling is off.

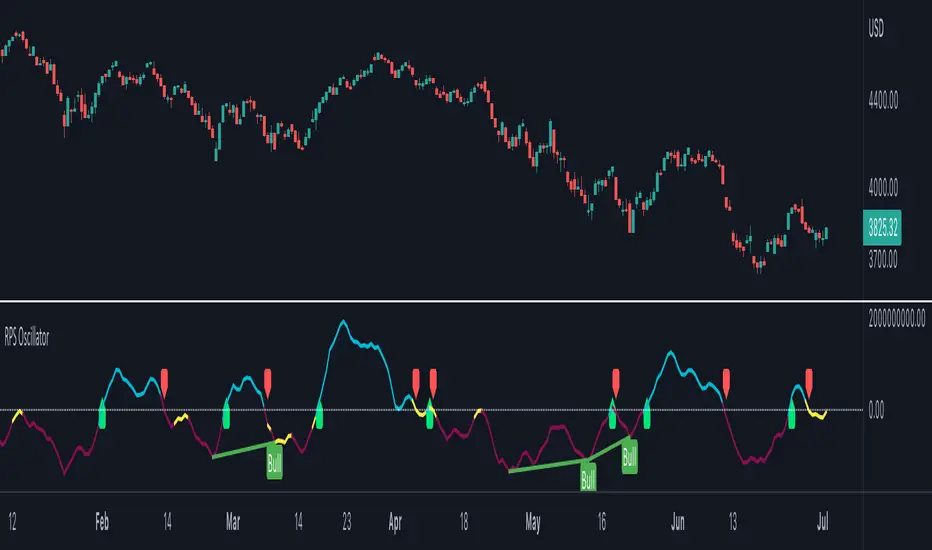
RPS OscillatorGood day to everyone!
How RPS Oscillator is different and useful while taking positions?
RPS Oscillator is a volume weighted oscillator which provides major buy/sell signals (Look for Green Up and Red Down Signals).
Users can enable to show leading (minor) buy/sell signals (Look for small Green/Red Circles). By default, it's disabled to avoid too many calls.
How to take trades using RPS Oscillator?
RPS Oscillator has a moving average with three colors.
Aqua - Uptrend
Yellow - Probable Trend Reversal or Major Volatile Move Coming
Red - Downtrend
How to find the strength of the trend using RPS Oscillator?
The uptrend is strong when you see the moving average in aqua color moving upwards.
The downtrend is strong when you see the moving average in red color moving downwards.
Avoid take any positions when the moving average is going sideways.
How to use the divergence in the RPS Oscillator?
The Bullish divergence gives the alert for the trend reversal to the upside.
The Bearish divergence gives the alert for the trend reversal to the downside.
The Hidden Bullish divergence gives the alert for the trend correction to the upside.
The Hidden Bearish divergence gives the alert for the trend correction to the downside.
How to get notified through RPS Oscillator without keeping eyes on the charts?
You can configure alerts for major happenings in the oscillator.
Major Long/Buy Signal
Major Short/Sell Signal
Bullish Divergence
Bearish Divergence
Hidden Bullish Divergence
Hidden Bearish Divergence
~RPS~
Pivot TrendLine with Divergence█ OVERVIEW
Automatically draws divergence trends on your charts.
█ CONCEPTS
Key features
• The script would find all pivot points using built-in functions.
• Then it would calculate the RSI/MACD level at those pivot bars.
• At last we're using RSI/MACD divergence as a filter to plot marks on your chart.
█ NOTICE
This script would REPAINT based on the pivot length settings. Indicators are just simple tools to demonstrate price trends, they can not predict trends.
Please keep that in mind.
Use at your own risk.
═════════════════════════════════════════════════════════════════════════
Feel free to leave comments below, this is still an experimental script.

Neo's Divergence FractalsDivergence Fractals combine divergence candlestick patterns with concepts pioneered by Bill Williams and George Lane to create a precise trend following tool that responds very well to the FX market. This indicator is built off of my Neo Fractal data set, which unlike traditional Williams fractals, track highest and lowest closes instead of higher highs and lower lows. Through my own research, I've found Neo Fractals to be a much more accurate way of pinpointing %K and RSI extremes than Williams fractals, especially in scenarios where markets make higher highs or lower lows, but fail to close higher or lower. This can lead to false divergence signals because the stochastic and RSI values aren't referenced at their highest or lowest point.
If divergence is detected between the previous close and the closest fractal above or below the close, the script then waits for a close above (bullish), or below (bearish) the close where divergence was present, at which point, an up (bullish) or down (bearish) fractal will appear on the chart. Divergence signals followed by engulfing candles are also colored, so they're easy to spot. These are the highest quality reversal or in some cases trend continuation signals! Divergence Fractals can be a great entry tool, but can also be great for managing and closing active trades as well. This indicator was designed to work in tandem with my %K as well as my proprietary Lucky7 indicator, mainly on the 1HR chart.

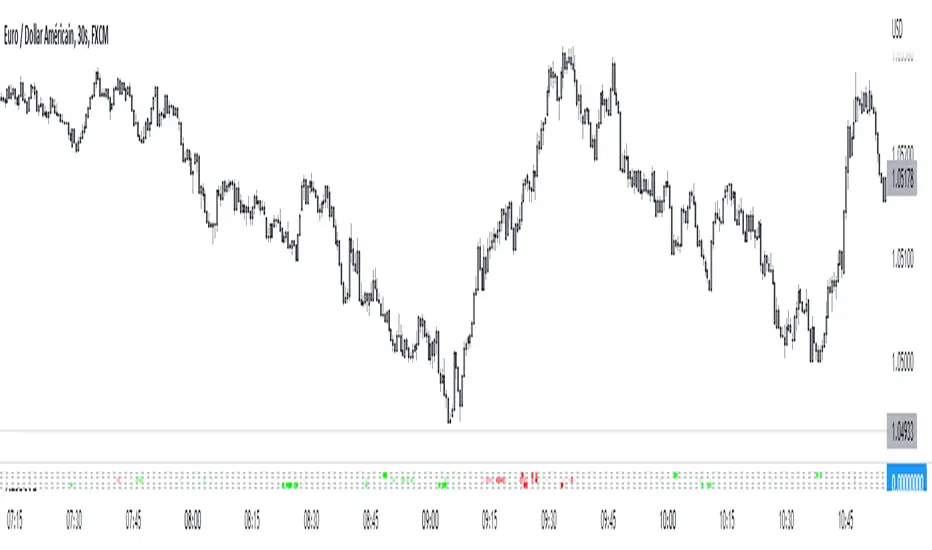
Reversal scoreDynamic divergence indicator on 3 indicators, without delays or repaints
Technological choices have been made so as not to lie to you about the signals, and so that the backtesting is perfectly faithful to reality. The market is analyzed and looks for a dynamic status of divergence on the Fisher transformation, the Money Flow Index and the MACD: if the status is "divergence", it is quantified by a divergence score to assess its potential and whose parameters are multiple (including market structure during divergence status).
At the top Reversal score, at the bottom the divergence indicator integrated in Tradingview. On this last candle, there will indeed be an RSI divergence but which will only be displayed 5 candles later, where ASTRE displays it to you in real time:
You will notice how certain spikes trigger sharp divergence – an anomaly between the movement of the price and that of the indicators is a good sign of an instant reversal, and in m2, a way to take a 2:1 TP in seconds:
Usage tip: Follow the signals in the direction of the main trend! They are much less numerous but very effective! :
Realtime Divergence for Any IndicatorThis indicator is an addon to any oscillating indicator. It shows divergences. It shows realtime divergences too. Realtime divergences are potential divergences because the actual pivot is not fully formed.
It shows:
Regular Bullish Divergences
Hidden Bullish Divergences
Regular Bearish Divergences
Hidden Bearish Divergences
Reatime divergence lines are dashed lines while non-reatime are solid.
This script also offers a fair bit of control over what you can accept as a legitimate divergence.
Also note that functions tend to not work properly in conditional and loop structures so I couldn't use a lot of functions and consequently my script is really big. Sorry.
