[SignalFI] H0dl2100K HA Trailer [V1]Welcome! It's my pleasure to bring a fully customized indicator based on @h0dl2100K's HA candle trading system. Through concerted efforts to bring automated trading systems from some of the best technical traders around, SignalFI provides the following features that were approved by @h0dl2100K:
Background
This system is based on the popular HA candle system and using several key levels and indicators of price action that can help identify entry, exit, and trailing stop levels for trading any asset (crypto, stocks, etc). The system is built to be used with HA candles, and provides the following key abilities:
1) HA Candle Doji Detector - HA candles are notorious for their ability to identify trend direction and changes in momentum. One of the easiest ways to identify these trend changes is when HA candles print "Doji candles" or candles that have long wicks on either side of the candle body. This signifies indecision in the market, and after a sustained up or down trend, usually marks a reversal in momentum. The Doji Detector will print label tags identifying potential bull or bear doji's which can be used as entry and exit signals or for identifying confluence with other indicators.
2) MTF Trail Lines - Using previous close levels for higher time frame candles is a cornerstone of trading fundamentals. Levels from the daily timeframe are respected on lower timeframes and can provide key levels to watch for entry or exit conditions to be "just right." The Trail lines are enabled by default and provide static levels on the chart in accordance with the following timeframes (4H, 12H, 1D, 3D, 1W). Both HIGH and LOW values for each timeframe are provided on the chart for easy of determining trailing stop levels or Take Profit levels depending on your trading system and confluence with other indicators.
3) EMA 50/200 - We've also included the notorious EMA trend lines that govern market sentiment from both short- and long-term investors (50 EMA, 200 EMA). These lines change color based on the price being above or below these levels and the levels can be fine-tuned within the settings to your EMA levels of choice.
4) MACD Crosses - We've also included signal tags where default MACD crosses occur to ensure that the trend direction is always presented on one graph. MACD crosses represent a significant sentiment score for trading all assets, and taken with the EMA trend, the HA candle trend, and the MTF Trail Levels can give a very consistent view of where price may be heading.
5) Alerts – It wouldn’t be a system unless we provided alerts to use for ease of notification of the data coming out of the script. For that reason, we have built-in alerts for both the MACD crosses and the Doji Detector. In addition, each Trail level be selected and alerted on to receive updates of when these key levels are crossed above or crossed below.
The H0dl2100K system is the result of years of market analysis and is mean to be a tool for guiding trading decisions in unison with or independently of other indicators. It works remarkably well with IchiEMA, AO and RSI PRIME as they all provide confluence to trading decisions, especially when using HA candles.
SignalFI was created to help traders and investors to effectively analyze the market based on the Golden Mean Ratio (Fibonacci numbers), plan a trade and ultimately execute it. To help inform and educate market decisions we developed a set of Trading Indicators which are available on TradingView.
SignalFI indicators are just that, indicators. Our indicators are generally configured to use completely historical data (negating repaint), and we advise all alerts created with SignalFI indicators to be fired upon "close" of the current candle. Our indicators can provide valuable context and visualization support when performing market analysis and executing buy and sell decisions. However. we are not financial experts, and all information presented on this site or our other media outlets are for educational purposes only.
Doji


Higher High Lower Low Strategy (With Source Code)This script finds pivot highs and pivot lows then calculates higher highs & lower lows. And also it calculates support/resistance by using HH-HL-LL-LH points.
Generally HH and HL shows up-trend, LL and LH shows down-trend.
If price breaks resistance levels it means the trend is up or if price breaks support level it means the trend is down, so the script changes bar color blue or black. if there is up-trend then bar color is blue, or if down-trend then bar color is black. also as you can see support and resistance levels change dynamically.
If you use smaller numbers for left/right bars then it will be more sensitive.
source code of :

S&R Zone SignalsThis indicator allows you to specify price zones in which to detect basic candlestick patterns.
In the example above, I have specified the most immediate support and resistance zones on GBP/USD and set the script to detect engulfing candles. If a bearish engulfing candle occurs within the resistance zone a signal will be generated; likewise for bullish engulfing candles within the support zone .
The purpose of this indicator is to generate trading alerts when these patterns occur in order to reduce the screen-time required to monitor setups. This indicator is intended for structure traders primarily, although it could be used by anyone who uses zones and candlestick patterns to enter trades.
If you leave either zone set to 0 then that zone will not be used, meaning that you can use this to detect both support and resistance signals, or only signals at support, or only signals at resistance.
Settings:
R1: First Resistance Price
R2: Second Resistance Price
S1: First Support Price
S2: Second Support Price
Draw Signals: Enable/Disable Visual Signals
How Far To Look Back: Used For Detecting Fractal Highs/Lows
Doji Size (in pips): This Changes the Size of Detected Doji Candles
Hammer Wick Size: This Changes the Size of Detected Hammers/Shooting Stars
Engulf Wick: If Enabled, Only Engulfing Candles That Engulf the Wick Will Be Valid
Show Engulfing Candles: Enable/Disable Visual Signals For Engulfing Candles
Show Doji Candles: Enable/Disable Visual Signals For Doji Candles
Show Hammer Candles: Enable/Disable Visual Signals For Hammer/Shooting Star Candles
Source Code:
Go to zenandtheartoftrading.com for the source code – it’s free!

PivotBoss TriggersI have collected the four PivotBoss indicators into one big indicator. Eventually I will delete the individual ones, since you can just turn off the ones you don't need in the style controller. Cheers.
Wick Reversal
When the market has been trending lower then suddenly forms a reversal wick candlestick , the likelihood of
a reversal increases since buyers have finally begun to overwhelm the sellers. Selling pressure rules the decline,
but responsive buyers entered the market due to perceived undervaluation. For the reversal wick to open near the
high of the candle, sell off sharply intra-bar, and then rally back toward the open of the candle is bullish , as it
signifies that the bears no longer have control since they were not able to extend the decline of the candle, or the
trend. Instead, the bulls were able to rally price from the lows of the candle and close the bar near the top of its
range, which is bullish - at least for one bar, which hadn't been the case during the bearish trend.
Essentially, when a reversal wick forms at the extreme of a trend, the market is telling you that the trend
either has stalled or is on the verge of a reversal. Remember, the market auctions higher in search of sellers, and
lower in search of buyers. When the market over-extends itself in search of market participants, it will find itself
out of value, which means responsive market participants will look to enter the market to push price back toward
an area of perceived value. This will help price find a value area for two-sided trade to take place. When the
market finds itself too far out of value, responsive market participants will sometimes enter the market with
force, which aggressively pushes price in the opposite direction, essentially forming reversal wick candlesticks .
This pattern is perhaps the most telling and common reversal setup, but requires steadfast confirmation in order
to capitalize on its power. Understanding the psychology behind these formations and learning to identify them
quickly will allow you to enter positions well ahead of the crowd, especially if you've spotted these patterns at
potentially overvalued or undervalued areas.
Fade (Extreme) Reversal
The extreme reversal setup is a clever pattern that capitalizes on the ongoing psychological patterns of
investors, traders, and institutions. Basically, the setup looks for an extreme pattern of selling pressure and then
looks to fade this behavior to capture a bullish move higher (reverse for shorts). In essence, this setup is visually
pointing out oversold and overbought scenarios that forces responsive buyers and sellers to come out of the dark
and put their money to work-price has been over-extended and must be pushed back toward a fair area of value
so two-sided trade can take place.
This setup works because many normal investors, or casual traders, head for the exits once their trade
begins to move sharply against them. When this happens, price becomes extremely overbought or oversold,
creating value for responsive buyers and sellers. Therefore, savvy professionals will see that price is above or
below value and will seize the opportunity. When the scared money is selling, the smart money begins to buy, and
Vice versa.
Look at it this way, when the market sells off sharply in one giant candlestick , traders that were short
during the drop begin to cover their profitable positions by buying. Likewise, the traders that were on the
sidelines during the sell-off now see value in lower prices and begin to buy, thus doubling up on the buying
pressure. This helps to spark a sharp v-bottom reversal that pushes price in the opposite direction back toward
fair value.
Engulfing (Outside) Reversal
The power behind this pattern lies in the psychology behind the traders involved in this setup. If you have
ever participated in a breakout at support or resistance only to have the market reverse sharply against you, then
you are familiar with the market dynamics of this setup. What exactly is going on at these levels? To understand
this concept is to understand the outside reversal pattern. Basically, market participants are testing the waters
above resistance or below support to make sure there is no new business to be done at these levels. When no
initiative buyers or sellers participate in range extension, responsive participants have all the information they
need to reverse price back toward a new area of perceived value.
As you look at a bullish outside reversal pattern, you will notice that the current bar's low is lower than the
prior bar's low. Essentially, the market is testing the waters below recently established lows to see if a downside
follow-through will occur. When no additional selling pressure enters the market, the result is a flood of buying
pressure that causes a springboard effect, thereby shooting price above the prior bar's highs and creating the
beginning of a bullish advance.
If you recall the child on the trampoline for a moment, you'll realize that the child had to force the bounce
mat down before he could spring into the air. Also, remember Jennifer the cake baker? She initially pushed price
to $20 per cake, which sent a flood of orders into her shop. The flood of buying pressure eventually sent the price
of her cakes to $35 apiece. Basically, price had to test the $20 level before it could rise to $35.
Let's analyze the outside reversal setup in a different light for a moment. One of the reasons I like this setup
is because the two-bar pattern reduces into the wick reversal setup, which we covered earlier in the chapter. If
you are not familiar with candlestick reduction, the idea is simple. You are taking the price data over two or more
candlesticks and combining them to create a single candlestick . Therefore, you will be taking the open, high, low,
and close prices of the bars in question to create a single composite candlestick .
Doji Reversal
The doji candlestick is the epitome of indecision. The pattern illustrates a virtual stalemate between buyers
and sellers, which means the existing trend may be on the verge of a reversal. If buyers have been controlling a
bullish advance over a period of time, you will typically see full-bodied candlesticks that personify the bullish
nature of the move. However, if a doji candlestick suddenly appears, the indication is that buyers are suddenly
not as confident in upside price potential as they once were. This is clearly a point of indecision, as buyers are no
longer pushing price to higher valuation, and have allowed sellers to battle them to a draw-at least for this one
candlestick . This leads to profit taking, as buyers begin to sell their profitable long positions, which is heightened
by responsive sellers entering the market due to perceived overvaluation. This "double whammy" of selling
pressure essentially pushes price lower, as responsive sellers take control of the market and push price back
toward fair value.

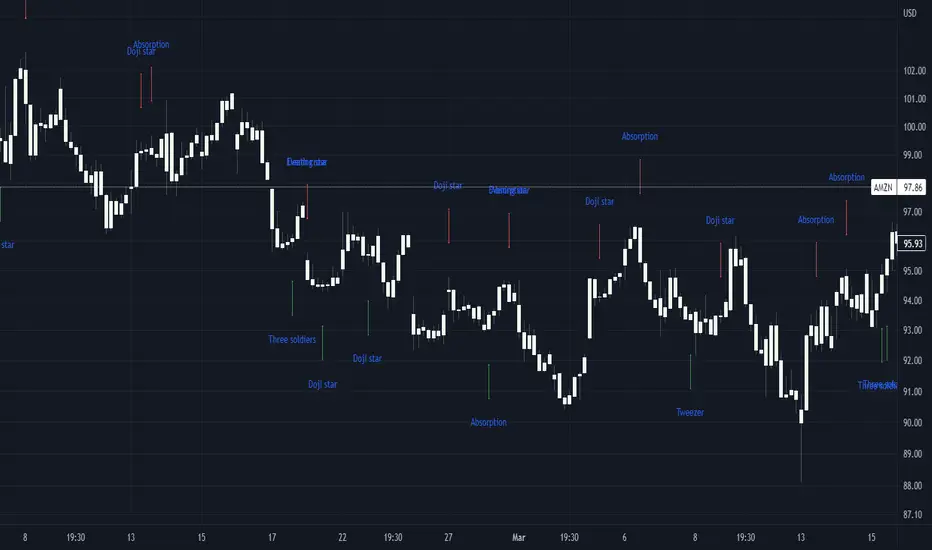
Basic candle patternsBasic candle patterns marker marks:
- Doji stars
- Doji graves
- Doji dragonflies
- Hammers
- Reversed hammers
- Hanging mans
- Falling stars
- Absorption up/down
- Tweezers up/down
- Three inside ups/downs
Doji & hammers markerDoji & hammers marker marks:
- long/ short doji star ( marks as doji star )
- doji grave
- doji dragonfly
- hammer
- falling star
- hanging man
- reversed hammer
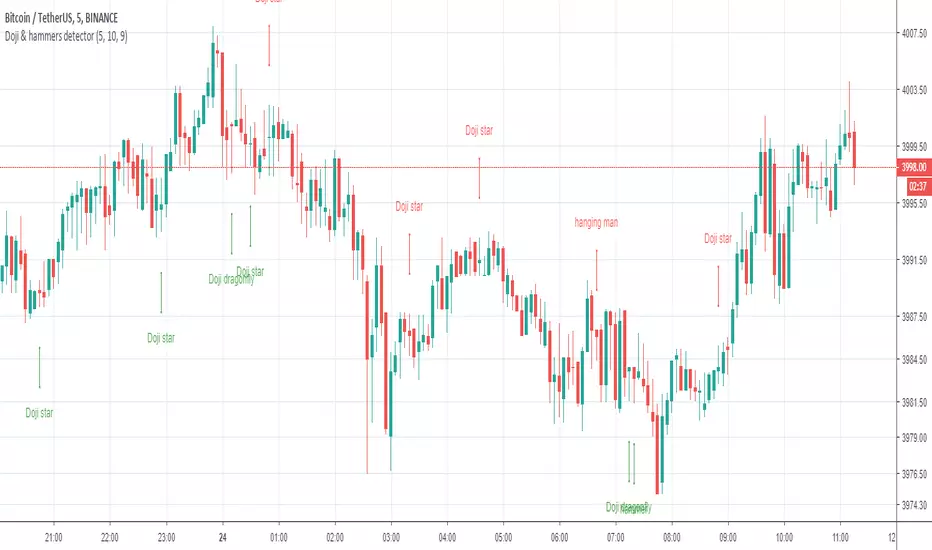
Doji detectorDoji detector marks doji candles.
Can find:
- short / long Doji star ( marks as Doji star )
- Doji grave
- Doji dragonfly

Volume/$ - Color Trend BarsThis is the volume script I use on all my charts. The idea is to emphasize trend bars with green and red.
Highish volume doji bars are colored yellow to point out range compression churn areas which can often be the turning point of a trend.

Candlestick identificationThis is a first draft of a candlestick pattern recognition study. As of now individual candles and some two-candle patterns can be identified. More to come ...
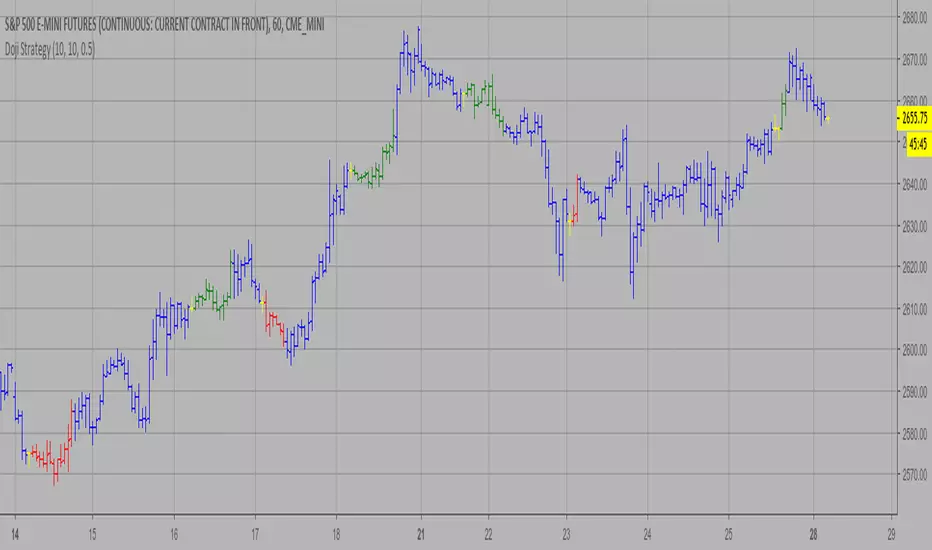
Doji Strategy This is a candlestick where the open and close are the same.
WARNING:
- This script to change bars colors.

Melak's All In One indicator(AIO)This script the following indicators.
Support and Resistance (lines)
MACD Crossover (Crossing arrow under each candle where MACD crosses)
50, 100, 200 Simple Moving Averages (orange lines)
10, 20 Exponential Moving Averages (turquoise and pink lines)
Doji reversals (turquoise candles)
Inside Bar (white diamonds under each inside bar candle)
TD time indicator (numbers on top of candles)

All indicators in one!All indicators in one!
Hull MA (2 colors) + Bollinger Bands + 6 EMA + 50 SMA + 200 SMA + Parabolic SAR + SUPER TREND (2 colors) + Doji signals (yellow)
Candlestick Patterns [DW]This is a simple study designed to track multiple candlestick patterns. Custom alerts included.

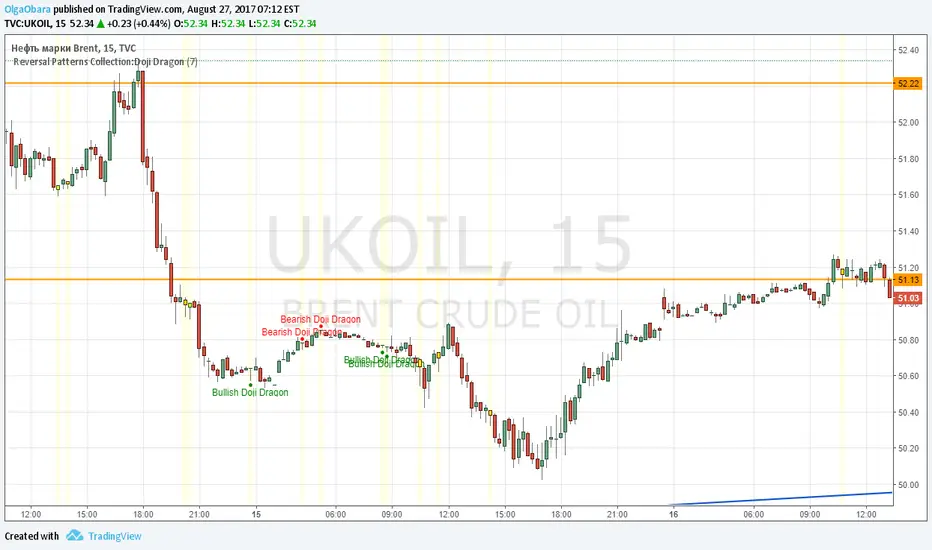
Reversal Patterns Collection:Doji Dragon Second script form my Reversal Patterns Collection contains special cases of Hammer and Handing Man named Doji Dragon. Script distinguishes bullish and bearish Doji Dragons. User can select period for candle size calculation (for distinguish short and long candles), on/off highlighting of pattern candles.
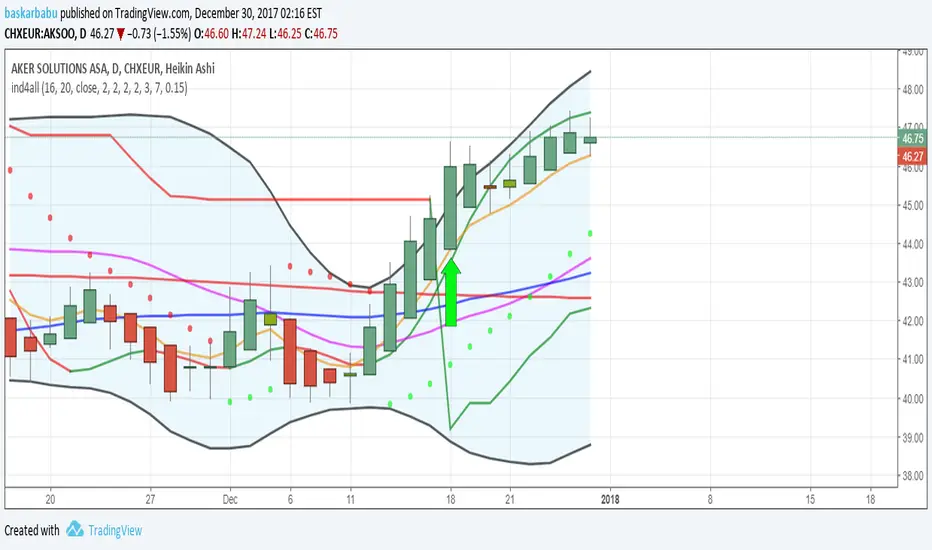
Price Action Doji Harami v0.2 by JustUncleLThis is an updated and final version of this indicator. This version distinguishes between the true Harami and the other Doji candlestick patterns as used with the Heikin Ashi candle charts. These candle patterns indicate a potential trend reversal or pullback.
The patterns identified are:
- Bearish Harami (Red Highlight above Bar):
One to three (default 3) large body Bull (green) candles followed by a small (red)
or no body candle (less than 0.5pip) with wicks top and bottom that are at least 60% of candle.
- Bullish Harami (Green Highlight below Bar):
One to three (default 3) large body Bear (red) candles followed by a small (green)
or no body candle (less than 0.5pip) with wicks top and bottom that are at least 60% of candle.
- Bearish Doji (Fuchsia Highlight above Bar):
One to three (default 3) large body Bull (green) candles followed by a small (green)
with wicks top and bottom that are at least 60% of candle.
- Bullish Doji (Aqua Highlight below Bar):
One to three (default 3) large body Bear (red) candles followed by a small (red)
with wicks top and bottom that are at least 60% of candle.
You can optionally specify how large the candles prior to Harami/Doji are in pips, default is 0 pip.
If you set this to zero then it will have no candle size consideration. You can also specify how many look back candles (1-3) are used in Harami/Doji calculations (default 3).
Included option to perform Calculations purely on Heikin Ashi candles, this helps when you want to see the HA Doji/Harami bars with the normal candle stick chart.
Also can optionally set an alert condition for when Harami/Doji found, this also displays a circle on the bottom of the screen when alert is triggered.

Doji signalsYou can create an alert based on this signal :)
Works on standard and Heikin-ashi candles
You can also adjust the sensitivity (how big you want the body of the doji)
:)

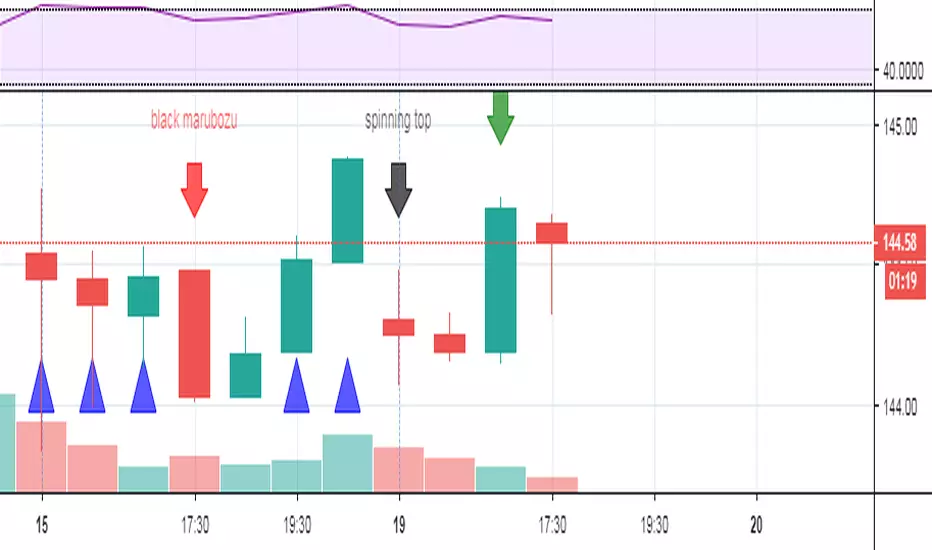
Spinning TopsThis is my script for a spinning top. It is just another form of a doji. It is an indecision bar. Enjoy.

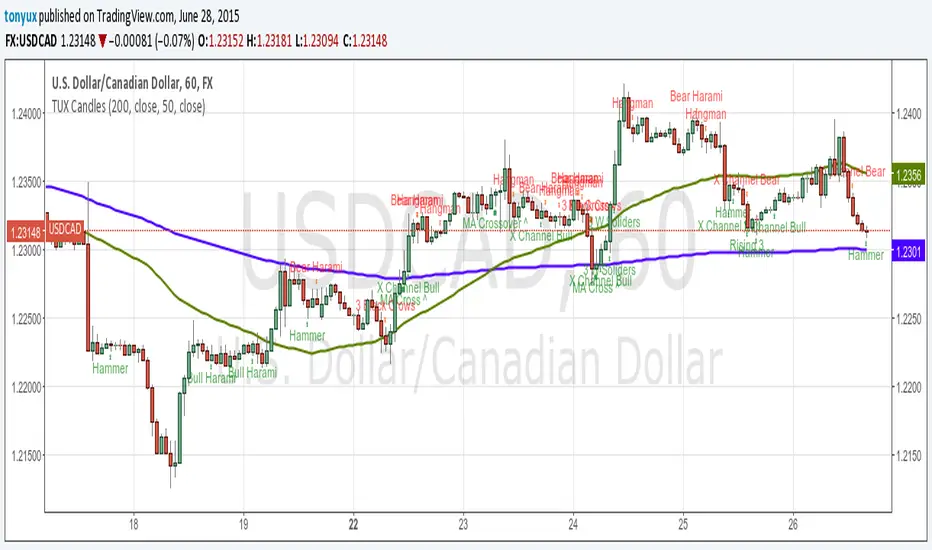
TUX CandlesThis indicator has a lot of information. This is the first version so stay tuned for updates, and please let me know of any bugs.
Candlestick Indicators:
Doji
Shooting Star
Evening Star
Hammer
Hanging Man
Candlestick Formations
Tri-star
Bearish Harami
Bullish Harami
Bearish Harami Cross
Bullish Harami Cross
Bullish Engulfing
Bearish Engulfing
Rising Three
Falling Three
Bearish Abandoned Baby
Bullish Abandoned Baby
Three Black Crows
Three White Soldiers
Technical Indicators:
(You can set you MA periods)
Moving Average Cross
Move Average Crossover
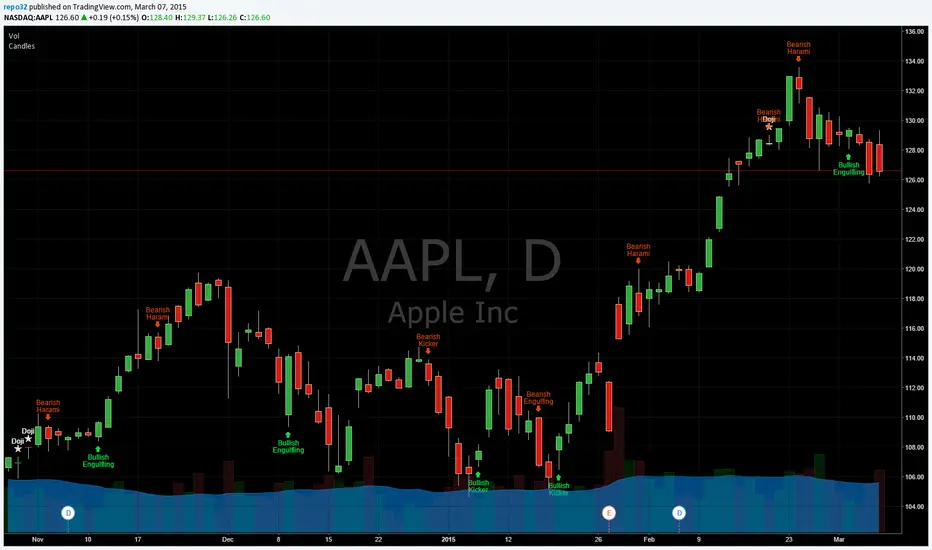
Candlestick Patterns Identified (updated 3/11/15)I decided to republish this one without the trend filter and with all the major symbols active. This will allow for all the patterns to show up.
Due to 15 different candlestick formations in this one script, it will be difficult to turn off the last few due to screen size. You can turn off individual patterns on the settings screen.
I have everything spelled out except the hammer and inverted hammer. They are "H" and "IH" respectively on the charts. They show up so often that they cluttered the charts.
The default script has: Doji, Evening Star, Morning Star, Shooting Star, Hammer, Inverted Hammer, Bearish Harami, Bullish Harami, Bearish Engulfing, Bullish Engulfing, Piercing Line, Bullish Belt, Bullish Kicker, Bearish Kicker, Hanging man, and Dark Cloud Cover. You can turn off what you don't like. The Piercing Line, Bullish Belt, and the Kickers will usually show up better in the daily charts.
I recommend watching videos with Stephen Bigalow to get a feel for how to trade these. You will want to add an 8 EMA to your chart with his setups. Enjoy.
If you want the old version: Take a look at the related ideas below.

Candlesticks Patterns IdentifiedI was using another script that colored the bars to show the different candle patterns. Thanks to HPotter (www.tradingview.com). Unfortunately, I can't think that fast when looking across a screen of charts with different color bars. Fortunately, Tradingview came up with symbols and names on 2/26/15. I decided to take my favorite symbols and attach them to a name. This makes it easier to see what is going on and where your entry would be if it confirms. Works beautifully for me. Decided to share. I also added the ability to alter what shows up based upon a look back. A bullish engulfing at the top of a trend, or a bearish harami at the bottom of the trend, is nearly useless and clutters the chart. I have the default set for the open of the current bar to be higher or lower than the open from 5 bars back. You can adjust in the settings to what you like. This trend setting is on all the patterns except doji. If you want to see all the candle patterns, set it to "1".
The doji can be adjusted as well. I left some other patterns at the bottom of the script, but they are turned off. They became too much of a clutter for me. I prefer DovCaspi's pattern finder for hammers and stars: I use his due to the clean appearance.
The default script has: Doji, Bearish Harami, Bullish Harami, Bearish Engulfing, Bullish Engulfing, Piercing Line, Bullish Belt, Bullish Kicker, and Bearish Kicker. You can turn off what you don't like. The Piercing Line, Bullish Belt, and the Kickers will usually show up better in the daily charts.
If you would like the updated version, see the Related Ideas below: