Extended Altman Z-Score ModelThe Extended Altman Z-Score Model represents a significant advancement in financial analysis and risk assessment, building upon the foundational work of Altman (1968) while incorporating contemporary data analytics approaches as proposed by Fung (2023). This sophisticated model enhances the traditional bankruptcy prediction framework by integrating additional financial metrics and modern analytical techniques, offering a more comprehensive approach to identifying financially distressed companies.
The model's architecture is built upon two distinct yet complementary scoring systems. The traditional Altman Z-Score components form the foundation, including Working Capital to Total Assets (X1), which measures a company's short-term liquidity and operational efficiency. Retained Earnings to Total Assets (X2) provides insight into the company's historical profitability and reinvestment capacity. EBIT to Total Assets (X3) evaluates operational efficiency and earning power, while Market Value of Equity to Total Liabilities (X4) assesses market perception and leverage. Sales to Total Assets (X5) measures asset utilization efficiency.
These traditional components are enhanced by extended metrics introduced by Fung (2023), which provide additional layers of financial analysis. The Cash Ratio (X6) offers insights into immediate liquidity and financial flexibility. Asset Composition (X7) evaluates the quality and efficiency of asset utilization, particularly in working capital management. The Debt Ratio (X8) provides a comprehensive view of financial leverage and long-term solvency, while the Net Profit Margin (X9) measures overall profitability and operational efficiency.
The scoring system employs a sophisticated formula that combines the traditional Z-Score with weighted additional metrics. The traditional Z-Score is calculated as 1.2X1 + 1.4X2 + 3.3X3 + 0.6X4 + 1.0X5, while the extended components are weighted as follows: 0.5 * X6 + 0.3 * X7 - 0.4 * X8 + 0.6 * X9. This enhanced scoring mechanism provides a more nuanced assessment of a company's financial health, incorporating both traditional bankruptcy prediction metrics and modern financial analysis approaches.
The model categorizes companies into three distinct risk zones, each with specific implications for financial stability and required actions. The Safe Zone (Score > 3.0) indicates strong financial health, with low probability of financial distress and suitability for conservative investment strategies. The Grey Zone (Score between 1.8 and 3.0) suggests moderate risk, requiring careful monitoring and additional fundamental analysis. The Danger Zone (Score < 1.8) signals high risk of financial distress, necessitating immediate attention and potential risk mitigation strategies.
In practical application, the model requires systematic and regular monitoring. Users should track the Extended Score on a quarterly basis, monitoring changes in individual components and comparing results with industry benchmarks. Component analysis should be conducted separately, identifying specific areas of concern and tracking trends in individual metrics. The model's effectiveness is significantly enhanced when used in conjunction with other financial metrics and when considering industry-specific factors and macroeconomic conditions.
The technical implementation in Pine Script v6 provides real-time calculations of both traditional and extended scores, offering visual representation of risk zones, detailed component breakdowns, and warning signals for critical values. The indicator automatically updates with new financial data and provides clear visual cues for different risk levels, making it accessible to both technical and fundamental analysts.
However, as noted by Fung (2023), the model has certain limitations that users should consider. It may not fully account for industry-specific factors, requires regular updates of financial data, and should be used in conjunction with other analysis tools. The model's effectiveness can be enhanced by incorporating industry-specific benchmarks and considering macroeconomic factors that may affect financial performance.
References:
Altman, E.I. (1968) 'Financial ratios, discriminant analysis and the prediction of corporate bankruptcy', The Journal of Finance, 23(4), pp. 589-609.
Li, L., Wang, B., Wu, Y. and Yang, Q., 2020. Identifying poorly performing listed firms using data analytics. Journal of Business Research, 109, pp.1–12. doi.org
Educational

Quarterly Theory ICT 05 [TradingFinder] Doubling Theory Signals🔵 Introduction
Doubling Theory is an advanced approach to price action and market structure analysis that uniquely combines time-based analysis with key Smart Money concepts such as SMT (Smart Money Technique), SSMT (Sequential SMT), Liquidity Sweep, and the Quarterly Theory ICT.
By leveraging fractal time structures and precisely identifying liquidity zones, this method aims to reveal institutional activity specifically smart money entry and exit points hidden within price movements.
At its core, the market is divided into two structural phases: Doubling 1 and Doubling 2. Each phase contains four quarters (Q1 through Q4), which follow the logic of the Quarterly Theory: Accumulation, Manipulation (Judas Swing), Distribution, and Continuation/Reversal.
These segments are anchored by the True Open, allowing for precise alignment with cyclical market behavior and providing a deeper structural interpretation of price action.
During Doubling 1, a Sequential SMT (SSMT) Divergence typically forms between two correlated assets. This time-structured divergence occurs between two swing points positioned in separate quarters (e.g., Q1 and Q2), where one asset breaks a significant low or high, while the second asset fails to confirm it. This lack of confirmation—especially when aligned with the Manipulation and Accumulation phases—often signals early smart money involvement.
Following this, the highest and lowest price points from Doubling 1 are designated as liquidity zones. As the market transitions into Doubling 2, it commonly returns to these zones in a calculated move known as a Liquidity Sweep—a sharp, engineered spike intended to trigger stop orders and pending positions. This sweep, often orchestrated by institutional players, facilitates entry into large positions with minimal slippage.
Bullish :
Bearish :
🔵 How to Use
Applying Doubling Theory requires a simultaneous understanding of temporal structure and inter-asset behavioral divergence. The method unfolds over two main phases—Doubling 1 and Doubling 2—each divided into four quarters (Q1 to Q4).
The first phase focuses on identifying a Sequential SMT (SSMT) divergence, which forms when two correlated assets (e.g., EURUSD and GBPUSD, or NQ and ES) react differently to key price levels across distinct quarters. For example, one asset may break a previous low while the other maintains structure. This misalignment—especially in Q2, the Manipulation phase—often indicates early smart money accumulation or distribution.
Once this divergence is observed, the extreme highs and lows of Doubling 1 are marked as liquidity zones. In Doubling 2, the market gravitates back toward these zones, executing a Liquidity Sweep.
This move is deliberate—designed to activate clustered stop-loss and pending orders and to exploit pockets of resting liquidity. These sweeps are typically driven by institutional forces looking to absorb liquidity and position themselves ahead of the next major price move.
The key to execution lies in the fact that, during the sweep in Doubling 2, a classic SMT divergence should also appear between the two assets. This indicates a weakening of the previous trend and adds an extra layer of confirmation.
🟣 Bullish Doubling Theory
In the bullish scenario, Doubling 1 begins with a bullish SSMT divergence, where one asset forms a lower low while the other maintains its structure. This divergence signals weakening bearish momentum and possible smart money accumulation. In Doubling 2, the market returns to the previous low and sweeps the liquidity zone—breaking below it on one asset, while the second fails to confirm, forming a bullish SMT divergence.
f this move is followed by a bullish PSP and a clear market structure break (MSB), a long entry is triggered. The stop-loss is placed just below the swept liquidity zone, while the target is set in the premium zone, anticipating a move driven by institutional buyers.
🟣 Bearish Doubling Theory
The bearish scenario follows the same structure in reverse. In Doubling 1, a bearish SSMT divergence occurs when one asset prints a higher high while the other fails to do so. This suggests distribution and weakening buying pressure. Then, in Doubling 2, the market returns to the previous high and executes a liquidity sweep, targeting trapped buyers.
A bearish SMT divergence appears, confirming the move, followed by a bearish PSP on the lower timeframe. A short position is initiated after a confirmed MSB, with the stop-loss placed
🔵 Settings
⚙️ Logical Settings
Quarterly Cycles Type : Select the time segmentation method for SMT analysis.
Available modes include : Yearly, Monthly, Weekly, Daily, 90 Minute, and Micro.
These define how the indicator divides market time into Q1–Q4 cycles.
Symbol : Choose the secondary asset to compare with the main chart asset (e.g., XAUUSD, US100, GBPUSD).
Pivot Period : Sets the sensitivity of the pivot detection algorithm. A smaller value increases responsiveness to price swings.
Pivot Sync Threshold : The maximum allowed difference (in bars) between pivots of the two assets for them to be compared.
Validity Pivot Length : Defines the time window (in bars) during which a divergence remains valid before it's considered outdated.
🎨 Display Settings
Show Cycle :Toggles the visual display of the current Quarter (Q1 to Q4) based on the selected time segmentation
Show Cycle Label : Shows the name (e.g., "Q2") of each detected Quarter on the chart.
Show Labels : Displays dynamic labels (e.g., “Q2”, “Bullish SMT”, “Sweep”) at relevant points.
Show Lines : Draws connection lines between key pivot or divergence points.
Color Settings : Allows customization of colors for bullish and bearish elements (lines, labels, and shapes)
🔔 Alert Settings
Alert Name : Custom name for the alert messages (used in TradingView’s alert system).
Message Frequenc y:
All : Every signal triggers an alert.
Once Per Bar : Alerts once per bar regardless of how many signals occur.
Per Bar Close : Only triggers when the bar closes and the signal still exists.
Time Zone Display : Choose the time zone in which alert timestamps are displayed (e.g., UTC).
Bullish SMT Divergence Alert : Enable/disable alerts specifically for bullish signals.
Bearish SMT Divergence Alert : Enable/disable alerts specifically for bearish signals
🔵 Conclusion
Doubling Theory is a powerful and structured framework within the realm of Smart Money Concepts and ICT methodology, enabling traders to detect high-probability reversal points with precision. By integrating SSMT, SMT, Liquidity Sweeps, and the Quarterly Theory into a unified system, this approach shifts the focus from reactive trading to anticipatory analysis—anchored in time, structure, and liquidity.
What makes Doubling Theory stand out is its logical synergy of time cycles, behavioral divergence, liquidity targeting, and institutional confirmation. In both bullish and bearish scenarios, it provides clearly defined entry and exit strategies, allowing traders to engage the market with confidence, controlled risk, and deeper insight into the mechanics of price manipulation and smart money footprints.

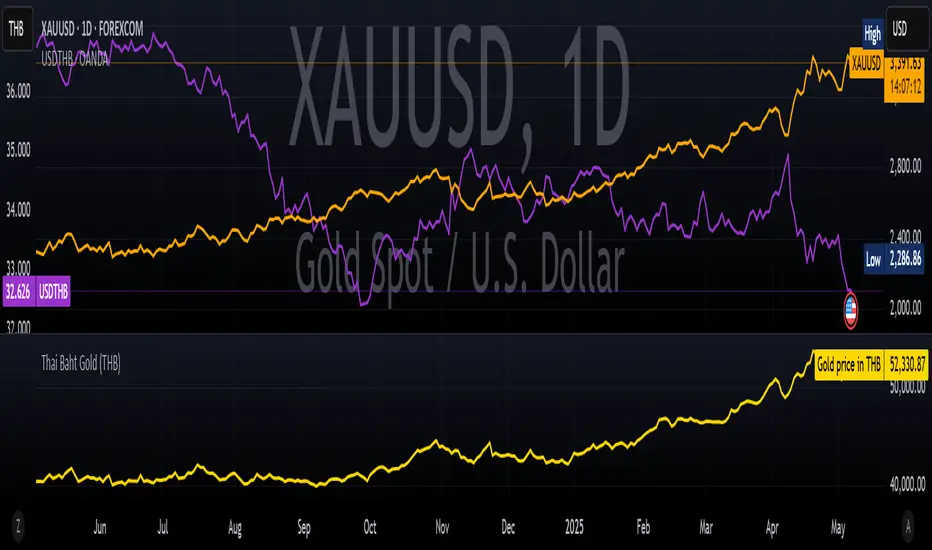
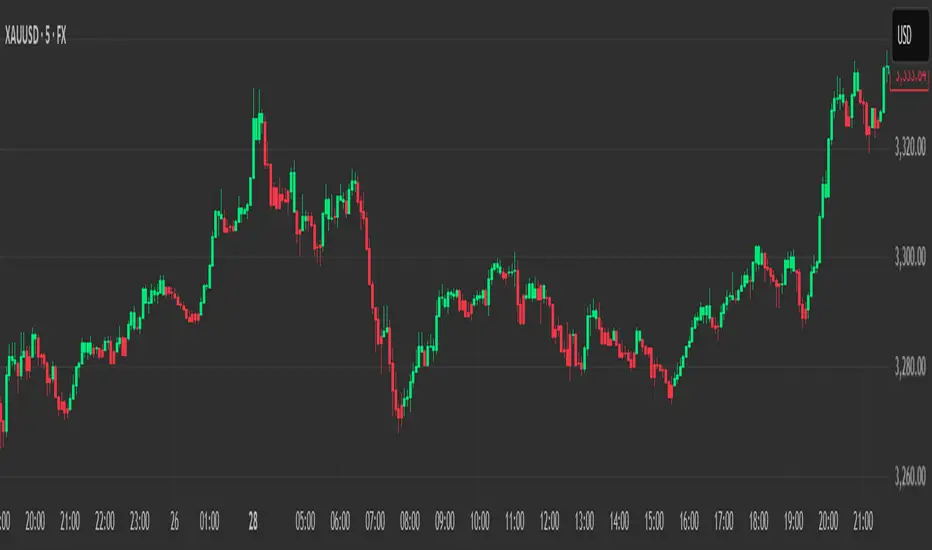
Thai Gold BahtIndicator Name: Thai Gold Baht
Short Title: Thai Gold Baht
Purpose
This indicator calculates and visualizes the real-time price of 1 Thai Gold Baht (15.244 grams) based on the global gold price ( XAU/USD ) and the USD/THB exchange rate .
Users can customize gold weight and purity to simulate the local Thai gold market price.
What it does
Retrieves live gold price per troy ounce in USD
Retrieves current USD to Thai Baht exchange rate
Converts the value using user-defined weight and purity
Displays result as a real-time chart
Shows calculation details in the Data Window
Ideal for
Traders tracking Thai gold based on international prices
Analysts comparing local and global bullion markets
Anyone needing a configurable, transparent gold price conversion
Pine Script Functionality
// Uses XAU/USD and USD/THB as inputs
// Calculates 1 Baht Gold (96.5% default purity)
// Outputs the value in THB as a chart line
ชื่ออินดิเคเตอร์: Thai Gold Baht
ชื่อย่อ: Thai Gold Baht
วัตถุประสงค์
อินดิเคเตอร์นี้ใช้คำนวณและแสดงราคาทองคำไทย 1 บาท (15.244 กรัม) แบบเรียลไทม์
โดยอ้างอิงจากราคาทองคำในตลาดโลก ( XAU/USD ) และอัตราแลกเปลี่ยน USD/THB
ผู้ใช้สามารถกำหนดน้ำหนักทองและความบริสุทธิ์เองได้ เพื่อจำลองราคาทองคำในประเทศไทยอย่างแม่นยำ
สิ่งที่อินดิเคเตอร์นี้ทำ
ดึงราคาทองคำแบบเรียลไทม์ต่อทรอยออนซ์ในสกุลเงิน USD
ดึงอัตราแลกเปลี่ยน USD → THB แบบเรียลไทม์
คำนวณราคาจากน้ำหนักและเปอร์เซ็นต์ความบริสุทธิ์ที่ผู้ใช้กำหนด
แสดงผลลัพธ์เป็นกราฟแบบเรียลไทม์ในหน่วยบาทไทย
แสดงรายละเอียดการคำนวณในหน้าต่าง Data Window ของ TradingView
เหมาะสำหรับ
นักเทรดที่ต้องการติดตามราคาทองคำไทยจากราคาทองคำตลาดโลก
นักวิเคราะห์ที่เปรียบเทียบราคาทองคำในประเทศและต่างประเทศ
ผู้ใช้งานที่ต้องการการแปลงราคาทองคำระหว่างประเทศให้โปร่งใสและปรับแต่งได้
การทำงานของ Pine Script
// ใช้ข้อมูล XAU/USD และ USD/THB เป็นอินพุต
// คำนวณราคาทองคำไทย 1 บาท (ความบริสุทธิ์เริ่มต้นที่ 96.5%)
// แสดงผลเป็นเส้นกราฟของราคาทองคำในหน่วยบาทไทย
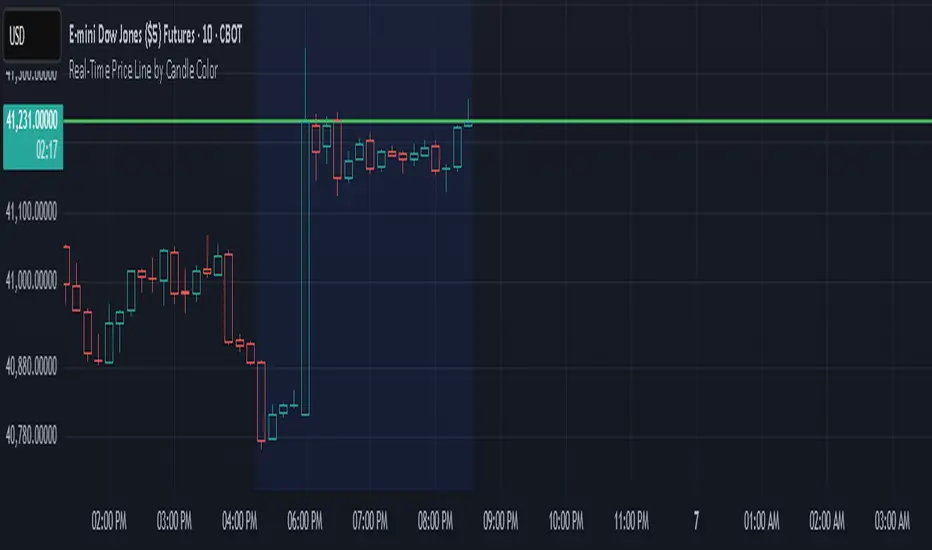
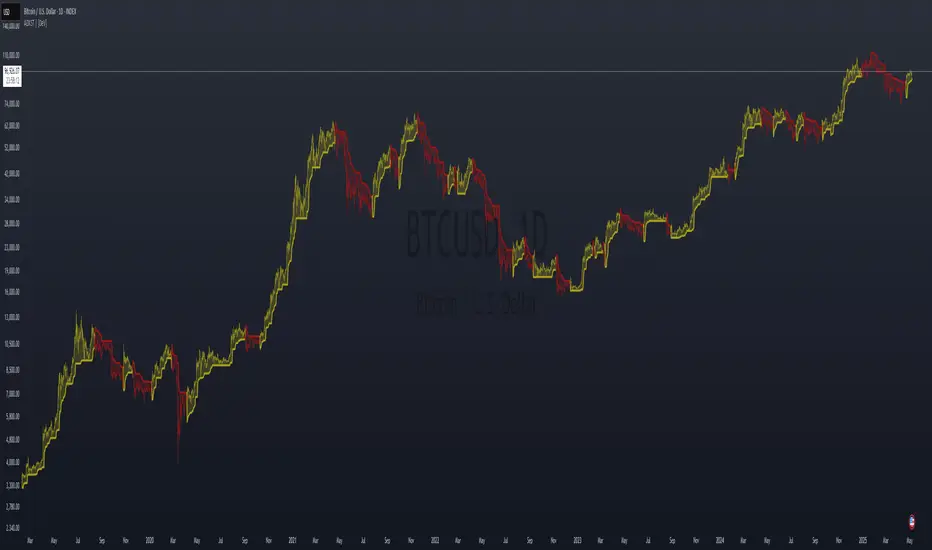
Real-Time Price Line by Candle ColorThis indicator draws a horizontal line at the current price that updates in real time on each candle. The line:
Extends infinitely left and right
Changes color based on the current candle:
🟢 Green if the candle is bullish (close ≥ open)
🔴 Red if the candle is bearish (close < open)
Automatically clears and redraws each bar to reflect the latest price and direction
Use this as a simple but effective visual aid to track the live price and its directional bias.
ADX Supertrend | [DeV]The "ADX Supertrend" indicator is a user-friendly tool that blends two popular trading indicators—the Supertrend and the Average Directional Index (ADX)—to help traders spot trends and make smarter trading decisions. By combining these two, it offers a clearer picture of when a market is trending strongly and in which direction, while cutting down on misleading signals. Here’s a straightforward explanation of how each part works, how they team up, the benefits of using them together, and why the ADX makes the Supertrend even better.
Supertrend:
It's like a guide that follows the market’s price movements to tell you whether prices are trending up or down. It creates two lines, one above and one below the price, based on how much the market is bouncing around (its volatility). When the price moves above the upper line, it signals an uptrend (a good time to buy), and the indicator draws a line below the price to show support. When the price drops below the lower line, it signals a downtrend (a potential time to sell), and the line appears above the price as resistance. The Supertrend is great because it adjusts to market conditions, widening the gap between lines in wild markets and tightening it in calm ones.
Average Directional Index:
The ADX is all about measuring how strong a trend is, without caring whether it’s going up or down. Think of it as a meter that tells you if the market is charging forward with purpose or just drifting aimlessly. It uses a scale from 0 to 100, where higher numbers mean a stronger trend. For example, an ADX above 25 often suggests a solid trend worth paying attention to, while a low ADX signals a sleepy, sideways market. The ADX also looks at whether buyers or sellers are in control to confirm the trend’s direction.
Confluence:
The Supertrend is great at spotting trends, but it can be a bit trigger-happy, giving signals in markets that aren’t really trending. That’s where the ADX shines. It acts like a quality control check, making sure the Supertrend’s signals only count when the market is moving with conviction. By filtering out weak or messy trends, the ADX helps you avoid wasting time on trades that fizzle out. It also double-checks the trend’s direction, so you’re not just guessing whether buyers or sellers are in charge. This teamwork means you get signals that are more reliable and less likely to lead you astray, especially in tricky markets where prices bounce around without a clear path.
Fibonacci ReRSI LevelsOverview
The Fibonacci RSI Levels indicator plots key Fibonacci-based RSI levels directly on the price chart, offering a unique perspective on market momentum, potential reversal points, and support/resistance zones. By combining the Relative Strength Index (RSI) with Fibonacci retracement levels, this indicator helps traders identify overbought/oversold conditions, trend strength, and critical price levels for potential trading opportunities.
Key Features
Fibonacci RSI Levels: Plots five key levels—23.6% (Oversold), 38.2% (Downtrend Limit), 50.0% (Mid Level), 61.8% (Uptrend Limit), and 78.6% (Overbought)—based on a logarithmic RSI calculation.
Customizable Settings: Adjust the RSI length, line extension, timeframe, and level colors to suit your trading style.
Gradient Fills: Optional gradient fills between levels provide a visual representation of the price's position relative to key zones.
Multi-Timeframe Support: Use the current chart resolution or specify a custom timeframe (e.g., 1M, 5D, 240 for 4 hours) for flexible analysis.
Logarithmic RSI Calculation: Ideal for assets with exponential price movements, such as cryptocurrencies.
How It Works
The indicator uses a reverse-engineered RSI calculation, inspired by Giorgos Siligardos' concept, to determine price levels corresponding to specific Fibonacci RSI values. These levels are plotted as horizontal lines on the chart, each with a label showing the Fibonacci percentage and the exact price level. If enabled, gradient fills between the levels change color based on the price's position, enhancing visual interpretation.
Usage
Support and Resistance: The 38.2% and 61.8% levels often act as support and resistance in trending markets.
Overbought/Oversold Conditions: The 23.6% and 78.6% levels can indicate potential reversal points due to oversold or overbought conditions.
Trend Confirmation: The 50% level serves as a neutral zone or pivot point. Prices above this level may indicate an uptrend, while prices below suggest a downtrend.
Gradient Fills: Use the gradient fills to quickly assess the price's position within the key zones, aiding in decision-making for entries, exits, or reversals.
Interpretation
Uptrend: When the price is above the 50% level and approaching the 61.8% level, it may signal a strong uptrend.
Downtrend: When the price is below the 50% level and nearing the 38.2% level, it may indicate a downtrend.
Reversal Zones: Watch for price reactions near the 23.6% and 78.6% levels, as these can be areas of potential reversals.
Customization
RSI Length: Adjust the RSI period to fine-tune the sensitivity of the levels.
Line Extension: Control how far the levels extend into the future for better visualization.
Timeframe: Choose between the current chart resolution or a custom timeframe for multi-timeframe analysis.
Colors: Customize the colors of each level and enable gradient fills for enhanced visual clarity.

PORTFOLIO TABLE Simple [Titans_Invest]PORTFOLIO TABLE Simple
This is a simple table for you to monitor your assets or cryptocurrencies in your SPOT wallet without needing to access your broker’s website or wallet app.
⯁ HOW TO USE THIS TABLE❓
You only need to select the asset and enter the amount of each one.
The table will show how much you have of each asset and the total value of your portfolio.
You’ll be able to monitor up to 39 assets in real time.
⯁ CONVERT VALUES
You can also activate and select a currency for conversion.
For example, cryptocurrency assets are calculated in US dollars, but you can select euros as the conversion currency.
The values originally in dollars will then be displayed in euros.
⯁ Track your Portfolio in real time:
⯁ Add your local Currency to Convert Values:
⯁ Follow your Portfolio Live:
___________________________________________________________
📜 SCRIPT : PORTFOLIO TABLE Simple
🎴 Art by : @Titans_Invest & @DiFlip
👨💻 Dev by : @Titans_Invest & @DiFlip
🎑 Titans Invest — The Wizards Without Gloves 🧤
✨ Enjoy!
___________________________________________________________
o Mission 🗺
• Inspire Traders to manifest Magic in the Market.
o Vision 𐓏
• To elevate collective Energy 𐓷𐓏

Modern Economic Eras DashboardOverview
This script provides a historical macroeconomic visualization of U.S. markets, highlighting long-term structural "eras" such as the Bretton Woods period, the inflationary 1970s, and the post-2020 "Age of Disorder." It overlays key economic indicators sourced from FRED (Federal Reserve Economic Data) and displays notable market crashes, all in a clean and rescaled format for easy comparison.
Data Sources & Indicators
All data is loaded monthly from official FRED series and rescaled to improve readability:
🔵 Real GDP (FRED:GDP): Total output of the U.S. economy.
🔴 Inflation Index (FRED:CPIAUCSL): Consumer price index as a proxy for inflation.
⚪ Debt to GDP (FRED:GFDGDPA188S): Federal debt as % of GDP.
🟣 Labor Force Participation (FRED:CIVPART): % of population in the labor force.
🟠 Oil Prices (FRED:DCOILWTICO): Monthly WTI crude oil prices.
🟡 10Y Real Yield (FRED:DFII10): Inflation-adjusted yield on 10-year Treasuries.
🔵 Symbol Price: Optionally overlays the charted asset’s price, rescaled.
Historical Crashes
The dashboard highlights 10 major U.S. market crashes, including 1929, 2000, and 2008, with labeled time spans for quick context.
Era Classification
Six macroeconomic eras based on Deutsche Bank’s Long-Term Asset Return Study (2020) are shaded with background color. Each era reflects dominant economic regimes—globalization, wars, monetary systems, inflationary cycles, and current geopolitical disorder.
Best Use Cases
✅ Long-term macro investors studying structural market behavior
✅ Educators and analysts explaining economic transitions
✅ Portfolio managers aligning strategy with macroeconomic phases
✅ Traders using history for cycle timing and risk assessment
Technical Notes
Designed for monthly timeframe, though it works on weekly.
Uses close price and standard request.security calls for consistency.
Max labels/lines configured for broader history (from 1860s to present).
All plotted series are rescaled manually for better visibility.
Originality
This indicator is original and not derived from built-in or boilerplate code. It combines multiple economic dimensions and market history into one interactive chart, helping users frame today's markets in a broader structural context.

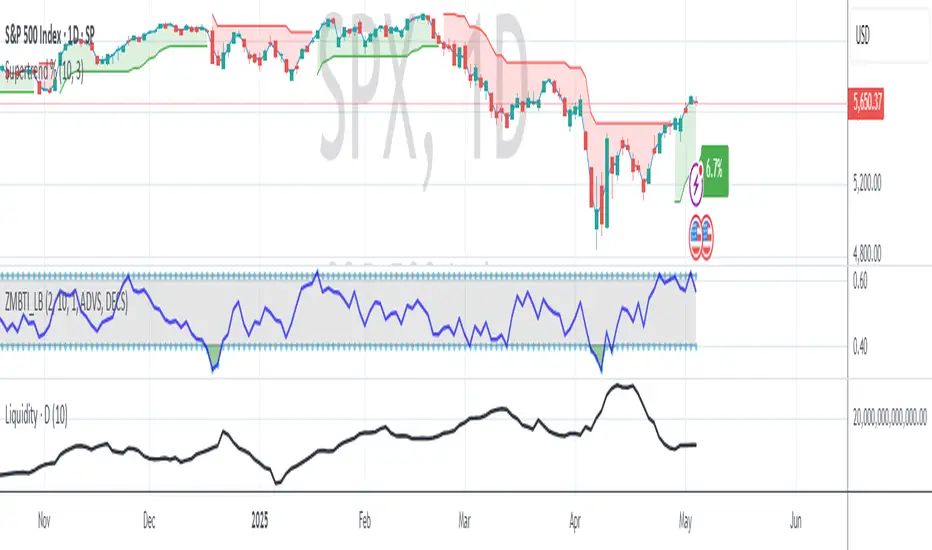
Credit Spread Monitor: HY & IG vs US10Y📉 Credit Spread Monitor: HY & IG vs US10Y
This indicator provides a dynamic and visual way to monitor credit spreads relative to the US Treasury benchmark. By comparing High Yield (HY) and Investment Grade (IG) corporate bond yields to the 10-Year US Treasury Yield (US10Y), it helps assess market stress, investor risk appetite, and potential macro turning points.
🔍 What It Does
-Calculates credit spreads:
HY Spread = BAMLH0A0HYM2EY − US10Y
IG Spread = BAMLC0A0CMEY − US10Y
-Detects macro risk regimes using statistical thresholds and yield curve signals:
🔴 HY Spread > +2σ → Potential financial stress
🟠 Inverted Yield Curve + HY Spread > 2% → Recession risk
🟢 HY Spread < 1.5% → Risk-on environment
-Visually highlights conditions with intuitive background colors for fast decision-making.
📊 Data Sources Explained
🔴 High Yield (HY): BAMLH0A0HYM2EY → ICE BofA US High Yield Index Effective Yield
🔵 Investment Grade (IG): BAMLC0A0CMEY → ICE BofA US Corporate Index Effective Yield
⚪ Treasury 10Y: US10Y → 10-Year US Treasury Yield
⚪ Treasury 2Y: US02Y → 2-Year US Treasury Yield (used to detect curve inversion)
✅ This Indicator Is Ideal For:
Macro traders looking to anticipate economic inflection points
Portfolio managers monitoring systemic risk or credit cycles
Fixed-income analysts tracking the cost of corporate borrowing
ETF/Asset allocators identifying shifts between risk-on and risk-off environments
🧠 Why It's Useful
This script helps visualize how tight or loose credit conditions are relative to government benchmarks. Since HY spreads typically widen before major downturns, this tool can provide early warning signals. Similarly, compressed spreads may indicate overheating or complacency in risk markets.
🛠️ Practical Use Case:
You’re managing a multi-asset portfolio. The HY spread jumps above +2σ while the yield curve remains inverted. You decide to reduce exposure to equities and high-yield bonds and rotate into cash or Treasuries as recession risk rises.
📎 Additional Notes
Sourced from FRED (Federal Reserve Economic Data) and TradingView’s bond feeds.
Designed to work best on daily resolution, using open prices to ensure consistency across series with different update timings.
This script is original, not based on built-in or public templates, and intended to offer educational, statistical, and visual insights for serious market participants.

FA Dashboard: Valuation, Profitability & SolvencyFundamental Analysis Dashboard: A Multi-Dimensional View of Company Quality
This script presents a structured and customizable dashboard for evaluating a company’s fundamentals across three key dimensions: Valuation, Profitability, and Solvency & Liquidity.
Unlike basic fundamental overlays, this dashboard consolidates multiple financial indicators into visual tables that update dynamically and are grouped by category. Each ratio is compared against configurable thresholds, helping traders quickly assess whether a company meets certain value investing criteria. The tables use color-coded checkmarks and fail marks (✔️ / ❌) to visually signal pass/fail evaluations.
▶️ Key Features
Valuation Ratios:
Earnings Yield: EBIT / EV
EV / EBIT and EV / FCF: Enterprise value metrics for profitability
Price-to-Book, Free Cash Flow Yield, PEG Ratio
Profitability Ratios:
Return on Invested Capital (ROIC), ROE, Operating, Net & Gross Margins, Revenue Growth
Solvency & Liquidity Ratios:
Debt to Equity, Debt to EBITDA, Current Ratio, Quick Ratio, Altman Z-Score
Each of these metrics is calculated using request.financial() and can be viewed using either annual (FY) or quarterly (FQ) data, depending on user preference.
🧠 How to Use
Add the script to any stock chart.
Select your preferred data period (FY or FQ).
Adjust thresholds if desired to match your personal investing strategy.
Review the visual dashboard to see which metrics the company passes or fails.
💡 Why It’s Useful
This tool is ideal for traders or long-term investors looking to filter stocks using fundamental criteria. It draws inspiration from principles used by Benjamin Graham, Warren Buffett, and Joel Greenblatt, offering a fast and informative way to screen quality businesses.
This is not a repackaged built-in or autogenerated script. It’s a custom-built, interactive tool tailored for fundamental analysis using official financial data provided via Pine Script’s request.financial().

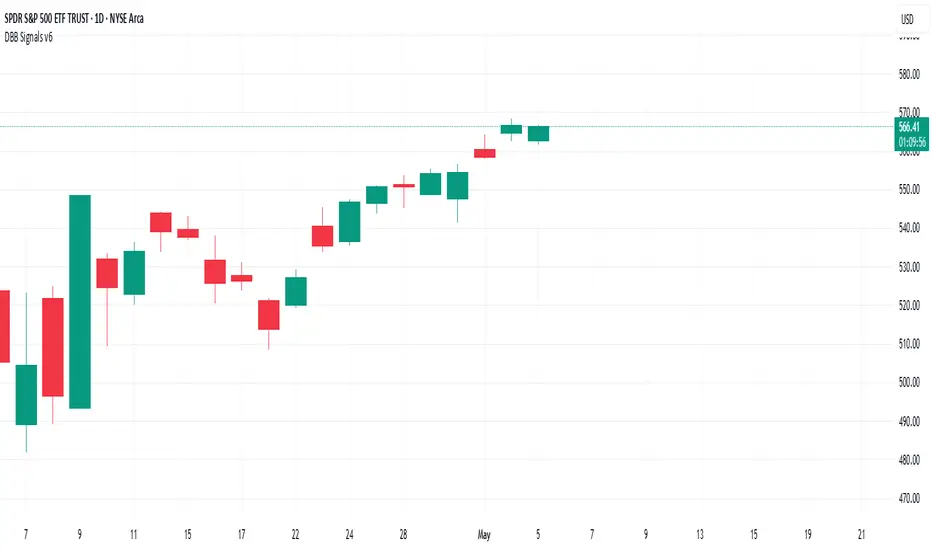
Darvas Box Breakout Signals v6 (Manus)Purpose:
This script is designed for TradingView to automatically identify potential "Darvas Boxes" on your price chart and signal when the price breaks out of these boxes.
How it Works:
Finds Highs: It looks back over a set number of bars (default is 20, but you can change this) to find the highest price point.
Confirms Box Top: It waits until the price stays below that high point for a specific number of bars (default is 3) to confirm the top of the box.
Confirms Box Bottom: After the top is confirmed, it looks for the lowest price reached and waits until the price stays above that low point for the same number of bars (3) to confirm the bottom of the box.
Draws Box (Optional): If enabled in the settings, it draws lines on the chart representing the top and bottom of the confirmed box.
What Signals It Shows:
Breakout Signal: When the price closes above the top line of a confirmed box, it plots a green upward-pointing triangle above that price bar. This suggests the stock might be starting a move higher.
Breakdown Signal: When the price closes below the bottom line of a confirmed box, it plots a red downward-pointing triangle below that price bar. This suggests the stock might be starting a move lower.
Key Features:
Uses the Darvas Box theory logic.
Provides clear visual signals for potential entries based on breakouts or breakdowns.
Allows customization of the lookback period and confirmation bars via the indicator settings.
Written in Pine Script version 6.
Remember, this script just provides signals based on price patterns; it doesn't predict the future or guarantee profits. It should be used as one tool within the larger trading plan we discussed, especially considering risk management.
WaveFunction MACD (TechnoBlooms)WaveFunction MACD — The Next Generation of Market Momentum
WaveFunction MACD is an advanced hybrid momentum indicator that merges:
• The classical MACD crossover logic (based on moving averages)
• Wave physics (modeled through phase energy and cosine functions)
• Hilbert Transform theory from signal processing
• The concept of a wavefunction from quantum mechanics, where price action is seen as a probabilistic energy wave—not just a trend.
✨ Key Features of WaveFunction MACD
• Wave Energy Logic : Instead of using just price and MA differences, this indicator computes phase-corrected momentum using the cosine of the wave phase angle — revealing the true energy behind market moves.
• Phase-Based Trend Detection : It reads cycle phases using Hilbert Transform-like logic, allowing you to spot momentum before it becomes visible in price.
• Ultra-Smooth Flow : The main line and histogram are built to follow price flow smoothly — eliminating much of the noise found in traditional MACD indicators.
• Signal Amplification via Energy Histogram : The histogram doesn’t just show momentum changes — it shows the intensity of wave energy, allowing you to confirm the strength of the trend.
• Physics-Driven Structure : The algorithm is rooted in real-world wave mechanics, bringing a scientific edge to trading — ideal for traders who believe in natural models like cycles and harmonics.
• Trend Confirmation & Early Reversals : It can confirm strong trends and also catch subtle shifts that often precede big reversals — giving you both reliability and anticipation.
• Ready for Fusion : Designed to work seamlessly with liquidity zones, price action, order blocks, and structure trading — a perfect fit for modern trading systems.
🧪 The Science Behind It
This tool blends:
• Hilbert Transform: Measures the phase of a waveform (price cycle) to detect turning points
• Cosine Phase Energy: Calculates true wave energy using the cosine of the phase angle, revealing the strength behind price movements
• Quantum Modeling: Views price like a wavefunction, offering predictive insight based on phase dynamics

SessionBarThis PineScript is designed to display various visual elements on a chart to help traders track session activity within the lower time frames, specifically for the USA main session. Here's a breakdown of the script's functionality:
Session Tracking
The script tracks the USA main session, defined as 9:30 AM to 4:00 PM ET, Monday through Friday.
Visual Elements
The script displays various visual elements, including:
1. Session Open and Close Lines: Lines marking the open and close of the USA main session.
2. Session High and Low Lines: Lines marking the high and low of the USA sessions.
3. Active Session Bar: A Realtime Candle as the current session bar.
4. Overnight Session Bar: A Realtime Candle as the overnight session bar.
5. Session Timer: A label displaying the time left until the next session.
6. Background Colors: Colors indicating different session periods, such as pre-market, post-market, and active session.
Customization
The script allows users to customize various aspects, including:
1. Session Time: Users can adjust the session time.
2. Colors: Users can choose colors for different visual elements.
3. Display Options: Users can toggle the display of various visual elements.
Overall, this script provides a educational tool for traders to track session activity and visualize key market data.

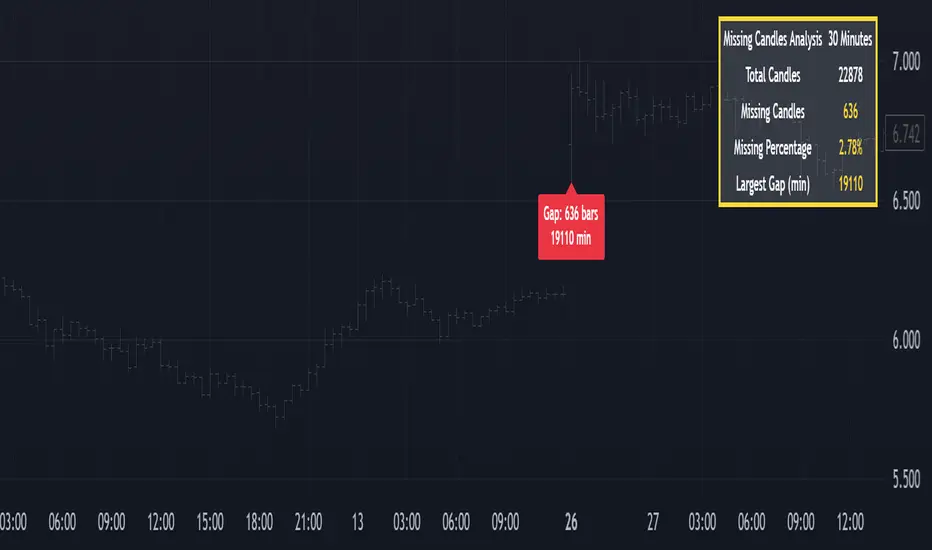
Missing Candle AnalyzerMissing Candle Analyzer: Purpose and Importance
Overview The Missing Candle Analyzer is a Pine Script tool developed to detect and analyze gaps in candlestick data, specifically for cryptocurrency trading. In cryptocurrency markets, it is not uncommon to observe missing candles—time periods where no price data is recorded. These gaps can occur due to low liquidity, exchange downtime, or data feed issues.
Purpose The primary purpose of this tool is to identify missing candles in a given timeframe and provide detailed statistics about these gaps. Missing candles can introduce significant errors in trading strategies, particularly those relying on continuous price data for technical analysis, backtesting, or automated trading. By detecting and quantifying these gaps, traders can: Assess the reliability of the price data. Adjust their strategies to account for incomplete data. Avoid potential miscalculations in indicators or trade signals that assume continuous candlestick data.
Why It Matters In cryptocurrency trading, where volatility is high and trading decisions are often made in real-time, missing candles can lead to: Inaccurate Technical Indicators : Indicators like moving averages, RSI, or MACD may produce misleading signals if candles are missing. Faulty Backtesting : Historical data with gaps can skew backtest results, leading to over-optimistic or unreliable strategy performance. Execution Errors : Automated trading systems may misinterpret gaps, resulting in unintended trades or missed opportunities.
By using the Missing Candle Analyzer, traders gain visibility into the integrity of their data, enabling them to make informed decisions and refine their strategies to handle such anomalies.
Functionality
The script performs the following tasks: Gap Detection : Identifies time gaps between candles that exceed the expected timeframe duration (with a configurable multiplier for tolerance). Statistics Calculation : Tracks total candles, missing candles, missing percentage, and the largest gap duration. Visualization : Displays a table with analysis results and optional markers on the chart to highlight gaps. User Customization : Allows users to adjust font size, table position, and whether to show gap markers.
Conclusion The Missing Candle Analyzer is a critical tool for cryptocurrency traders who need to ensure the accuracy and completeness of their price data. By highlighting missing candles and providing actionable insights, it helps traders mitigate risks and build more robust trading strategies. This tool is especially valuable in the volatile and often unpredictable cryptocurrency market, where data integrity can directly impact trading outcomes.
MC High/LowMC High/Low is a minimalist precision tool designed to show traders the most critical price levels — the High and Low of the current Day and Week — in real-time, without any visual clutter or historical trails.
It automatically tracks:
🔼 HOD – High of Day
🔽 LOD – Low of Day
📈 HOW – High of Week
📉 LOW – Low of Week
Each level is plotted using simple black horizontal lines, updated dynamically as the session evolves. Labels are clearly marked and positioned to the right of the screen for easy reference.
There’s no trailing history, no background colors, and no distractions — just pure price structure for clean confluence.
Perfect for:
Intraday scalpers
Swing traders
Liquidity & range traders
This is a tool built for sniper-level execution — straight from the MadCharts mindset.
🛠 Created by:
🔒 Version: Public Release
🎯 Use this with your favorite price action, liquidity, or market structure strategies.

Average Daily LiquidityIt is important to have sufficient daily trading value (liquidity) to ensure you can easily enter and, importantly, exit the trade. This indicator allows you to see if the traded value of a stock is adequate. The default average is 10 periods and it is common to average the daily traded value as both price and volume can have spikes causing trading errors. Some investors use a 5 period for a week, 10 period for 2 weeks, 20 or 21 period for 4 weeks/month and 65 periods for a quarter. You need to ascertain your buying amount such as $10000 and then have the average daily trading value be your comfortable moving average more such as average liquidity is more than 10 x MA(close x volume) or $100000 in this example. The value is extremely important for small and micro cap stocks you may wish to purchase.
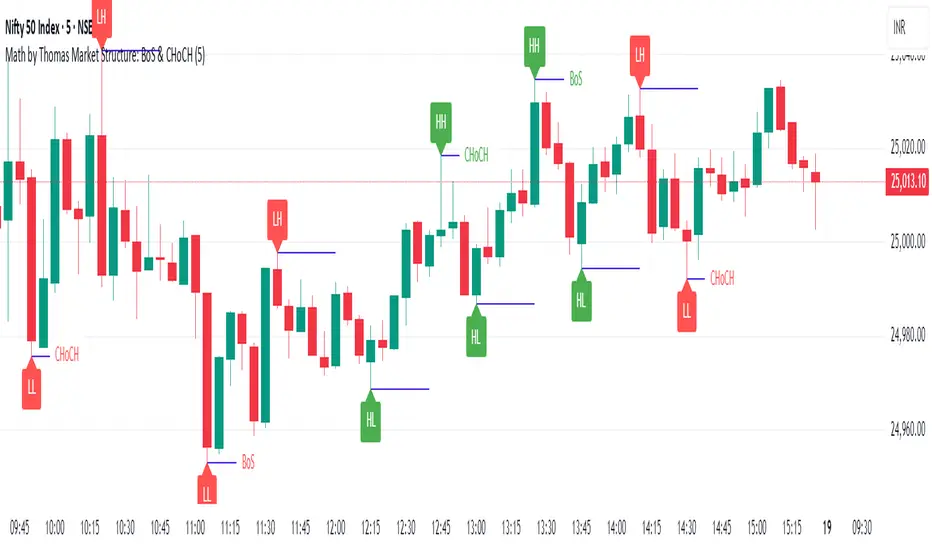
Market Structure: BoS & CHoCH (Math by Thomas)📌 Description:
Market Structure: BoS & CHoCH (Math by Thomas) is a clean and reliable market structure tool designed to visually mark Swing Highs, Swing Lows, and classify each one as HH (Higher High), LH (Lower High), LL (Lower Low), or HL (Higher Low) based on price action. It also detects and labels Break of Structure (BoS) and Change of Character (CHoCH) to help identify potential continuation or reversal in trend.
🛠️ How to Use:
Add the indicator to your chart (works on any timeframe and asset).
Adjust the "Swing Sensitivity" input to fine-tune how many bars the script uses to detect a swing high/low. A higher number smooths out noise.
The script will automatically:
Mark every confirmed swing high or low with a solid line.
Label the swing as HH, LH, HL, or LL depending on its relative position.
Show BoS (trend continuation) or CHoCH (trend reversal) labels with the current trend direction.
Toggle labels or lines on or off with the corresponding checkboxes in settings.
🔍 Tip:
Use this indicator alongside other tools like volume or RSI for more confident entries. A CHoCH followed by two BoS in the same direction often signals a strong trend reversal.
Volume towers by GSK-VIZAG-AP-INDIAVolume Towers by GSK-VIZAG-AP-INDIA
Overview :
This Pine Script visualizes volume activity and provides insights into market sentiment through the display of buying and selling volume, alongside moving averages. It highlights high and low volume candles, enabling traders to make informed decisions based on volume anomalies. The script is designed to identify key volume conditions, such as below-average volume, high-volume candles, and their relationship to price movement.
Script Details:
The script calculates a Simple Moving Average (SMA) of the volume over a user-defined period and categorizes volume into several states:
Below Average Volume: Volume is below the moving average.
High Volume: Volume exceeds the moving average by a multiplier (configurable by the user).
Low Volume: Volume that doesn’t qualify as either high or below average.
Additionally, the script distinguishes between buying volume (when the close is higher than the open) and selling volume (when the close is lower than the open). This categorization is color-coded for better visualization:
Green: Below average buying volume.
Red: Below average selling volume.
Blue: High-volume buying.
Purple: High-volume selling.
Black: Low volume.
The Volume Moving Average (SMA) is plotted as a reference line, helping users identify trends in volume over time.
Features & Customization:
Customizable Inputs:
Volume MA Length: The period for calculating the volume moving average (default is 20).
High Volume Multiplier: A multiplier for defining high volume conditions (default is 2.0).
Color-Coded Volume Histograms:
Different colors are used for buying and selling volume, as well as high and low-volume candles, for quick visual analysis.
Alerts:
Alerts can be set for the following conditions:
Below-average buying volume.
Below-average selling volume.
High-volume conditions.
How It Works:
Volume Moving Average (SMA) is calculated using the user-defined period (length), and it acts as the baseline for categorizing volume.
Volume Conditions:
Below Average Volume: Identifies candles with volume below the SMA.
High Volume: Identifies candles where volume exceeds the SMA by the set multiplier (highVolumeMultiplier).
Low Volume: When volume is neither high nor below average.
Buying and Selling Volume:
The script identifies buying and selling volume based on the closing price relative to the opening price:
Buying Volume: When the close is greater than the open.
Selling Volume: When the close is less than the open.
Volume histograms are then plotted using the respective colors for quick visualization of volume trends.
User Interface & Settings:
Inputs:
Volume MA Length: Adjust the period for the volume moving average.
High Volume Multiplier: Define the multiplier for high volume conditions.
Plots:
Buying Volume: Green bars indicate buying volume.
Selling Volume: Red bars indicate selling volume.
High Volume: Blue or purple bars for high-volume candles.
Low Volume: Black bars for low-volume candles.
Volume Moving Average Line: Displays the moving average line for reference.
Source Code / Authorship:
Author: prowelltraders
Disclaimer:
This script is intended for educational purposes only. While it visualizes important volume data, users are encouraged to perform their own research and testing before applying this script for trading decisions. No guarantees are made regarding the effectiveness of this script for real-world trading.
Contact & Support:
For questions, support, or feedback, please reach out to the author directly through TradingView (prowelltraders).
Signature:
GSK-VIZAG-AP-INDIA

Ticker DataThis script mostly for Pine coders but may be useful for regular users too.
I often find myself needing quick access to certain information about a ticker — like its full ticker name, mintick, last bar index and so on. Usually, I write a few lines of code just to display this info and check it.
Today I got tired of doing that manually, so I created a small script that shows the most essential data in one place. I also added a few extra fields that might be useful or interesting to regular users.
Description for regular users (from Pine Script Reference Manual)
tickerid - full ticker name
description - description for the current symbol
industry - the industry of the symbol. Example: "Internet Software/Services", "Packaged software", "Integrated Oil", "Motor Vehicles", etc.
country - the two-letter code of the country where the symbol is traded
sector - the sector of the symbol. Example: "Electronic Technology", "Technology services", "Energy Minerals", "Consumer Durables", etc.
session - session type (regular or extended)
timezone - timezone of the exchange of the chart
type - the type of market the symbol belongs to. Example: "stock", "fund", "index", "forex", "futures", "spread", "economic", "fundamental", "crypto".
volumetype - volume type of the current symbol.
mincontract - the smallest amount of the current symbol that can be traded
mintick - min tick value for the current symbol (the smallest increment between a symbol's price movements)
pointvalue - point value for the current symbol
pricescale - a whole number used to calculate mintick (usually (when minmove is 1), it shows the resolution — how many decimal places the price has. For example, a pricescale 100 means the price will have two decimal places - 1 / 100 = 0.01)
bar index - last bar index (if add 1 (because indexes starts from 0) it will shows how many bars available to you on the chart)
If you need some more information at table feel free to leave a comment.

Heikin Ashi Colored Regular OHLC CandlesHeikin Ashi Colored Regular OHLC Candles
In the world of trading, Heikin Ashi candles are a popular tool for smoothing out price action and identifying trends more clearly. However, Heikin Ashi candles do not reflect the actual open, high, low, and close prices of a market. They are calculated values that change the chart’s structure. This can make it harder to see precise price levels or use standard price-based tools effectively.
To get the best of both worlds, we can apply the color logic of Heikin Ashi candles to regular OHLC candles. This means we keep the true market data, but show the trend visually in the same smooth way Heikin Ashi candles do.
Why use this approach
Heikin Ashi color logic filters out noise and helps provide a clearer view of the current trend direction. Since we are still plotting real OHLC candles, we do not lose important price information such as actual highs, lows, or closing prices. This method offers a hybrid view that combines the accuracy of real price levels with the visual benefits of Heikin Ashi trend coloring. It also helps maintain visual consistency for traders who are used to Heikin Ashi signals but want to see real price action.
Advantages for scalping
Scalping requires fast decisions. Even small price noise can lead to hesitation or bad entries. Coloring regular candles based on Heikin Ashi direction helps reduce that noise and makes short-term trends easier to read. It allows for faster confirmation of momentum without switching away from real prices. Since the candles are not modified, scalpers can still place tight stop-losses and targets based on actual price structure. This approach also avoids clutter, keeping the chart clean and focused.
How it works
We calculate the Heikin Ashi values in the background. If the Heikin Ashi close is higher than the Heikin Ashi open, the trend is considered bullish and the candle is colored green. If the close is lower than the open, it is bearish and the candle is red. If they are equal, the candle is gray or neutral. We then use these colors to paint the real OHLC candles, which are unchanged in shape or position.
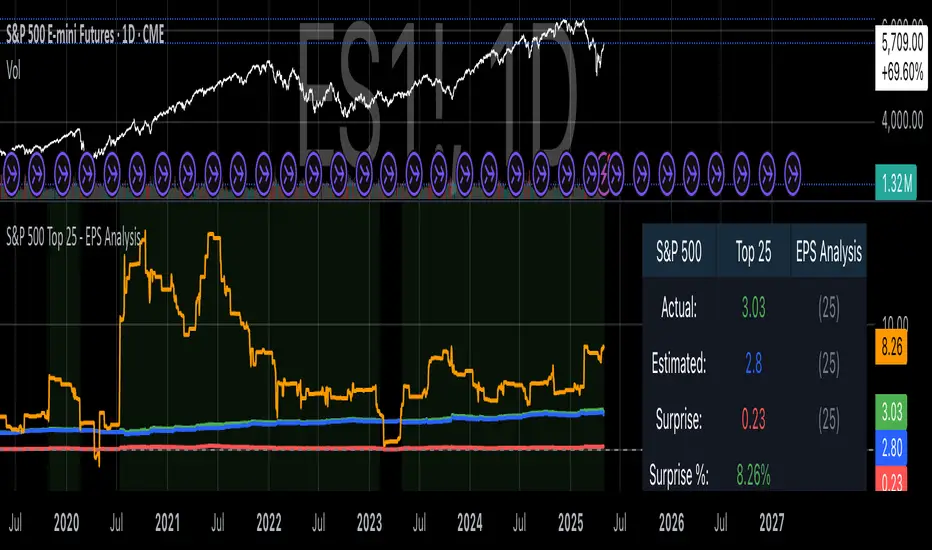
S&P 500 Top 25 - EPS AnalysisEarnings Surprise Analysis Framework for S&P 500 Components: A Technical Implementation
The "S&P 500 Top 25 - EPS Analysis" indicator represents a sophisticated technical implementation designed to analyze earnings surprises among major market constituents. Earnings surprises, defined as the deviation between actual reported earnings per share (EPS) and analyst estimates, have been consistently documented as significant market-moving events with substantial implications for price discovery and asset valuation (Ball and Brown, 1968; Livnat and Mendenhall, 2006). This implementation provides a comprehensive framework for quantifying and visualizing these deviations across multiple timeframes.
The methodology employs a parameterized approach that allows for dynamic analysis of up to 25 top market capitalization components of the S&P 500 index. As noted by Bartov et al. (2002), large-cap stocks typically demonstrate different earnings response coefficients compared to their smaller counterparts, justifying the focus on market leaders.
The technical infrastructure leverages the TradingView Pine Script language (version 6) to construct a real-time analytical framework that processes both actual and estimated EPS data through the platform's request.earnings() function, consistent with approaches described by Pine (2022) in financial indicator development documentation.
At its core, the indicator calculates three primary metrics: actual EPS, estimated EPS, and earnings surprise (both absolute and percentage values). This calculation methodology aligns with standardized approaches in financial literature (Skinner and Sloan, 2002; Ke and Yu, 2006), where percentage surprise is computed as: (Actual EPS - Estimated EPS) / |Estimated EPS| × 100. The implementation rigorously handles potential division-by-zero scenarios and missing data points through conditional logic gates, ensuring robust performance across varying market conditions.
The visual representation system employs a multi-layered approach consistent with best practices in financial data visualization (Few, 2009; Tufte, 2001).
The indicator presents time-series plots of the four key metrics (actual EPS, estimated EPS, absolute surprise, and percentage surprise) with customizable color-coding that defaults to industry-standard conventions: green for actual figures, blue for estimates, red for absolute surprises, and orange for percentage deviations. As demonstrated by Padilla et al. (2018), appropriate color mapping significantly enhances the interpretability of financial data visualizations, particularly for identifying anomalies and trends.
The implementation includes an advanced background coloring system that highlights periods of significant earnings surprises (exceeding ±3%), a threshold identified by Kinney et al. (2002) as statistically significant for market reactions.
Additionally, the indicator features a dynamic information panel displaying current values, historical maximums and minimums, and sample counts, providing important context for statistical validity assessment.
From an architectural perspective, the implementation employs a modular design that separates data acquisition, processing, and visualization components. This separation of concerns facilitates maintenance and extensibility, aligning with software engineering best practices for financial applications (Johnson et al., 2020).
The indicator processes individual ticker data independently before aggregating results, mitigating potential issues with missing or irregular data reports.
Applications of this indicator extend beyond merely observational analysis. As demonstrated by Chan et al. (1996) and more recently by Chordia and Shivakumar (2006), earnings surprises can be successfully incorporated into systematic trading strategies. The indicator's ability to track surprise percentages across multiple companies simultaneously provides a foundation for sector-wide analysis and potentially improves portfolio management during earnings seasons, when market volatility typically increases (Patell and Wolfson, 1984).
References:
Ball, R., & Brown, P. (1968). An empirical evaluation of accounting income numbers. Journal of Accounting Research, 6(2), 159-178.
Bartov, E., Givoly, D., & Hayn, C. (2002). The rewards to meeting or beating earnings expectations. Journal of Accounting and Economics, 33(2), 173-204.
Bernard, V. L., & Thomas, J. K. (1989). Post-earnings-announcement drift: Delayed price response or risk premium? Journal of Accounting Research, 27, 1-36.
Chan, L. K., Jegadeesh, N., & Lakonishok, J. (1996). Momentum strategies. The Journal of Finance, 51(5), 1681-1713.
Chordia, T., & Shivakumar, L. (2006). Earnings and price momentum. Journal of Financial Economics, 80(3), 627-656.
Few, S. (2009). Now you see it: Simple visualization techniques for quantitative analysis. Analytics Press.
Gu, S., Kelly, B., & Xiu, D. (2020). Empirical asset pricing via machine learning. The Review of Financial Studies, 33(5), 2223-2273.
Johnson, J. A., Scharfstein, B. S., & Cook, R. G. (2020). Financial software development: Best practices and architectures. Wiley Finance.
Ke, B., & Yu, Y. (2006). The effect of issuing biased earnings forecasts on analysts' access to management and survival. Journal of Accounting Research, 44(5), 965-999.
Kinney, W., Burgstahler, D., & Martin, R. (2002). Earnings surprise "materiality" as measured by stock returns. Journal of Accounting Research, 40(5), 1297-1329.
Livnat, J., & Mendenhall, R. R. (2006). Comparing the post-earnings announcement drift for surprises calculated from analyst and time series forecasts. Journal of Accounting Research, 44(1), 177-205.
Padilla, L., Kay, M., & Hullman, J. (2018). Uncertainty visualization. Handbook of Human-Computer Interaction.
Patell, J. M., & Wolfson, M. A. (1984). The intraday speed of adjustment of stock prices to earnings and dividend announcements. Journal of Financial Economics, 13(2), 223-252.
Skinner, D. J., & Sloan, R. G. (2002). Earnings surprises, growth expectations, and stock returns or don't let an earnings torpedo sink your portfolio. Review of Accounting Studies, 7(2-3), 289-312.
Tufte, E. R. (2001). The visual display of quantitative information (Vol. 2). Graphics Press.
FVG [TakingProphets]🧠 Purpose
This indicator is built for traders applying Inner Circle Trader (ICT) methodology. It detects and manages Fair Value Gaps (FVGs) — price imbalances that often act as future reaction zones. It also highlights New Day Opening Gaps (NDOGs) and New Week Opening Gaps (NWOGs) that frequently play a role in early-session price behavior.
📚 What is a Fair Value Gap?
A Fair Value Gap forms when price moves rapidly, skipping over a portion of the chart between three candles — typically between the high of the first candle and the low of the third. These zones are considered inefficient, meaning institutions may return to them later to:
-Rebalance unfilled orders
-Enter or scale into positions
-Engineer liquidity with minimal slippage
In ICT methodology, FVGs are seen as both entry zones and targets, depending on market structure and context.
⚙️ How It Works
-This script automatically identifies and manages valid FVGs using the following logic:
-Bullish FVGs: When the low of the current candle is above the high from two candles ago
-Bearish FVGs: When the high of the current candle is below the body of two candles ago
-Minimum Gap Filter: Gaps must be larger than 0.05% of price
-Combine Consecutive Gaps (optional): Merges adjacent gaps of the same type
-Consequent Encroachment Line (optional): Plots the midpoint of each gap
-NDOG/NWOG Tracking: Labels gaps created during the 5–6 PM session transition
-Automatic Invalidation: Gaps are removed once price closes beyond their boundary
🎯 Practical Use
-Use unmitigated FVGs as potential entry points or targets
-Monitor NDOG and NWOG for context around daily or weekly opens
-Apply the midpoint (encroachment) line for precise execution decisions
-Let the script handle cleanup — only active, relevant zones remain visible
🎨 Customization
-Control colors for bullish, bearish, and opening gaps
-Toggle FVG borders and midpoint lines
-Enable or disable combining of consecutive gaps
-Fully automated zone management, no manual intervention required
✅ Summary
This tool offers a clear, rules-based approach to identifying price inefficiencies rooted in ICT methodology. Whether used for intraday or swing trading, it helps traders stay focused on valid, active Fair Value Gaps while filtering out noise and maintaining chart clarity.

[TTM] ICT Sessions & Ranges🌟 Overview 🌟
The ICT Sessions & Ranges Indicator helps traders identify key intraday price levels by marking custom session highs/lows and opening ranges.
It helps traders spot potential liquidity grabs, reversals, and breakout zones by tracking price behavior around these key areas
🌟 Session Highs & Lows – Liquidity Zones 🌟
Session highs and lows often attract price due to stop orders resting above or below them. These levels are frequently targeted during high-volatility moves.
🔹 Asia Session
- Usually ranges in low volatility.
- Highs/lows often get swept during early London.
- Price may raid these levels, then reverse.
🔹 London Session
- First major volatility of the day.
- Highs/lows often tested or swept in New York.
- Commonly forms the day’s true high or low.
🌟 Opening Range Concepts 🌟
The Opening Range is the first 15, 30, or 60 minutes of a session (e.g., New York).
The high (ORH) and low (ORL) define the market’s initial balance and key reaction levels.
🔹 Breakout Trade
- Price breaks ORH/ORL with momentum.
- Signals directional intent.
- Traders enter on the breakout, with stops inside the range.
🔹 Liquidity Raid
- Price briefly breaks ORH/ORL to trigger stops.
- Reverses after the sweep.
- Look for structure shift and entry near FVG or OB.
🌟 Customizable Settings 🌟
The indicator includes 3 configurable ranges , each with:
Start & End Time – Set any custom time window.
Display Type – Choose Box (highlight range) or Lines (mark high/low).
Color Settings – Set custom colors for boxes and lines.
🌟 Default Settings 🌟
Range 1 : 19:00–00:00 (Asia Session)
Range 2 : 01:45–05:15 (London Session)
Range 3 : 09:30–10:00 (NY Opening Range – 30m)
