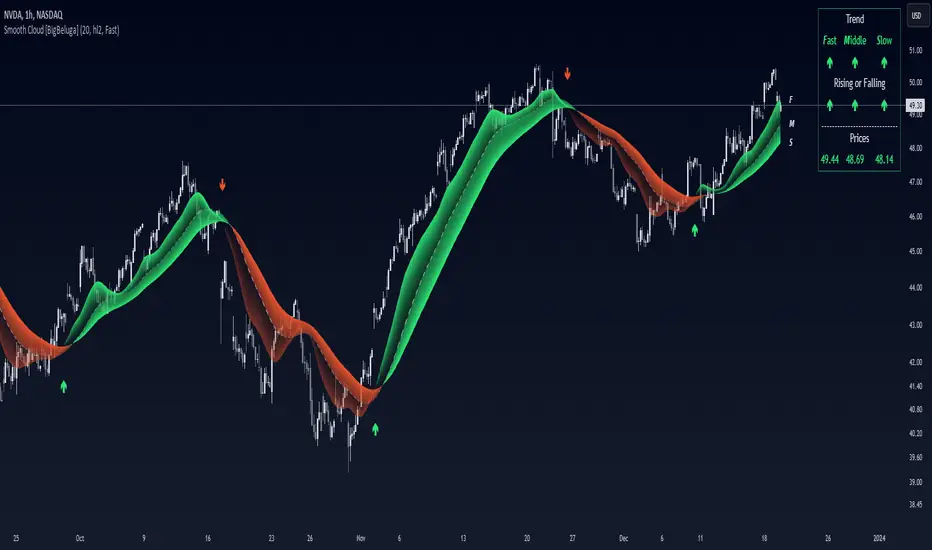
Smooth Cloud [BigBeluga]This trend-following indicator, called Smooth Cloud, is built on top of a SuperSmoother Filter of John Ehlers with small modification.
It consists of three smoothed lines—Fast, Middle, and Slow—that together form a cloud. These lines are based on different periods, helping traders analyze market changes over different timeframes (fast, mid, and slow). The indicator offers a color-coded visual cloud to depict trend direction, along with a detailed dashboard that shows the positioning of the lines, whether they are rising or falling, and their price levels.
🔵 IDEA
The Smooth Cloud indicator is designed to help traders quickly assess the market trend by using three smoothed lines with varying periods. The lines represent fast, mid, and slow market changes, and their relative positioning provides a clear view of trend shifts. The dashboard gives a more granular view by showing if the lines are rising or falling individually, without comparing them to each other, providing insights into potential trend changes before they are fully formed. The color-coded cloud further enhances the visual experience by allowing traders to see trend direction at a glance, making it easier to spot major and minor shifts in the market.
🔵 KEY FEATURES & USAGE
◉ Three Smoothed Lines (Fast, Mid, Slow):
The indicator consists of three smoothed lines, each representing a different periods. The Fast line reacts more quickly to price changes, while the Slow line reacts more slowly, allowing traders to capture both short-term and long-term trend information. The lines are based on different lengths, and their positioning relative to each other helps determine market direction.
◉ Color-Coded Cloud:
The cloud formed between the lines is color-coded to indicate trend direction. When the Fast line is above the Slow line, it signals an upward trend, and the cloud is green. When the Fast line is below the Slow line, the cloud turns red, indicating a downward trend. This color coding makes it easy to spot the overall trend direction visually without having to analyze the lines in detail.
◉ Dashboard for Line Positioning and Trend Direction:
A dashboard in the top right corner of the chart shows the positioning of the Fast, Middle, and Slow lines relative to each other. It displays arrows for each line to indicate whether the line is above or below the other lines. For exae determines its trend direction based on its position to mid line — if it's above, an upward arrow is displayed, and if it's below mid line, a downward arrow is shown.mple, if the Fast line is above the Slow line, the dashboard shows an upward arrow for the Fast line. The Slow lin
Up trend:
Up trend shift:
Down trend shift:
Down Trend:
◉ Rising and Falling Detection:
The dashboard also tracks whether the lines are rising or falling based solely on their own values. If a line rises or falls consistently over three bars, the dashboard shows an upward or downward arrow under the "Rising or Falling" section. This feature provides additional insight into the market's momentum, allowing traders to spot potential trend reversals more quickly.
◉ Price Levels for Fast, Middle, and Slow Lines:
The dashboard includes the price levels for the Fast, Middle, and Slow lines, displayed at the bottom. These levels give traders a quick reference for where the lines are currently positioned relative to the price, adding further context to the trend information displayed.
◉ Fast Signals:
The fast signals are diplayed when fast line crosses slow line. Gree arrows up shows fast line crossed over slow and when arrow down fast line crossed under slow one.
🔵 CUSTOMIZATION
Length Input: You can adjust the length parameter, which affects the smoothing period for the lines. A shorter length makes the lines react more quickly to price changes, while a longer length provides a smoother, more gradual response.
Source Input: The indicator uses the hl2 source (the average of the high and low prices), but you can change this to another source to better suit your trading strategy.
Signals Type: Select between "Fast" and "Slow". Fast signals - is interaction of fast and slow lines. Slow signals is interaction of mid and slow lines
Related script:
Ehlerssupersmoother
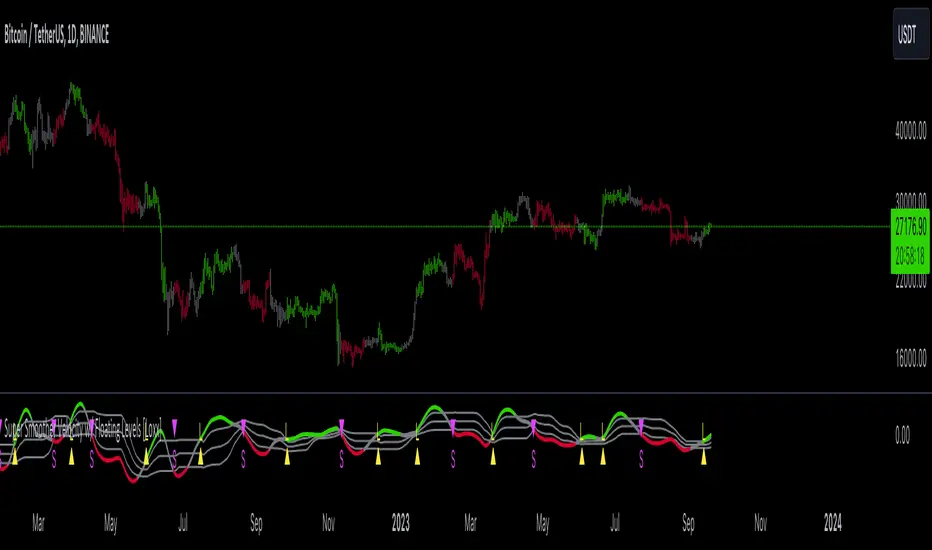
Super Smoother Velocity w/ Floating Levels [Loxx]The Super Smoother Velocity with Floating Levels is a technical tool devised to provide clearer price movement insights, drawing from the power of the "Super Smoother" function.
The Super Smoother function is fundamentally a unique formula which leverages trigonometric and exponential concepts to generate a highly smooth value for the given data. This function's intent is to help diminish noise, making the price movements more discernible.
█ Ehlers Super Smoother:
Developed by John Ehlers, the Super Smoother is designed to improve the data smoothing process by eliminating noise in the data. The traditional moving averages, like the simple moving average (SMA) or exponential moving average (EMA), often incorporate noise which can provide false trading signals. Ehlers' goal with the Super Smoother was to produce a filtering technique that retains the smoothness of a moving average while being more responsive to recent price changes and reducing lag.
Purpose:
The Super Smoother aims to minimize the lag seen in traditional moving averages by reducing the influence of short-term price noise. This noise can cause erratic movements in simple and exponential moving averages, leading to potential false signals.
Mechanism:
The Super Smoother uses a combination of exponential moving averages with a cyclic component to achieve its goal. By introducing a frequency component (through the use of a sine wave), the Super Smoother tries to focus on the more dominant, longer-term cycles in the data rather than the short-term noise.
The cyclic component is determined by the length (or period) provided to the Super Smoother. This essentially dictates which cycle the filter will focus on the most.
Advantages:
1. Reduced Lag: As compared to traditional moving averages, the Super Smoother's response to price changes is quicker, meaning it's more reactive to recent price data.
2. Noise Reduction: By focusing on dominant cycles and reducing the influence of short-term noise, it offers a cleaner and smoother data representation.
3. Versatility: While designed for price data, it can be applied to other indicators to reduce their noise.
In trading applications, the Ehlers Super Smoother can provide clearer signals about the dominant trend in price data. This can be particularly useful in noisy markets or on lower timeframes where traditional moving averages might produce many false or premature signals.
█ Settings
1. The momentum period, which can be imagined as the heartbeat of this indicator, setting its pace.
2. The range for the maximum and minimum momentum, offering a lens through which to view the price movement extremes.
3. Predefined levels up and down, which are essentially markers that provide a perspective on the potential high and low turning points.
A significant feature here is the signaling mechanism. This mechanism alerts users to potential buy or sell opportunities based on the way the Super Smoother function crosses certain thresholds. There are two distinct modes for these signals:
Levels Mode: This watches for the Super Smoother's crossing of the user-defined upper and lower levels.
Middle Mode: This focuses on the median, observing if the Super Smoother crosses this midway point.
Visual representation is enhanced with color coding. When in Middle Mode, if the Super Smoother is above the median, it's displayed in green, suggesting positive momentum. Conversely, red indicates it's below the median, hinting at negative momentum. In the Levels Mode, green signals the Super Smoother is above the upper level, while red indicates it's below the lower level. Gray is used when the value lies between the two extremes.
For those who prefer a visual cue on their charts, there's an option to showcase colored bars based on the momentum's direction. Additionally, small symbols can be plotted to highlight buy ("L") or sell ("S") signals, depending on the Super Smoother's movement in relation to the predefined thresholds.
Lastly, alert conditions can be set up to notify users whenever a potential buy or sell situation arises, making sure they don't miss key trading opportunities.
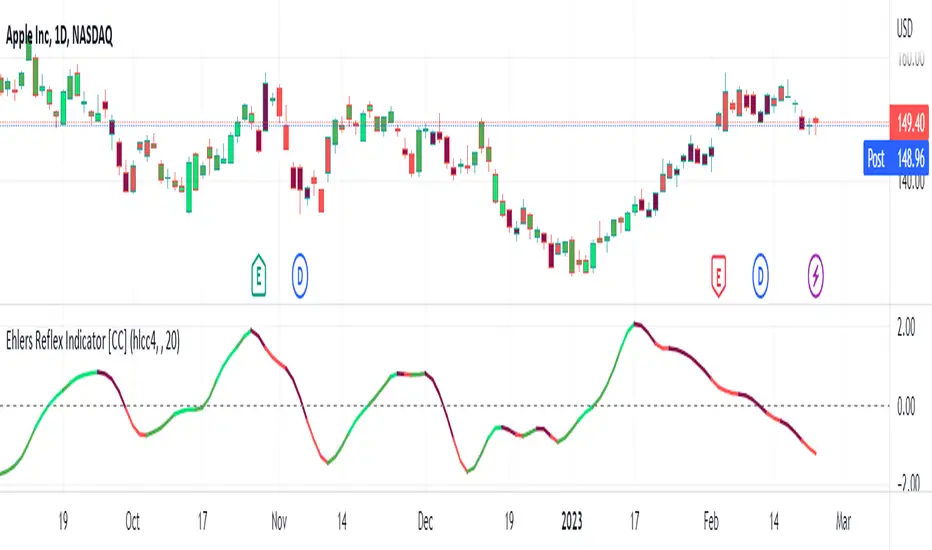
Ehlers Reflex Indicator [CC]The Reflex Indicator was created by John Ehlers (Stocks and Commodities Feb 2020) and this is a zero lag indicator that works similar to an overbought/oversold indicator but with the current stock cycle data. I find that this indicator works well as a leading indicator as well as a divergence indicator. Generally speaking, this indicator indicates a medium to long term downtrend when the indicator is below the line and a medium to long term uptrend when the indicator is above the line. Ehlers has created a few complementary indicators that I will release in the next few days but just keep in mind that this indicator focuses on the underlying cycle component while removing as much noise with no lag. I have color coded the lines to show strong signals with the darker colors and normal signals with the lighter colors. Buy when the line turns green and sell when it turns red.
Let me know if there are any other scripts you would like to see me publish!
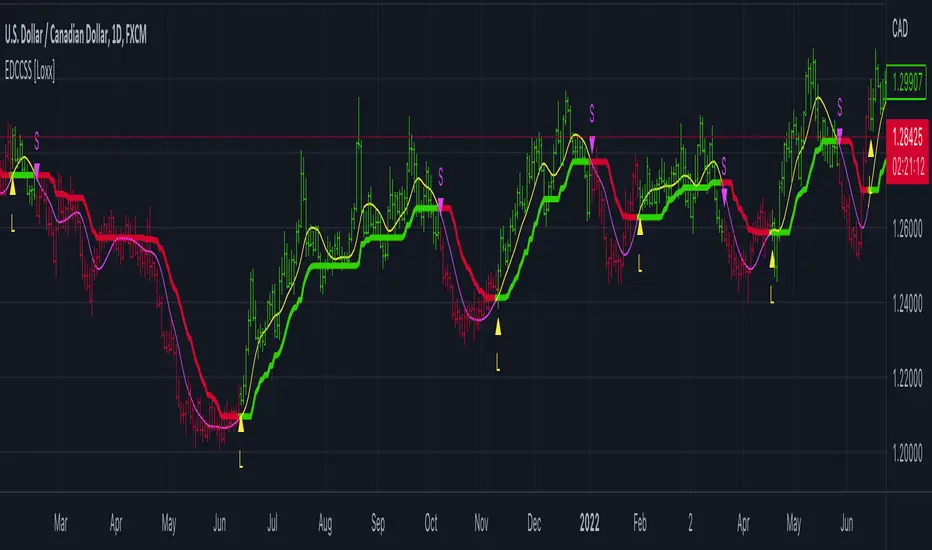
EMA-Deviation-Corrected Super Smoother [Loxx]This indicator is using the modified "correcting" method. Instead of using standard deviation for calculation, it is using EMA deviation and is applied to Ehlers' Super Smoother.
What is EMA-Deviation?
By definition, the Standard Deviation (SD, also represented by the Greek letter sigma σ or the Latin letter s) is a measure that is used to quantify the amount of variation or dispersion of a set of data values. In technical analysis we usually use it to measure the level of current volatility.
Standard Deviation is based on Simple Moving Average calculation for mean value. This version is not doing that. It is, instead, using the properties of EMA to calculate what can be called a new type of deviation, and since it is based on EMA. It is similar to Standard Deviation, but on a first glance you shall notice that it is "faster" than the Standard Deviation and that makes it useful when the speed of reaction to volatility is expected from any code or trading system.
What is Ehlers Super Smoother?
The Super Smoother filter uses John Ehlers’s “Super Smoother” which consists of a a Two-pole Butterworth filter combined with a 2-bar SMA (Simple Moving Average) that suppresses the 22050 Hz Nyquist frequency: A characteristic of a sampler, which converts a continuous function or signal into a discrete sequence.
Things to know
The yellow and fuchsia thin line is the original Super Smoother
The green and red line is the Corrected Super Smoother
When the original Super Smoother crosses above the Corrected Super Smoother line, its a long, when it crosses below, its a short
Included
Alerts
Signals
Bar coloring