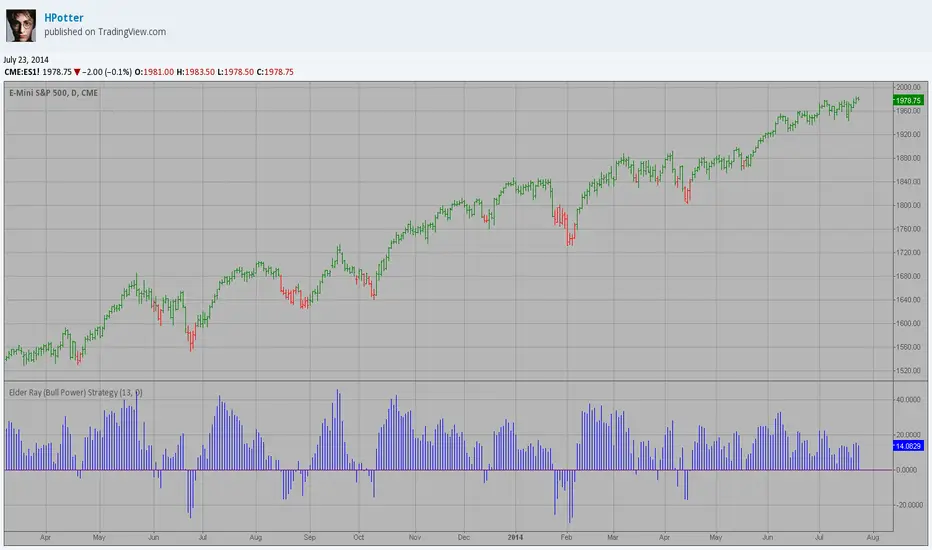
Elder Ray (Bull Power) Strategy Developed by Dr Alexander Elder, the Elder-ray indicator measures buying
and selling pressure in the market. The Elder-ray is often used as part
of the Triple Screen trading system but may also be used on its own.
Dr Elder uses a 13-day exponential moving average (EMA) to indicate the
market consensus of value. Bull Power measures the ability of buyers to
drive prices above the consensus of value. Bear Power reflects the ability
of sellers to drive prices below the average consensus of value.
Bull Power is calculated by subtracting the 13-day EMA from the day's High.
Bear power subtracts the 13-day EMA from the day's Low.
You can use in the xPrice any series: Open, High, Low, Close, HL2, HLC3, OHLC4 and ect...
Elder's Force Index (EFI)
Elder Ray (Bear Power) Developed by Dr Alexander Elder, the Elder-ray indicator measures buying
and selling pressure in the market. The Elder-ray is often used as part
of the Triple Screen trading system but may also be used on its own.
Dr Elder uses a 13-day exponential moving average (EMA) to indicate the
market consensus of value. Bear Power measures the ability of sellers to
drive prices below the consensus of value. Bear Power reflects the ability
of sellers to drive prices below the average consensus of value.
Bull Power is calculated by subtracting the 13-day EMA from the day's High.
Bear power subtracts the 13-day EMA from the day's Low.
You can use in the xPrice any series: Open, High, Low, Close, HL2, HLC3, OHLC4 and ect...

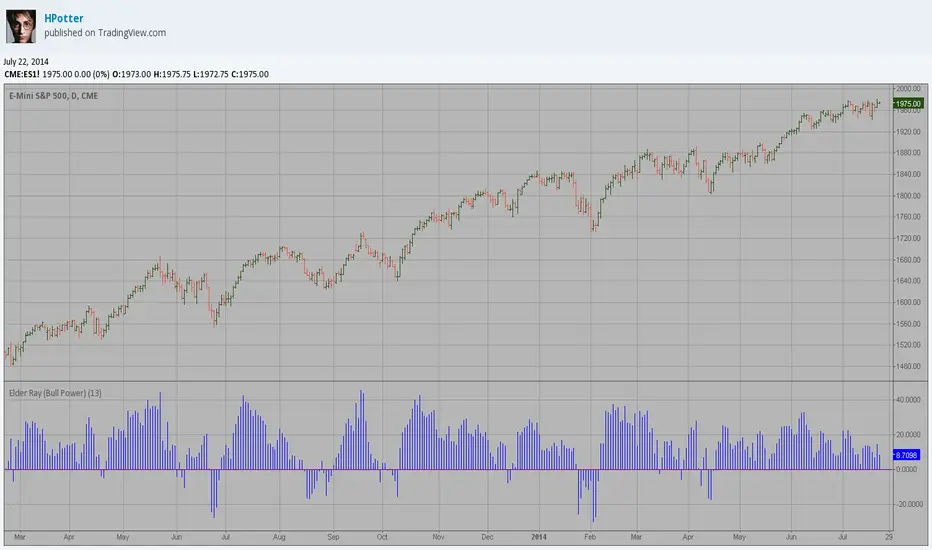
Elder Ray (Bull Power) Developed by Dr Alexander Elder, the Elder-ray indicator measures buying
and selling pressure in the market. The Elder-ray is often used as part
of the Triple Screen trading system but may also be used on its own.
Dr Elder uses a 13-day exponential moving average (EMA) to indicate the
market consensus of value. Bull Power measures the ability of buyers to
drive prices above the consensus of value. Bear Power reflects the ability
of sellers to drive prices below the average consensus of value.
Bull Power is calculated by subtracting the 13-day EMA from the day's High.
Bear power subtracts the 13-day EMA from the day's Low.
You can use in the xPrice any series: Open, High, Low, Close, HL2, HLC3, OHLC4 and ect...
Indicator: Elder Impulse SystemAccording to Elder, "The Impulse System encourages you to enter a trade cautiously but exit fast, by identifying inflection points where a trend speeds up or slows down. This is the professional approach to trading, the total opposite of the amateur's style. Beginners jump into trades without thinking too much and take forever to get out, hoping and waiting for the market to turn their way."
The Impulse System is based on two indicators, a 13-day exponential moving average and the MACD-Histogram. The moving average identifies the trend, while the MACD-Histogram measures momentum. As a result, the Impulse System combines trend following and momentum to identify impulses that can be traded.
By default it uses your chart's time frame, but you can set it to any custom time frame via options page. Optionally, price bars can be color coded too.
More info:
stockcharts.com
Steps to import / use custom indicators from this chart:
PDF: drive.google.com
