ATR ZigZag BreakoutATR ZigZag Breakout
This strategy uses my ATR ZigZag indicator (powered by the ZigZagCore library) to scalp breakouts at volatility-filtered highs and lows.
Everyone knows stops cluster around clear swing highs and lows. Breakout traders often pile in there, too. These levels are predictable areas where aggressive orders hit the tape. The idea here is simple:
→ Let ATR ZigZag define clean, volatility-filtered pivots
→ Arm a stop market order at those pivots
→ Join the breakout when the crowd hits the level
The key to greater success in this simple strategy lies in the ZigZag. Because the pivots are filtered by ATR instead of fixed bar counts or fractals, the levels tend to be more meaningful and less noisy.
This approach is especially suited for intraday trading on volatile instruments (e.g., NQ, GC, liquid crypto pairs).
How It Works
1. Pivot detection
The ATR ZigZag uses an ATR-based threshold to confirm swing highs and lows. Only when price has moved far enough in the opposite direction does a pivot become “official.”
2. Candidate breakout level
When a new swing direction is detected and the most recent high/low has not yet been broken in the current leg, the strategy arms a stop market order at that pivot.
• Long candidate → most recent swing high
• Short candidate → most recent swing low
These “candidate trades” are shown as dotted lines.
3. Entry, SL, and TP
If price breaks through the level, the stop order is filled and a bracket is placed:
• Stop loss = ATR × SL multiplier
• Take profit = SL distance × RR multiplier
Once a level has traded, it is not reused in the same swing leg.
4. Cancel & rotate
If the market reverses and forms a new swing in the opposite direction before the level is hit, the pending order is cancelled and a new candidate is considered in the new direction.
Additional Features
• Optional session filter for backtesting specific trading hours
Gelombang Elliott

ATR ZigZag - Volatility-Filtered Market StructureDescription
This indicator draws ZigZags using an ATR based threshold for direction switching to identify major swing highs and lows. Instead of relying on fractals or fixed bar-count swings, pivots are confirmed only when price moves beyond the prior extreme by:
threshold = ATR(length) × ATR_mult
This filters noise, enforces valid swing structure (high → low → high), and adapts automatically to volatility. The ATR ZigZag is ideal for traders who want a clean, objective view of swing structure without noise. This has many uses, including mapping swing structure, drawing chart patterns, and trading around extremes.
Lag and Repainting
Pivots are confirmed only after price moves sufficiently in the opposite direction. This creates necessary lag. The ZigZag is drawn when this occurs, and will anchor to the high/low in the past. Optional detection dot plots show exactly when confirmation occurred.
What You See
ZigZag: dashed gray line, repainted to anchor at the confirmed highs and lows
Latest Pivot Levels: Dashed horizontal lines at the most recent confirmed high/low.
Optional Live Swing Leg: A real-time line from the last confirmed pivot to the current swing extreme, updating until a new pivot forms.
Optional ATR Boxes: 1×ATR shaded zones around the latest pivot for structural context.
Optional Pivot Confirmation Dots: Markers show the bar where the threshold is crossed and a swing is officially confirmed. This is to understand the lag and see when the ZigZag repainted.

ZigZagCoreZigZagCore
ZigZagCore is a generic ZigZag engine that works with any user-defined threshold (ATR-based, volatility-based, fixed ticks, etc.).
API
import ReflexSignals/ZigZagCore/ as zz
var zz.ZzState state = zz.zz_new()
float thr = ... // your threshold in price units
state := zz.zz_update(state, thr)
zz_update(state, thr)
Parameters:
state (ZzState)
thr (float)
ZzState
Fields:
dir (series int)
highSinceLow (series float)
lowSinceHigh (series float)
lastHighLevel (series float)
lastLowLevel (series float)
lastHighIndex (series int)
lastLowIndex (series int)
highSinceLowIndex (series int)
lowSinceHighIndex (series int)
isNewHigh (series bool)
isNewLow (series bool)
Directional State
dir = 1 → market is in an upswing
dir = -1 → market is in a downswing
dir = na → initial undecided state
Live Swing Tracking (Unconfirmed Leg)
Continuously updated swing extremes:
highSinceLow — highest price since the last confirmed low
lowSinceHigh — lowest price since the last confirmed high
Their corresponding bar indices
These fields describe the current active swing leg, which updates every bar until a pivot is confirmed.
Pivot Detection
A pivot confirms only when price moves beyond the prior swing extreme by more than threshold. When this occurs, the library sets:
isNewHigh = true (on the detection bar only) and updates lastHighLevel, lastHighIndex
isNewLow = true and updates lastLowLevel, lastLowIndex

Swing High-Low Line ConnectorSwing High-Low Line Connector is a simple and intuitive tool that automatically detects swing highs and swing lows using fractal-style pivot logic and connects them with clean, continuous lines. This indicator helps traders visualize market structure, trend shifts, and swing-based support/resistance levels at a glance.
The script identifies each confirmed swing point based on a user-defined lookback window (left/right bars). When a new swing is confirmed, the indicator updates the previous leg or creates a new one, effectively drawing the classic “zigzag-style” connections used in discretionary trading and price-action analysis.
A dynamic tail extension is included to show the most recent swing extending toward the current price. By default, the tail follows a ZigZag-style logic—extending upward after a swing low and downward after a swing high—but users can also anchor it to Close, High, Low, or HL2.
Features
Automatic detection of swing highs and swing lows
Clean line connections between swings (similar to discretionary market-structure mapping)
Proper consolidation handling: weaker highs/lows are ignored
Optional ZigZag-style dynamic tail extension
Fully customizable lookback window, line color, and line width
Works on any market and timeframe
Use Cases
Identifying market structure (HH, HL, LH, LL)
Visualizing trend transitions
Spotting breakout levels and swing-based support/resistance
Aiding discretionary swing trading, trend following, or pattern recognition
This indicator keeps the logic simple and visual—ideal for traders who prefer clean chart structure without unnecessary noise.

TrenVantage TRADER - Market Structure Intelligence 📘 TrenVantage TRADER – Market Structure Intelligence
Hello Traders!
We are excited to introduce TrenVantage TRADER! This indicator is a professional-grade market structure tool designed for active traders and analysts who require deeper insight and more precise control. It combines advanced pivot-based level detection, a dynamic ZigZag engine, multi-timeframe trend awareness, and Fibonacci integration into a clear and actionable visual layout. The TRADER edition offers enhanced logic that highlights multiple key levels (up to 8) with strength ratings, making it ideal for traders who need full market context without oversimplification. Whether you are day-trading, swing-trading, or managing multiple assets, TrenVantage TRADER empowers you to understand price structure, identify confluence zones, and monitor directional bias in real time.
✨ Key Features
🔹 Smart Support & Resistance (Max 8 Levels – TRADER Version)
- Auto-detected levels using precision candle-body logic
- Prioritizes the strongest zones with strength ratings
- Includes tested vs. untested levels for professional analysis
- Ideal for reaction-based trading and advanced setups
🔹 Advanced Pivot Engine
- Timeframe-aware, body-focused pivot detection
- Dynamic lookback for professional-level accuracy
- Filters weak pivots to reduce chart clutter
🔹 Dynamic Trend Detection (ZigZag Core)
- Real-time uptrend / downtrend state with swing-based mapping
- Adjustable deviation and sensitivity for professional precision
- Tracks higher highs, higher lows, lower highs, lower lows
🔹 Multi-Timeframe Trend Integration
- Detects trends across multiple higher timeframes
- Displays trend confluence scores for actionable insight
- Helps identify alignment with larger market bias
🔹 Status Box Dashboard
- Displays current trend, price, price change, and SMA & EMA trend position
- Nearest S/R with distance and strength information
- Multi-timeframe trend direction and confluence
- Market position summary (above, below, or between levels)
- Active S/R count and proximity detection status
🔹Dual SMA & EMA Overlay
- Fully adjustable period and visual style
- Acts as a directional filter and confluence tool
- Integrated into status box for instant comparison
- Crossover signals printed
🔹 Proximity & Trend Alerts
- Alerts when price approaches key S/R within defined distance
- Alerts on trend changes (Uptrend / Downtrend)
- Level break alerts for advanced breakout and reversal strategies
- Once-per-bar logic to avoid excessive notifications
🔹 Fibonacci Levels Overlay
- Auto-detects recent swing high/low for retracements and extensions
- Retracements: 23.6%, 38.2%, 50%, 61.8%
- Extensions: 127.2%, 161.8%
- Labels percentage levels directly on chart
- Works alongside S/R for confluence-based analysis
🔍 In-Depth Feature Breakdown
1. Smart Support & Resistance Levels
TrenVantage TRADER uses a refined pivot-based engine combined with candle-body logic to detect the strongest support and resistance zones. Unlike simpler tools, it can maintain up to 8 key levels with visual strength ratings.
How It Works
- Prioritizes zones with multiple touches and tested/untested status
- Tracks both current timeframe and higher timeframe context
- Highlights levels with color-coded clarity:
- Green = Support
- Red = Resistance
How It Helps Traders
- Provides comprehensive market structure overview
- Helps identify strong confluence zones for trading setups
- Reduces guesswork and supports data-driven decisions
2. Advanced Pivot Engine
Professional-grade pivot detection ensures only significant pivots are plotted, improving the reliability of support/resistance levels.
How It Works
- Dynamically adapts lookback periods based on volatility
- Focuses on candle bodies for more robust zone detection
- Filters out weak or irrelevant pivots
How It Helps Traders
- Clean, reliable chart with actionable levels
- Supports both breakout and reaction strategies
- Works across scalping, day, and swing-trading approaches
3. Dynamic Trend Detection (ZigZag Core)
Tracks real structural swings for professional trend analysis, avoiding guesswork or noise.
How It Works
- Detects higher highs/lows and lower highs/lows
- Adjustable deviation filtering for precision
- Smoothly updates trend direction without excessive repainting
How It Helps Traders
- Quickly identifies trend shifts and continuation setups
- Aligns positions with market structure for higher probability trades
- Reduces false signals by focusing on meaningful swings
4. Multi-Timeframe Trend Integration
Professional traders need to see trend alignment across multiple timeframes.
How It Works
- Detects trend direction on 2–3 higher timeframes
- Displays MTF confluence in status box
- Provides a clear bias score for informed decision-making
How It Helps Traders
- Confirms entries and exits with higher timeframe alignment
- Improves risk management with multi-level awareness
- Supports advanced strategy building
5 . Status Box Dashboard
A compact information hub displaying essential market data in real time.
What It Shows
- Trend direction & momentum bias
- SMA position & influence
- Nearest support & resistance levels
- Distance and strength of each level
- Multi-timeframe trend confluence
- Market position summary
- Active S/R count and proximity alerts
How It Helps Traders
- Reduces need to constantly scan the chart
- Improves situational awareness and trade timing
- Supports multi-asset monitoring with clarity
6. Dual SMA & EMA Overlay
Adds professional-grade trend filters with both SMA and EMA, giving traders more clarity and confluence without chart clutter.
How It Works
- Plots two adjustable moving averages: one SMA and one EMA
- SMA serves as a directional trend filter, EMA highlights momentum shifts
- Both moving averages can be integrated into the status box for instant comparison
- Optional cross signals indicate potential trend reversals or acceleration
How It Helps Traders
- Confirms trend alignment across both smooth (SMA) and reactive (EMA) perspectives
- Detects momentum shifts early to support entries, exits, and trade management
- Adds confluence when combined with support/resistance levels and multi-timeframe trends
- Provides a clear visual guide for swing, day, and position trading
7. Proximity & Trend Alerts
Professional-grade alerts ensure traders never miss actionable events.
How It Works
- Alerts when price approaches key levels within set distance
- Alerts on trend change or level break
- Configured once-per-bar for clarity
How It Helps Traders
- Supports breakout, reaction, and reversal strategies
- Reduces chart monitoring time
- Ensures key market shifts are noticed immediately
8. Fibonacci Levels Overlay
TrenVantage TRADER integrates dynamic Fibonacci retracements and extensions directly into your chart, giving you an advanced tool to anticipate potential reversal, continuation, and breakout zones.
How It Works
- Automatically detects the most recent significant swing high and swing low
- Draws retracement levels: 23.6%, 38.2%, 50%, 61.8%
- Draws extension levels: 127.2%, 161.8%
- Retracements follow the direction of the last swing; extensions project potential breakout targets
- Optional labels show the percentage level directly on the chart for clarity
- Fully adjustable opacity and visibility settings for clean visual representation
How It Helps Traders
- Highlights areas where price is likely to react or stall
- Supports both trend-following and counter-trend strategies
- Works in conjunction with support/resistance levels for confluence-based decision-making
- Adds an objective, mathematically-based reference for target setting and trade management
🚀 Getting Started (Quick Guide)
🔹Add the Indicator to Your Chart
- Works instantly on any timeframe or market
🔹Adjust the Settings
- Configure S/R levels, SMA, MTF trend, and alerts
🔹Watch Key Levels
- Red = Key Resistance Levels, Green = Key Support Levels
🔹Level Types
- By default, Tested Levels = Dotted, Untested Levels = Solid
🔹Monitor Status Box
- Check trend, SMA position, nearest levels, and market context
🔹Set Alerts
- Enable proximity, trend change, and level break notifications
📈 Best Practices for TrenVantage TRADER
🔹 Trend Confirmation:
- Combine ZigZag trend state, SMA, and MTF trend alignment.
🔹 Level Reactions:
- Observe price at the nearest support/resistance zones; proximity alerts help anticipate reactions.
🔹 Market Positioning:
-Use status box to quickly assess whether price is above, below, or between levels.
🔹 Confluence Building:
- Combine multiple levels, SMA, and MTF alignment for higher probability setups.
🔹 Professional Clarity:
- Up to 8 key levels are shown with strength ratings, balancing insight and chart readability.
📌 Disclaimer
This indicator is a technical analysis tool provided for informational and educational purposes only. It does not constitute financial advice, trading advice, or investment recommendations. All trading involves risk, and past performance does not guarantee future results. Always perform your own analysis and use proper risk management. You are solely responsible for any decisions made based on this tool.
If you'd like access or have any questions, feel free to reach out to me directly via DM.

TrenVantage RETAIL - Smart Support and Resistance📘 TrenVantage RETAIL – Smart Support & Resistance
Hello Traders!
We are excited to introduce this new tool TrenVantage RETAIL! This indicator is a precision-built market structure tool designed to help traders easily identify actionable Support & Resistance zones, emerging trends, and proximity-based reaction areas. It combines pivot-based level detection, a dynamic ZigZag engine, and trend-awareness analytics into a clean, non-cluttered visual layout. The RETAIL edition offers simplified yet powerful logic that highlights only the most relevant 2–3 key levels, making it ideal for traders who prefer clarity over chart overload. Whether you are day-trading or swing-trading, TrenVantage RETAIL helps you understand price behavior, locate nearby reaction zones, and monitor directional bias in real time.
✨ Key Features
🔹 Smart Support & Resistance (Max 3 Levels – Retail Version)
- Auto-detected levels using precision body logic
- Keeps only the most relevant 2–3 zones
- Clean, minimal, and ideal for reaction-based trading
🔹 Clean Pivot Engine
- Uses timeframe-based pivots
- Body-focused calculations improve accuracy
- Fixed retail-friendly lookback ensures consistency
🔹 Trend Detection (ZigZag-Based)
- Real-time uptrend / downtrend state
- Swing-based structure mapping
- Adjustable deviation settings
🔹 Status Box Dashboard
- Trend direction + momentum bias
- Current price & price change
- SMA position and trend influence
- Nearest S/R with point distances
- Market position summary
- Level counts and proximity status
🔹 SMA Overlay
- Fully adjustable period
- Useful for extra confirmation
🔹 Real-Time Alerts
- Proximity alerts near S/R
- Trend change alerts (Uptrend / Downtrend)
- Clean once-per-bar confirmations
🔍 In-Depth Feature Breakdown
1. Smart Support & Resistance Levels
TrenVantage RETAIL uses a refined pivot-based engine combined with candle-body logic to detect only the most meaningful support and resistance zones. Instead of flooding your chart with lines, the algorithm intelligently maintains up to three major levels at any time.
How It Works
- Uses primary pivots from the current timeframe
- Prioritizes candle bodies over wicks for more reliable zones
- Removes outdated levels to keep the chart clean
- Highlights levels with color-coded clarity:
Green = Support
Red = Resistance
How It Helps Traders
- Keeps focus on the levels that matter
- Reduces noise and over-analysis paralysis
- Helps anticipate reactions, rejections, consolidations, and tests
- Works across all markets and timeframes
2. Streamlined Pivot Engine
While many indicators use fixed pivot logic, TrenVantage RETAIL uses a timeframe-aware pivot engine optimized for retail traders who prefer precision without complexity.
How It Works
- Pulls pivots from the trader’s active timeframe
- Uses body-to-body pivot recognition to improve accuracy
- Reduces over-plotting by filtering out weak pivots
How It Helps Traders
- Provides cleaner, more accurate structural points
- Enhances the reliability of support/resistance levels
- Adapts naturally whether you're scalping or swing trading
3. Dynamic Trend Detection (ZigZag Core)
TrenVantage RETAIL includes a clean and efficient ZigZag engine that tracks real structural swings, allowing traders to see trend direction with clarity rather than guessing.
How It Works
- Identifies higher highs, higher lows, lower highs, lower lows
- Uses deviation-based swing filtering
- Smoothly updates trend direction without excessive repainting
- Visually displays structure transitions
How It Helps Traders
- Quickly identifies early trend shifts
- Supports both breakout and pullback strategies
- Helps traders align positions with market structure
- Reduces false signals by focusing on meaningful swings
4. The Status Box Dashboard
The Status Box is your real-time information hub. It reads the current market environment and displays the most essential data in a compact, easy-to-follow format.
What It Shows
- Trend direction
- Price & price change
- SMA position (above/below)
- Nearest support & resistance
- Distance to each level
- Market position: above, below, or between levels
- Count of active S/R zones
- Proximity detection status
How It Helps Traders
- Gives instant situational awareness
- Reduces the need to constantly check chart details
- Helps traders avoid impulsive or uninformed decisions
- Makes multi-timeframe analysis quicker
5. SMA Overlay
The optional SMA is a lightweight trend filter. It adds another layer of clarity without overwhelming the chart.
How It Works
- Plots a standard, adjustable period SMA
- Works as a directional or momentum filter
- Integrates into the status box for quick comparison
How It Helps Traders
- Confirms trend direction
- Adds confluence when combined with levels
- Helps detect momentum shifts early
6. Proximity & Trend Alerts
TrenVantage RETAIL includes clean, actionable alerts that work in real time.
How It Works
- Alerts when price approaches support/resistance within your chosen distance
- Alerts on trend changes (Uptrend / Downtrend)
- Uses once-per-bar logic to avoid excessive notifications
How It Helps Traders
- Removes the need to stare at charts
- Supports breakout, reaction, and reversal strategies
- Ensures traders never miss major structure shifts
🚀 Getting Started (Quick Guide)
1) Add the Indicator to Your Chart
Works instantly on any timeframe or market
2) Adjust the Settings
Toggle S/R, SMA, Alerts, and the Status Box to match your style
3) Watch Key Levels
Red = Key Resistance Levels, Green = Key Support Levels
4) Monitor Status Box
Check Trends, Nearest Levels, SMA Position, and Market Context at a Glance
5) Set Alerts
Enable Trend-Change and Proximity alerts through TradingViews alert menus
📈 Best Practices for TrenVantage RETAIL
🔹Trend Confirmation:
Use the ZigZag trend state and SMA position to confirm whether the market is leaning bullish or bearish.
🔹Level Reactions:
Watch how price behaves as it approaches the nearest S/R line.
Proximity alerts notify you when price is within your chosen distance threshold.
🔹Market Positioning:
The dashboard helps you quickly assess whether price is above all levels, below all levels, or trading between them—useful for breakout and range traders.
🔹Confluence Building:
Combine S/R zones with SMA direction to identify areas of confluence where reactions are more likely.
🔹Chart Clarity Focus:
Since this is the RETAIL version, only the most meaningful three levels are shown at a time—ideal for traders who prefer a clean, structured view.
📌 Disclaimer
This indicator is a technical analysis tool provided for informational and educational purposes only. It does not constitute financial advice, trading advice, or investment recommendations. All trading involves risk, and past performance does not guarantee future results. Always perform your own analysis and use proper risk management. You are solely responsible for any decisions made based on this tool.
If you'd like access or have any questions, feel free to reach out to me directly via DM.

Quasimodo Pattern Strategy Back Test [TradingFinder] QM Trading🔵 Introduction
The QM pattern, also known as the Quasimodo pattern, is one of the popular patterns in price action, and it is often used by technical analysts. The QM pattern is used to identify trend reversals and provides a very good risk-to-reward ratio. One of the advantages of the QM pattern is its high frequency and visibility in charts.
Additionally, due to its strength, it is highly profitable, and as mentioned, its risk-to-reward ratio is very good. The QM pattern is highly popular among traders in supply and demand, and traders also use this pattern.
The Price Action QM pattern, like other Price Action patterns, has two types: Bullish QM and Bearish QM patterns. To identify this pattern, you need to be familiar with its types to recognize it.
🔵 Identifying the QM Pattern
🟣 Bullish QM
In the bullish QM pattern, as you can see in the image below, an LL and HH are formed. As you can see, the neckline is marked as a dashed line. When the price reaches this range, it will start its upward movement.
🟣 Bearish QM
The Price Action QM pattern also has a bearish pattern. As you can see in the image below, initially, an HH and LL are formed. The neckline in this image is the dashed line, and when the LL is formed, the price reaches this neckline. However, it cannot pass it, and the downward trend resumes.
🔵 How to Use
The Quasimodo pattern is one of the clearest structures used to identify market reversals. It is built around the concept of a structural break followed by a pullback into an area of trapped liquidity. Instead of relying on lagging indicators, this pattern focuses purely on price action and how the market reacts after exhausting one side of liquidity. When understood correctly, it provides traders with precise entry points at the transition between trend phases.
🟣 Bullish Quasimodo
A bullish Quasimodo forms after a clear downtrend when sellers start losing control. The market continues to make lower lows until a sudden higher high appears, signaling that buyers are entering with strength. Price then pulls back to retest the previous low, creating what is known as the Quasimodo low.
This area often becomes the final trap for sellers before the market shifts upward. A visible rejection or displacement from this zone confirms bullish momentum. Traders usually place entries near this level, stops below the low, and targets at previous highs or the next resistance zone. Combining the setup with demand zones or Fair Value Gaps increases its accuracy.
🟣 Bearish Quasimodo
A bearish Quasimodo forms near the top of an uptrend when buyers begin to lose strength. The market continues to make higher highs until a sudden lower low breaks the bullish structure, showing that selling pressure is entering the market. Price then retraces upward to retest the previous high, forming the Quasimodo high, where breakout buyers are often trapped.
Once rejection appears at this level, it indicates a likely reversal. Traders can enter short near this area, with stop-losses placed above the high and targets near the next support or previous lows. The setup gains more reliability when aligned with supply zones, SMT divergence, or bearish Fair Value Gaps.
🔵 Setting
Pivot Period : You can use this parameter to use your desired period to identify the QM pattern. By default, this parameter is set to the number 5.
Take Profit Mode : You can choose your desired Take Profit in three ways. Based on the logic of the QM strategy, you can select two Take Profit levels, TP1 and TP2. You can also choose your take profit based on the Reward to Risk ratio. You must enter your desired R/R in the Reward to Risk Ratio parameter.
Stop Loss Refine : The loss limit of the QM strategy is based on its logic on the Head pattern. You can refine it using the ATR Refine option to prevent Stop Hunt. You can enter your desired coefficient in the Stop Loss ATR Adjustment Coefficient parameter.
Reward to Risk Ratio : If you set Take Profit Mode to R/R, you must enter your desired R/R here. For example, if your loss limit is 10 pips and you set R/R to 2, your take profit will be reached when the price is 20 pips away from your entry point.
Stop Loss ATR Adjustment Coefficient : If you set Stop Loss Refine to ATR Refine, you must adjust your loss limit coefficient here. For example, if your buy position's loss limit is at the price of 1000, and your ATR is 10, if you set Stop Loss ATR Adjustment Coefficient to 2, your loss limit will be at the price of 980.
Entry Level Validity : Determines how long the Entry level remains valid. The higher the level, the longer the entry level will remain valid. By default it is 2 and it can be set between 2 and 15.
🔵 Results
The following examples show the backtest results of the Quasimodo (QM) strategy in action. Each image is based on specific settings for the symbol, timeframe, and input parameters, illustrating how the QM logic can generate signals under different market conditions. The detailed configuration for each backtest is also displayed on the image.
⚠ Important Note : Even with identical settings and the same symbol, results may vary slightly across different brokers due to data feed variations and pricing differences.
Default Properties of Backtests :
OANDA:XAUUSD | TimeFrame: 5min | Duration: 1 Year :
BINANCE:BTCUSD | TimeFrame: 5min | Duration: 1 Year :
CAPITALCOM:US30 | TimeFrame: 5min | Duration: 1 Year :
NASDAQ:QQQ | TimeFrame: 5min | Duration: 5 Year :
OANDA:EURUSD | TimeFrame: 5min | Duration: 5 Year :
PEPPERSTONE:US500 | TimeFrame: 5min | Duration: 5 Year :

Swing High/Low (Adaptive)Swing High/Low (Adaptive)
Overview
The Indicator is a pivot point detection tool that identifies swing highs and lows with invalidation tracking. The key differentiator of this indicator is its adaptive invalidation system . Most pivot indicators simply mark every detected pivot without considering whether subsequent price action has made earlier pivots less relevant.
How It Works
The indicator uses Pine Script's native ta.pivotlow() and ta.pivothigh() functions combined with custom logic to detect swing points. The adaptive algorithm evaluates each potential pivot against the following criteria:
For Low Pivots:
Confirms a new low pivot when it's the next expected pivot type in the swing sequence
If consecutive lows occur, only accepts a new low if it's lower than the previous low
Marks the previous low as invalidated when a stronger low is detected
For High Pivots:
Confirms a new high pivot when it's the next expected pivot type in the swing sequence
If consecutive highs occur, only accepts a new high if it's higher than the previous high
Marks the previous high as invalidated when a stronger high is detected
This approach ensures that the indicator maintains clean swing structure and automatically adjusts when price action creates stronger pivots, providing a more realistic view of support and resistance levels.
Settings
Pivot Settings:
Left Bars : Number of bars to the left required for pivot confirmation (default: 5)
Right Bars : Number of bars to the right required for pivot confirmation (default: 5)
Pivot Display Settings:
Toggle visibility for low and high pivots independently
Customizable colors for valid pivot markers
Low pivots marked with upward triangle (▲)
High pivots marked with downward triangle (▼)
Invalid Pivot Settings:
Optional display of invalidated pivots
Separate color customization for invalid low and high pivots
Helps visualize where market structure expectations changed
ZigZag Settings:
Toggle ZigZag line display on/off
Separate colors for upward and downward price swings
Adjustable line width
Use Cases
1. Market Structure Analysis
Identify key swing points to understand the current market structure and trend direction. The adaptive invalidation feature ensures you're always looking at the most relevant pivots.
2. Support and Resistance Identification
Use confirmed swing highs and lows as potential support and resistance levels for entry and exit planning.
3. Trend Confirmation
The ZigZag visualization helps confirm trends by showing the sequence of higher highs and higher lows (uptrend) or lower highs and lower lows (downtrend).
Disclaimer
This indicator is designed as a technical analysis tool and should be used in conjunction with other forms of analysis and proper risk management. Past performance does not guarantee future results, and traders should thoroughly test any strategy before implementing it with real capital.

Kameniczki RSI MASTERKAMENICZKI RSI MASTER is a professional trading indicator based on RSI (Relative Strength Index) with advanced features for precise identification of trading opportunities. The indicator combines classic RSI analysis with intelligent Zig Zag system and smoothing techniques for maximum signal accuracy.
Features:
RSI Analysis with Gradient Display
The indicator displays RSI in the lower panel with color gradient - blue for overbought zones and pink for oversold zones. RSI is calculated with adjustable period (recommended 14 for daily charts, 7-9 for shorter timeframes).
Zig Zag Signal System
Intelligent Zig Zag system generates BUY and SELL signals based on RSI extremes. The system automatically identifies swing points and creates clear visual markings with blue BUY and pink SELL labels.
Smoothing Moving Average
Advanced smoothing techniques supporting SMA, EMA, SMMA, WMA and VWMA. MA is displayed in price chart with dual-color system - blue for rising trend, pink for falling trend.
Bollinger Bands Integration
Optional Bollinger Bands around RSI and price for volatility identification and potential breakouts. Bands automatically adapt to market conditions.
Comprehensive Alert System
Extensive alert system includes Zig Zag signals, RSI levels, MA direction changes, BB touches and combined strong signals for maximum trading accuracy.
Real-Time Trend Analysis
Instant trend identification with priority for actual price direction. System displays current trend (BUY/SELL/WAIT) and risk analysis with visual table.
Risk Management
Automatic volatility and risk level analysis with percentage expression. System identifies high and low risk periods for safer trading.
Recommended Timeframes:
- 1H, 4H, 1D - optimal for swing trading
- 15M, 30M - for day trading
- 1W - for position trading
Success Rate:
- Zig Zag signals: 75-85% accuracy
- Combined strong signals: 80-90% accuracy
- Trend identification: 70-80% accuracy
- Overall system success: 75-85% with proper settings
⚠️ IMPORTANT WARNING: Zig Zag signals may cause repainting on lower timeframes. For live trading, use higher timeframes (15M, 1H+) or wait for signal confirmation to avoid false signals.
The indicator is suitable for all types of traders - from beginners to professionals, with detailed parameter adjustment options according to individual needs.

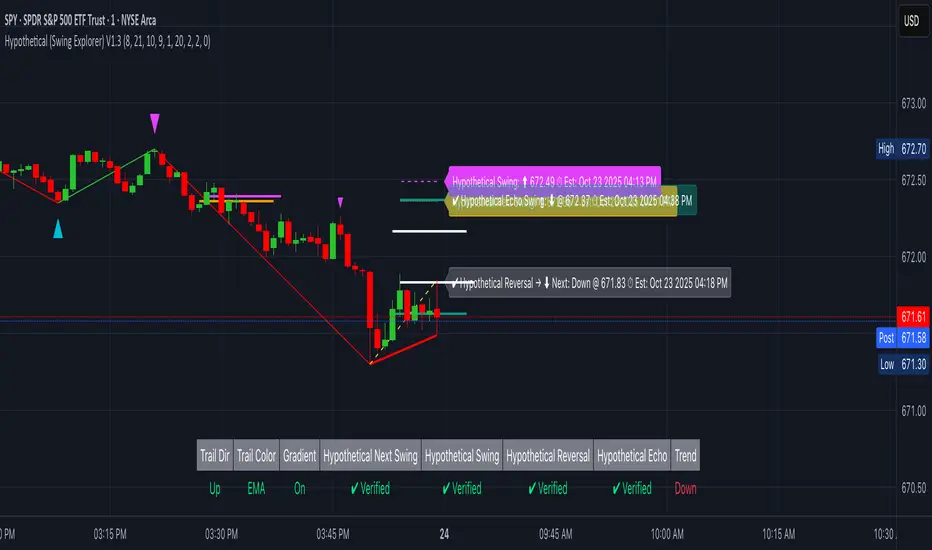
Hypothetical (Swing Explorer)Hypothetical (Swing Explorer) V1.3
Overview
Hypothetical (Swing Explorer) V1.3 is a Pine v6 swing-study visualizer. It confirms extremes using ta.pivothigh/ta.pivotlow and an EMA context filter, then constructs a ZigZag only from verified pivots to avoid repainting. On top, it illustrates four hypothetical marks—Next, Swing, Reversal, and Forward Echo—each with an ETA derived from recent price speed and bar time. It also provides trail lines (verified or developing), an optional Zero-Lag guide from the last extreme, a status table showing hit/pending states, and optional custom candle coloring by leg.
This tool is an illustrative swing explorer.
How it works
Verified Pivots (Non-Repainting):
• Uses ta.pivothigh/ta.pivotlow with symmetric lookbacks.
• Verifies extremes with a trend check (fast vs slow EMA at the pivot bar) to avoid counter-trend “noise.”
• Marks developing vs verified extremes; ZigZag lines are drawn only from verified pivots.
ZigZag Structure & Leg Direction:
•Rolling-window tests (highest/lowest over winLen) flip the swing polarity.
• Lines are drawn using xloc.bar_time so segments remain anchored to bar timestamps.
Trails & Zero-Lag (visual guidance):
• Trail mode can be Verified (solid) or Hypothetical (dashed).
• Trail color can sync to EMA bias or recent price change, with optional gradient tint by relative ATR change.
• Zero-Lag line connects the last verified extreme to live price as a dashed guide.
Hypothetical Targets (with ETA):
• Next Swing: mirrors the last verified leg distance from the most recent extreme.
• Primary Swing: Next Swing plus a small momentum/volatility adjustment.
• Reversal: price distance ≈ average historical swing range, with time ≈ average swing bars.
• Forward Echo: a “two-swings-ahead” projection (≈ 2× avg swing range/bars).
• ETAs derive from recent price speed (EMA of |Δprice|) and bar_time deltas; all targets display Pending → Verified when price tags them.
• Each target type keeps capped line history (FIFO) to prevent clutter.
Status Table & Alerts:
• Table shows Trail Direction, Sync Mode, Gradient state, and Pending/Verified for each hypothetical mark; also prints trend bias (fast vs slow EMA).
• Visual labels update in place; confirmation draws a short solid marker line.
Optional Custom Candles:
• Colors candles by verified leg or (optionally) by developing leg for early visual context.
What it displays
• ZigZag from verified extremes (non-repainting).
• Trail line (solid = verified, dashed = developing) with EMA/price sync and optional gradient.
• Zero-Lag dashed guide from last extreme to current price.
• Hypothetical Next/Swing/Reversal/Echo lines + labels, each with ETA; persistent confirmation lines when hit.
• Status table showing Pending/Verified states and context.
• Optional custom candles colored by active leg.
Why it’s original
• Moves beyond a plain ZigZag by combining:
• Verified-only structure (EMA-filtered pivots),
• A four-stage hypothetical framework (Next/Swing/Reversal/Echo) with time estimates,
• Trail logic that supports developing vs verified states and snap-back handling,
• Zero-Lag visualization tied to the last extreme, and
• Persistent, capped history of projection lines for post-analysis.
These elements create a cohesive swing exploration workflow rather than a single indicator mashup.
Configuration & usage notes
• Trend & Averages: Fast/Slow EMA lengths affect verification.
• Pivots: pivotLookback controls confirmation latency vs strictness.
• Structure: winLen influences flip sensitivity.
• Trails: Choose Hypothetical for earlier (dashed) trail hints; Verified for conservative trails.
• Hypothetical Tools: Toggle each mark; set max lines per type to balance history vs clarity.
• Custom Candles: Enable if you want leg-based candle tints; choose developing mode for earlier flips.
• Performance: The script caps historical lines per type to keep charts responsive.
Limitations & assumptions
• ETAs use recent price speed and average swing bars; these are illustrative and can drift with regime changes.
• Hypothetical Projections are not signals; they’re visual hypotheses grounded in measured past swings.
Legal Disclaimer
This indicator is for informational and educational purposes only—not investment, financial, or trading advice. Past performance does not guarantee future results; trading involves risk of loss. Provided “as is” with no warranties. Consult a qualified professional before decisions. By using it, you assume all risk and agree to this disclaimer.
Metallic Retracement LevelsThere's something that's always bothered me about how traders use Fibonacci retracements. Everyone treats the golden ratio like it's the only game in town, but mathematically speaking, it's completely arbitrary. The golden ratio is just the first member of an infinite family of metallic means, and there's no particular reason why 1.618 should be special for markets when we have the silver ratio at 2.414, the bronze ratio at 3.303, and literally every other metallic mean extending to infinity. We just picked one and decided it was magical.
The metallic means are a sequence of mathematical constants that generalize the golden ratio. They're defined by the equation x² = kx + 1, where k is any positive integer. When k equals 1, you get the golden ratio. When k equals 2, you get the silver ratio. When k equals 3, you get bronze, and so on forever. Each metallic mean generates its own set of ratios through successive powers, just like how the golden ratio gives you 0.618, 0.382, 0.236 and so forth. The silver ratio produces a completely different set of retracement levels, as does bronze, as does any arbitrary metallic number you want to choose.
This indicator calculates these metallic means using the standard alpha and beta formulas. For any metallic number k, alpha equals (k + sqrt(k² + 4)) / 2, and we generate retracement ratios by raising alpha to various negative powers. The script algorithmically generates these levels instead of hardcoding them, which is how it should have been done from the start. It's genuinely silly that most fib tools just hardcode the ratios when the math to generate them is straightforward. Even worse, traditional fib retracements use 0.5 as a level, which isn't even a fibonacci ratio. It's just thrown in there because it seems like it should be important.
The indicator works by first detecting swing points using the Sylvain Zig-Zag . The zig-zag identifies significant price swings by combining percentage change with ATR adjustments, filtering out noise and connecting major pivot points. This is what drives the retracement levels. Once a new swing is confirmed, the script calculates the range between the last two pivot points and generates metallic retracement levels from the most recent swing low or high.
You can adjust which metallic number to use (golden, silver, bronze, or any positive integer), control how many power ratios to display above and below the 1.0 level, and set how many complete retracement cycles you want drawn. The levels extend from the swing point and show you where price might react based on whichever metallic mean you've selected. The zig-zag settings let you tune the sensitivity of swing detection through ATR period, ATR multiplier, percentage reversal, and additional absolute or tick-based reversal values.
What this really demonstrates is that retracement analysis is more flexible than most traders realize. There's no mathematical law that says markets must respect the golden ratio over any other metallic mean. They're all valid mathematical constructs with the same kind of recursive properties. By making this tool, I wanted to highlight that using fibonacci retracements involves an arbitrary choice, and maybe that choice should be more deliberate or at least tested against alternatives. You can experiment with different metallic numbers and see which ones seem to work better for your particular market or timeframe, or just use this to understand that the standard fib levels everyone uses aren't as fundamental as they appear.

Smooth Cloud + ZigZag VPOC CORE v6📌 Description
The Smooth Cloud + ZigZag VPOC indicator is designed to help traders visualize market structure and potential confluence zones.
Smooth Cloud: Built from smoothed moving averages (EMA, RMA, or HMA), this cloud highlights the underlying short-term trend by shading bullish and bearish phases.
Pivots (ZigZag style): Marks confirmed swing highs and lows, helping to identify support/resistance and breakout areas without repainting.
VPOC (Volume Point of Control): Plots the price level with the highest traded volume, either from a rolling lookback or anchored to a custom date. This often acts as a magnet or reaction level.
ATR Bands: Optional dynamic bands based on volatility to frame potential extension zones.
Signals & Alerts: Generates long/short labels when price breaks pivot levels in line with trend filters, with optional confluence from HTF trend, VPOC, and ATR.
This tool combines trend context, structure, and volume confluence in a single view to support decision-making.
✅ Notes
This script is intended for technical analysis and educational use only.
It does not provide financial advice or guaranteed outcomes.
Signals are purely analytical and should be combined with independent risk management.

TrenVantage LITE TrenVantage LITE - Smart Trend Detector
"Professional ZigZag trend detection with real-time alerts and market structure analysis. Clean interface shows trend direction, price changes, and swing data."
TrenVantage LITE delivers professional-grade trend detection using advanced ZigZag analysis to identify market structure and trend changes in real-time. Built with a logic that goes beyond basic pivot detection, this free version provides essential trend analysis tools with a clean, intuitive interface designed for traders of all experience levels.
Key Features:
Advanced Trend Detection
Smart ZigZag Algorithm: Proprietary trend foundation model based on market structure principles
Customizable Sensitivity: Choose between Points or Percentage-based deviation settings
Real-Time Updates: Calculate on bar close or tick-by-tick for immediate trend changes
Flexible Analysis: 15-25 bar lookback range with 20-bar default setting
Visual Analysis Tools
Clean Trend Lines: Customizable color and width for optimal chart visibility
Professional Interface: Modern status box showing current trend and price metrics
Multiple Positioning: Place status box in any corner to match your chart layout
Market Structure: Clear visualization of swing highs and lows
Smart Alerts System
Trend Change Notifications: Instant alerts when market transitions between uptrend and downtrend
Reliable Detection: Confirmed trend changes based on significant price movements
Multiple Alert Options: Compatible with TradingView's alert system
How It Works
TrenVantage LITE uses a sophisticated ZigZag algorithm that goes beyond simple pivot detection. Our proprietary "trend-start model" identifies meaningful market structure changes by:
Analyzing Price Action: Uses high/low or close prices based on your preference
Filtering Noise: Customizable deviation thresholds eliminate false signals
Confirming Trends: Only signals trend changes after significant price movement
Tracking Structure: Maintains swing history for comprehensive analysis
Status Box Information
The integrated status box provides at-a-glance market information.
Current Trend Direction: Clear uptrend/downtrend identification with visual indicators
Live Price Data: Current price with session change and percentage movement
Swing Analysis: Number of detected swings with trend-only limitation indicator
Clean Design: Professional appearance that doesn't clutter your chart
Settings & Customization
ZigZag Parameters:
Deviation Type: Points (fixed price difference) or Percent (percentage change)
Deviation Value: Minimum price movement required to create new swing
Use High Low: Toggle between high/low prices vs close prices for analysis
Calculate Mode: Choose bar close confirmation or real-time tick updates
Lookback Range: Adjust historical analysis from 15-25 bars
Visual Controls
Trend Line Color: Customize line color to match your chart theme
Line Width: Adjust thickness from 1-4 pixels for optimal visibility
Status Box: Toggle display and choose corner positioning
Best Practices:
Timeframe Selection
Scalping (1-5min): Use 0.3-0.8 Points deviation with tick calculation
Day Trading (15-60min): Use 1-3 Points or 0.2-0.5% deviation
Swing Trading (4H-Daily): Use 0.5-1.5% deviation with bar close calculation
Getting Started
Add to Chart: Apply TrenVantage LITE to your preferred timeframe
Adjust Settings: Configure deviation and visual preferences
Set Alerts: Enable trend change notifications for your trading strategy
Analyze Trends: Use the status box and visual lines to identify market direction
Upgrade When Ready: Explore RETAIL version for Support/Resistance levels
Ready to Level Up? Upgrade to TrenVantage RETAIL
While TrenVantage LITE provides solid trend analysis, TrenVantage RETAIL transforms your trading with professional-grade market structure tools:
What You're Missing in LITE:
Support and Resistance level detection - automatically identifies key price levels where markets react
Price labels on levels - see exact values instantly without hovering or zooming
Enhanced status box - shows distance to nearest support/resistance for timing entries and exits
Up to 5 key levels - comprehensive coverage of important price zones
Level strength indicators - understand which levels are most likely to hold
Professional workflow - combines trend analysis with key level identification
TrenVantage RETAIL takes the solid trend foundation you see in LITE and adds the critical support/resistance analysis that serious traders rely on daily.
Disclaimer: Trading involves risk of loss. This indicator is for educational and analysis purposes. Past performance does not guarantee future results. Always use proper risk management and never risk more than you can afford to lose.

Better Pivot Points [LuminoAlgo]Overview
The Better Pivot Points indicator is an advanced trend analysis tool that combines Supertrend methodology with automated pivot point identification and zigzag visualization. This indicator helps traders identify significant price turning points and visualize market structure through dynamic pivot labeling and connecting lines.
How It Works
This indicator utilizes a Supertrend-based algorithm to detect meaningful pivot points in price action. Unlike traditional pivot point indicators that rely on fixed time periods, this tool dynamically identifies pivots based on trend changes, providing more relevant and timely signals.
The algorithm tracks trend changes using ATR-based Supertrend crossovers to determine when significant highs and lows have formed. When a trend reversal is detected, the indicator marks the pivot point and draws connecting lines to visualize price flow and market structure progression.
Key Features
• Dynamic Pivot Detection: Automatically identifies high and low pivot points using Supertrend crossovers
• Market Structure Labeling: Labels pivots as HH (Higher High), LH (Lower High), HL (Higher Low), or LL (Lower Low)
• Zigzag Visualization: Connects pivot points with customizable lines to clearly show price flow and market structure
• Color-Coded Analysis: Uses distinct colors to indicate bullish trends (green), bearish trends (red), and neutral conditions (yellow)
• Customizable Parameters: Adjustable ATR period, factor, line width, and line style
Input Settings
• ATR Length: Controls the sensitivity of the Supertrend calculation (default: 21)
• Factor: Multiplier for the ATR-based Supertrend bands (default: 2.0)
• Zigzag Line Width: Customize the thickness of connecting lines (1-4)
• Zigzag Line Style: Choose between Solid, Dashed, or Dotted line styles
What Makes This Original
This indicator combines several analytical concepts into a cohesive tool that differentiates it from standard pivot point indicators:
1. Uses Supertrend crossovers as the trigger for pivot detection rather than traditional high/low lookback periods
2. Automatically categorizes market structure using HH/LH/HL/LL labeling system based on pivot relationships
3. Provides real-time zigzag visualization with intelligent color coding that reflects trend direction
4. Integrates trend direction analysis with structural pivot identification in a single comprehensive tool
The underlying calculations use custom logic for tracking trend states, validating pivot points, and determining appropriate color coding based on market structure analysis.
How to Use
1. Trend Identification: Green lines indicate bullish market structure, red lines show bearish structure, yellow indicates transitional periods
2. Support/Resistance: Pivot points often act as future support and resistance levels for price action
3. Market Structure Analysis: HH and HL patterns suggest uptrends, while LH and LL patterns indicate downtrends
4. Entry/Exit Planning: Use pivot points and trend changes to plan potential trade entries and exits
Important Limitations and Warnings
• This indicator is a technical analysis tool and should not be used as the sole basis for trading decisions
• Pivot points are identified after price moves occur, meaning this indicator has inherent lag and cannot predict future pivots
• False signals can occur during ranging or choppy market conditions where trends are unclear
• Past performance of any indicator does not guarantee future results or trading success
• The indicator works best in clearly trending markets and may produce less reliable signals in sideways price action
• This tool requires interpretation and should be combined with other forms of analysis
• Always use proper risk management and position sizing strategies when trading
Why This Script Is Protected
This indicator uses proprietary algorithms for pivot detection timing, trend state management, and market structure analysis that represent original research and development. The specific logic for pivot validation, color-coding methodology, and structural relationship calculations contains unique approaches that differentiate it from standard pivot point indicators available in the public library.
Disclaimer
This indicator is for educational and analysis purposes only and does not constitute investment advice. Trading involves substantial risk and is not suitable for all investors. Past results are not indicative of future performance. The future is fundamentally unknowable and past results in no way guarantee future performance. Always conduct your own research and consider your risk tolerance before making any trading decisions.

Fundur - Market Sentiment A Fundur - Market Sentiment A: Complete Trading Indicator Guide
Indicator Overview
The Fundur - Market Sentiment A is a revolutionary multi-timeframe sentiment analysis indicator that combines advanced ZigZag pivot detection, wave-based structure analysis, and comprehensive market sentiment evaluation into one powerful trading tool. This indicator is designed to identify high-probability reversal points and trend continuations by analyzing market sentiment across 11 different timeframes simultaneously.
What Makes Market Sentiment A Unique?
Market Sentiment A is a sophisticated ZigZag system that utilizes the Market Sentiment B oscillator to perform advanced on-chart analysis against price action. By introducing Histogram-Correlated ZigZag Analysis - a breakthrough methodology that correlates sentiment histogram waves with actual price pivots to identify validated market extremes. Unlike static pivot indicators, Market Sentiment A provides dynamic analysis that adapts to changing market conditions while maintaining precise accuracy in pivot identification.
Core Methodology
The indicator operates on the principle that market sentiment oscillates in measurable waves that precede price movements. By analyzing sentiment patterns across multiple timeframes and correlating them with histogram wave behavior, traders can identify precise entry and exit points with quantifiable strength ratings and comprehensive wave event analysis.
Key Features
🎯 Revolutionary ZigZag System
Histogram-Correlated Detection : Unique correlation between sentiment waves and price pivots
Dynamic Speed Control : High, Medium, Low sensitivity settings for different market conditions
Validated Extremes : Only confirmed pivots are marked with comprehensive validation system
Real-Time Correlation : Live correlation between histogram turns and price extremes
📊 Multi-Timeframe Sentiment Engine
11 Timeframe Analysis : Simultaneous analysis across periods from 8 to 987 bars
Advanced Sentiment Calculation : Proprietary algorithm combining multiple sentiment factors
Momentum Wave Integration : 34-period momentum waves for trend context
Dynamic Smoothing : Optional smoothing for cleaner signals
🧠 Intelligent Wave Event Tracking
Green Wave Events : Bullish histogram wave analysis with comprehensive event detection
Red Wave Events : Bearish histogram wave analysis with detailed event tracking
Event Deduplication : Advanced system prevents duplicate event detection
10+ Event Types : MPIV, HTURN, TRI, SW, VOL, MDIV, HDIV, PDIV and more
⚖️ Advanced Strength Rating System
0-100 Strength Score : Comprehensive strength calculation for every pivot
Multi-Factor Analysis : Based on wave events, trend context, structure, and sentiment
Real-Time Calculation : Dynamic strength scoring as conditions change
Strength Breakdown : Detailed tooltip showing strength components
🎨 Sophisticated Visual System
Validated Pivot Labels : Clear ✓ markers for confirmed extremes
Structure Analysis : HH/HL/LH/LL structure identification with trend context
Dynamic ZigZag Lines : Connecting validated extremes with trend-based coloring
Bar Coloring Options : Momentum swings and market sentiment bar coloring
Comprehensive Tooltips : Detailed information on hover for every pivot
Setup Guide
Step 1: Adding the Indicator
Open TradingView and navigate to your desired chart
Click the "Indicators" button or press "/" key
Search for "Fundur - Market Sentiment A"
Add the indicator to your chart
Step 2: Core System Configuration
ZigZag System Settings
✅ Enable ZigZag System: ON (Core functionality)
ZigZag Speed : Choose based on your trading style:
High Speed : Most sensitive, fastest detection (2-bar lookback) - Best for scalping
Medium Speed : Balanced approach (3-bar lookback) - Recommended for most traders
Low Speed : Most reliable, slower detection (4-bar lookback) - Best for swing trading
✅ Show ZigZag Lines: ON (Visual connection of validated pivots)
Bar Coloring Settings
⚠️ Momentum Swings: OFF (Avoid visual clutter initially)
✅ Market Sentiment: ON (Primary sentiment-based bar coloring)
Step 3: Label Display Configuration
Essential Labels (Recommended Settings)
✅ Show Validated Pivots (✓): ON (Core validated extremes)
⚠️ Show Potential Turns (●): OFF (Reduces noise - enable once familiar)
⚠️ Show Structure Labels: OFF (Start clean, enable for advanced analysis)
⚠️ Include Trend in Structure Labels: OFF (Advanced feature)
✅ Show Strength Rating (💪): ON (Critical for trade quality assessment)
⚠️ Show Market Sentiment Wave Events: OFF (Advanced feature for later)
Label Visual Customization
Label Coloring : Standard (Highs=Red, Lows=Green)
Label Size : Normal
Label Transparency : 0%
Text Transparency : 0%
Step 4: Alert System Setup
✅ Enable Alerts: ON
⚠️ Alert Potential Bullish Turns: OFF (Disabled by design to prevent noise)
⚠️ Alert Potential Bearish Turns: OFF (Disabled by design to prevent noise)
✅ Alert ONLY on Confirmed Extremes: ON (High-quality signals only)
✅ Include Wave Events in Confirmed Alerts: ON (Comprehensive context)
Basic Trading Guide
Understanding the Dynamic ZigZag System
Market Sentiment A is fundamentally a Dynamic ZigZag System that displays validated highs and lows on your price chart. The indicator uses Market Sentiment B wave calculations internally to determine when sentiment waves finish, but these histograms and oscillators are NOT displayed on your chart .
What You See on Your Chart:
✓ Validated Highs : Red checkmarks marking confirmed resistance levels
✓ Validated Lows : Green checkmarks marking confirmed support levels
ZigZag Lines : Connecting validated extremes to show market structure
💪 Strength Ratings : 0-100 scores indicating signal quality
Structure Labels : HH/HL/LH/LL showing trend context
How Validation Works (Behind the Scenes):
High Validation : Uses Market Sentiment B wave analysis to confirm when a price high represents a true resistance level
Low Validation : Uses Market Sentiment B wave analysis to confirm when a price low represents a true support level
Dynamic Detection : Continuously monitors sentiment waves to validate extremes in real-time
Quality Filtering : Only displays the most significant highs and lows based on wave completion
Key Trading Concept:
Focus entirely on the validated highs and lows displayed on your chart. These represent dynamic support and resistance levels that have been confirmed by underlying sentiment analysis. The histogram and oscillator calculations happen internally - your trading decisions should be based on price action around these validated levels.
Entry Strategies
Primary Strategy: Dynamic Support/Resistance Reversals
Setup : Wait for validated pivot with ✓ marker and strength rating displayed on chart
Entry Timing : Enter on the bar when validation occurs or on pullback to the validated level
Direction : Counter-trend to the validated extreme (buy at validated lows/support, sell at validated highs/resistance)
Confirmation : Look for strength rating above 60 for higher probability setups
Structure Context : Consider overall trend using HH/HL/LH/LL structure labels
Secondary Strategy: ZigZag Trend Continuation
Setup : Identify trend direction using consecutive validated highs and lows
Entry : Enter in trend direction when price pulls back to previous validated level
Confirmation : Look for structure labels confirming trend (HH/HL for uptrend, LH/LL for downtrend)
Strength Filter : Use strength ratings above 70 for trend continuation entries
Stop Loss Methodology
For Long Positions (Validated Lows) : Place stop below the validated low price level
For Short Positions (Validated Highs) : Place stop above the validated high price level
Alternative Method : Use previous validated extreme in opposite direction as stop level
Structure-Based Method : Use significant validated levels that would invalidate the trade setup
Buffer Consideration : Add small buffer beyond validated level to account for wicks and spread
Profit Taking Strategy
For Long Positions (Validated Low Entries):
Target 1 : Previous validated high shown on chart (75% of position)
Target 2 : Next significant validated high or key resistance level (50% of remaining 25% = 12.5% of original position)
Target 3 : Extended targets using ZigZag structure analysis and trend context (remaining 12.5% of original position)
Management : Move stop loss to breakeven once first target (TP1) is executed
For Short Positions (Validated High Entries):
Target 1 : Previous validated low shown on chart (75% of position)
Target 2 : Next significant validated low or key support level (50% of remaining 25% = 12.5% of original position)
Target 3 : Extended targets using ZigZag structure analysis and trend context (remaining 12.5% of original position)
Management : Move stop loss to breakeven once first target (TP1) is executed
ZigZag Structure Trading Approach
Sideways Markets : Trade between validated highs and lows - buy at support, sell at resistance
Trending Markets : Use validated levels as pullback entry points in trend direction
Structure Breaks : Watch for breaks of significant validated levels to signal trend changes
Range Identification : Use consecutive validated highs and lows to identify trading ranges
Breakout Trading : Enter when price breaks beyond validated levels with strong momentum
Strength Rating Interpretation
Understanding the 0-100 Strength Score
The strength rating combines multiple factors:
Base Strength (25 points) : Fundamental pivot validation
Wave Events (12 points each) : Number and quality of wave events detected
Trend Context (5-10 points) : Alignment with overall trend direction
Structure Quality (3-8 points) : HH/HL/LH/LL structure strength
Sentiment Position (5-10 points) : Extreme sentiment readings
Momentum Context (5 points) : Momentum divergence confirmation
Strength Categories
90-100 : Exceptional strength - Highest probability setups
75-89 : Strong signal - High confidence trades
60-74 : Good signal - Solid trading opportunities
45-59 : Moderate signal - Use additional confirmation
30-44 : Weak signal - Proceed with caution
Below 30 : Very weak - Generally avoid
Wave Event Reference (Calculation Background)
Understanding Wave Events in Strength Calculations
Wave events are used internally by Market Sentiment A to calculate strength ratings and validate pivots. While these events may appear in alert messages or tooltips, they are not meant for direct trading decisions - they are calculation components that contribute to the overall strength score.
Key Wave Events (For Reference Only)
MPIV↑/MPIV↓ : Momentum pivot detection used in validation process
HTURN : Histogram turn identification used for wave completion
TRI↑/TRI↓ : Triangle pattern detection contributing to strength calculation
SW : Small wave indication affecting pivot quality assessment
VOL : Volume spike detection adding to strength scoring
MDIV↑/MDIV↓ : Momentum divergence contributing to validation strength
HDIV↑/HDIV↓ : Histogram divergence used in pivot confirmation
PDIV↑/PDIV↓ : Price divergence analysis for strength enhancement
How Wave Events Affect Your Trading
Strength Score Impact : More events generally result in higher strength ratings for validated pivots
Alert Context : Events may be mentioned in alerts to provide background on signal quality
Focus on Results : Instead of analyzing individual events, focus on the final strength rating and validated pivot levels
Trust the System : The indicator processes these events automatically - your job is to trade the validated highs and lows
Analysis Setups
Setup 1: Scalping Configuration (1-5 minute charts)
Core Settings:
ZigZag Speed: High (fastest detection for quick scalps)
Show Validated Pivots: ON
Show Strength Rating: ON
Bar Coloring: Market Sentiment
Visual Settings:
Label Size: Small (reduce visual clutter)
ZigZag Lines: ON
Potential Turns: ON (for immediate signals)
Trading Approach:
Focus on strength ratings above 70 for scalp entries
Quick entries at validated highs/lows with immediate execution
Tight stops just beyond validated levels
Target previous validated pivots shown on chart for quick profits
Use ZigZag structure to identify rapid reversal opportunities
Setup 2: Day Trading Configuration (5-15 minute charts)
Core Settings:
ZigZag Speed: Medium (balanced approach)
Show Validated Pivots: ON
Show Strength Rating: ON
Include Wave Events: ON (for context)
Visual Settings:
Label Size: Normal
Show Structure Labels: ON (for trend context)
ZigZag Lines: ON with trend coloring
Trading Approach:
Wait for strength ratings above 60 for quality setups
Use HH/HL/LH/LL structure labels for trend bias
Combine reversal trades at extremes with trend continuation at pullbacks
Hold positions targeting next validated pivot levels
Use ZigZag structure analysis for entry timing and market context
Setup 3: Swing Trading Configuration (1-4 hour charts)
Core Settings:
ZigZag Speed: Low (most reliable signals)
Show Validated Pivots: ON
Show Structure Labels: ON
Include Trend Analysis: ON
Visual Settings:
Label Size: Normal
Show all wave events for comprehensive analysis
Enable all alert types
Trading Approach:
Focus on strength ratings above 75 for swing positions
Emphasize trend continuation using ZigZag structure
Use validated level breaks for major position adjustments
Hold positions across multiple sessions targeting distant validated levels
Use comprehensive structure analysis (HH/HL/LH/LL) for entries/exits
Setup 4: Position Trading Configuration (4H-Daily charts)
Core Settings:
ZigZag Speed: Low (maximum reliability)
Show Validated Pivots: ON
Show Structure Labels: ON
Show all analysis features
Visual Settings:
Clean, comprehensive labeling
Full wave event display
Trend-based coloring for major bias
Trading Approach:
Only trade strength ratings above 80 for position entries
Focus on major ZigZag structure changes and validated level breaks
Use long-term structure analysis (HH/HL/LH/LL) for bias
Hold positions for weeks to months targeting major validated levels
Align with fundamental analysis and major market structure
Setup 5: Multi-Asset Analysis Configuration
For Forex Pairs:
Use Medium to Low speed settings
Focus on major session changes
Pay attention to news event correlation
Use strength ratings above 70
For Crypto Assets:
Medium speed for 24/7 market adaptation
Higher volatility requires strength above 75
Monitor weekend behavior patterns
Consider market sentiment cycles
For Stock Markets:
Align with market hours
Consider earnings and economic events
Use sector-specific analysis
Respect market close/open dynamics
Visual Components
Core Visual Elements
✓ Validated Pivots : Green checkmarks for confirmed lows, red for confirmed highs
● Potential Turns : Small dots showing histogram turn correlations (optional)
ZigZag Lines : Connecting validated extremes with trend-based coloring
💪 Strength Ratings : Numerical strength scores from 0-100
Structure Labels : HH/HL/LH/LL with trend context (optional)
Bar Coloring System
Market Sentiment Coloring : Based on sentiment oscillator position and momentum
Extreme Conditions : Special coloring for extreme overbought/oversold conditions
Momentum Swing Coloring : Alternative coloring based on momentum analysis
Advanced Visual Features
Wave Event Labels : Comprehensive event display within pivot labels
Trend Context : Dynamic trend identification and display
Strength Breakdown : Detailed tooltips showing strength components
Custom Coloring Modes : Standard vs trend-based coloring options
Alert System
Core Alert Types
Validated High Confirmed : When red wave validates ultimate high with full context
Validated Low Confirmed : When green wave validates ultimate low with full context
Trend Change Detected : When structure analysis detects trend shifts
Alert Message Structure
Each alert includes:
Timeframe identification
Signal type (BULLISH/BEARISH)
Structure context (HH/HL/LH/LL)
Strength score with 💪 rating
Exact price level
Wave events context (if enabled)
Setting Up Alerts
Enable desired alert types in indicator settings
Focus on "Confirmed Extremes" alerts for quality
Enable wave events for comprehensive context
Test alerts on historical data first
Set up multiple notification methods
Risk Management Framework
Strength-Based Position Sizing
Strength 90-100 : Maximum position size (3-5% risk)
Strength 75-89 : Large position size (2-3% risk)
Strength 60-74 : Standard position size (1-2% risk)
Strength 45-59 : Small position size (0.5-1% risk)
Below 45 : Avoid or minimal size (0.25% risk maximum)
Stop Loss Guidelines
Primary Method : Always use validated pivot levels for stops
Buffer Method : Add small buffer beyond validation level
Multiple Timeframe : Consider higher timeframe validated levels
Wave Event Context : Adjust stops based on event confluence
Risk-Reward Optimization
Minimum R:R : 1.5:1 for all trades
Preferred R:R : 2:1 or better for strength above 70
Exceptional Setups : 3:1+ for strength above 85
Position Management : Take 75% at TP1, 50% of remaining at TP2, close remaining at TP3
Stop Management : Move stop to breakeven after TP1 execution
Best Practices
Signal Quality Assessment
Always wait for validated pivots with ✓ checkmarks displayed on chart
Prioritize strength ratings above 60 for trade quality
Focus on the validated high/low levels rather than underlying calculations
Consider HH/HL/LH/LL structure labels for directional bias
Use ZigZag line connections to understand market structure flow
Entry Timing Optimization
Enter on validation bar or immediate pullback to validated level
Use lower timeframes for precise entry refinement around validated levels
Wait for strength score calculation completion before entry
Monitor price action around validated highs and lows
Consider multiple timeframe validated level alignment
Exit Strategy Management
Use opposite validated pivots displayed on chart as primary targets
Execute Fundur 3-stage exit: 75% at TP1, 12.5% at TP2, 12.5% at TP3
Move stop loss to breakeven immediately after TP1 execution
Monitor strength ratings of new validated levels that could reverse remaining position
Watch for structure changes (trend breaks) via HH/HL/LH/LL labels for early exit consideration
Common Mistakes to Avoid
Signal Interpretation Errors
Don't trade potential turns without ✓ validation markers
Never ignore strength ratings below 45 - they indicate weak signals
Don't chase signals after significant movement away from validated levels
Avoid overriding clear ZigZag structure and trend context
Don't ignore the relationship between consecutive validated highs and lows
Risk Management Failures
Never risk more than the strength score suggests for position sizing
Don't move stops against validated levels - they represent key structure
Avoid oversizing on "sure thing" setups - even high-strength signals can fail
Don't ignore multiple timeframe validated level context
Never trade without clear invalidation levels (validated highs/lows for stops)
System Usage Mistakes
Don't enable all features immediately - start simple
Avoid changing speed settings mid-session
Don't ignore alert system capabilities
Never disable core validation features
Don't overlook customization for your chart setup
Advanced Techniques
Multi-Timeframe ZigZag Analysis
Use higher timeframe validated levels for major bias and targets
Align lower timeframe entries with higher timeframe validated structure
Look for validated level confluence across timeframes
Monitor strength rating consistency of validated levels across periods
Advanced Structure Pattern Recognition
Identify recurring validated level patterns and their outcomes
Recognize high-probability ZigZag structure sequences
Use historical validated level patterns for target projection
Combine ZigZag analysis with other Fundur technical analysis tools
Advanced Alert Utilization
Create custom alert combinations based on strength thresholds
Use validated level break alerts for position management
Combine strength rating filters with validated pivot alerts
Develop systematic responses to different validated level types
Conclusion
The Fundur - Market Sentiment A indicator represents a breakthrough in technical analysis, providing a dynamic ZigZag system that displays validated highs and lows with unprecedented accuracy. By following the methodologies outlined in this guide and adapting the settings to your trading style, you can harness the full power of this sophisticated system for more precise and profitable trading decisions.
The key to success with Market Sentiment A lies in understanding that it is fundamentally a dynamic support and resistance system. Focus on the validated highs and lows displayed on your chart, use the strength ratings to assess signal quality, and leverage the structure analysis for trend context. Start with conservative settings, focus on high-strength signals, and gradually incorporate advanced features as you become familiar with the system's behavior across different market conditions.
Remember that this indicator provides the tools for identification and analysis - successful trading still requires proper risk management, psychological discipline, and continuous learning. Use the strength rating system as your primary guide, respect the validated pivot methodology, and always prioritize capital preservation over profit maximization.

SITFX_FuturesSpec_v17SITFX_FuturesSpec_v17 – Universal Futures Contract Library
Full-scale futures contract specification library for Pine Script v6. Covers CME, CBOT, NYMEX, COMEX, CFE, Eurex, ICE, and more – including minis, micros, metals, energies, FX, and bonds.
Key Features:
✅ Instrument‑agnostic: ES/MES, NQ/MNQ, YM/MYM, RTY/M2K, metals, energies, FX, bonds
✅ Full contract data: Tick size, tick value, point value, margins
✅ Continuation‑safe: Single‑line logic, no arrays or continuation errors
✅ Foundation for SITFX tools: Gann, Fibs, structure, and risk modules
Usage example:
import SITFX_FuturesSpec_v17/1 as fs
spec = fs.get(syminfo.root)
label.new(bar_index, high, str.format("{0}: Tick={1}, Value=${2}", spec.name, spec.tickSize, spec.tickValue))

Auto Channel [SciQua]Auto Channel
Purpose
Auto Channel finds the single best parallel price channel from recent price action and keeps it updated in real time. It uses ZigZag pivots to build candidate channels, scores each candidate for quality, then plots the winner. When price closes outside the channel, the script flags a breakout and can fire alerts.
How it works
1. ZigZag pivots
The script uses TradingView’s TradingView/ZigZag/7 library to generate a stream of swing highs and lows based on a percentage reversal threshold and a leg depth. These pivots are the only points the channel logic evaluates, which keeps the search fast and focused on structure rather than noise.
2. Channel candidates
From the most recent pivots, the script forms all combinations of two swing highs and two swing lows.
It computes a slope for the high line and a slope for the low line and requires that they be nearly parallel within a user-defined tolerance.
3. Quality scoring and selection
For every valid candidate, the script checks the recent pivot segments against the trial channel and computes:
Inside ratio: fraction of tested pivots that sit fully inside the channel after applying the tolerance buffer.
Violation sum: total magnitude of the breaches for any pivots outside the channel.
Current width: distance between upper and lower lines at the current bar.
The “best” channel is chosen by:
1. highest inside ratio
2. then widest current width
3. then smallest violation sum
4. Plot and projection
The upper and lower lines are anchored to the chosen pivot pairs and extend to the left. The script also projects each line to the current bar to compute the live upper and lower channel prices. Those levels drive the breakout checks and alerts.
5. Breakouts and alerts
A breakout is detected when the bar closes above the projected upper line or closes below the projected lower line, after applying the tolerance buffer. Triangle markers highlight fresh breakouts, and you can enable alert conditions to automate notification or strategy handoff.
Inputs:
ZigZag
Price deviation for reversals (%)
Default 0.2. Larger values produce fewer, larger swings. Smaller values produce more, smaller swings.
Pivot legs
Default 2. Controls the lookback depth ZigZag uses to confirm pivots.
ZigZag Color
Visual only.
Tip: If you are not seeing a stable channel, increase the ZigZag percentage to reduce minor swings.
Channel search
Number of recent pivots to consider
Default 12. Higher values search more history and try more channel combinations. Lower values make the search faster and more reactive.
Max slope difference for parallel
Default 0.0005. Maximum allowed difference between the upper and lower line slopes. Smaller values enforce stricter parallelism.
Max price tolerance outside channel
Default 0.0. A buffer added to the channel boundaries during validation and breakout checks. Use this to ignore tiny wicks that poke the lines.
Minimum inside to outside pivots ratio for valid channel (0.00–1.00)
Default 1.00. Require that at least this fraction of checked pivots lie inside the channel. For a more permissive fit, try 0.60 to 0.85.
Styling
Upper Line Color
Lower Line Color
Breakout Above Color
Breakout Below Color
Plots and visuals
Upper channel line
Lower channel line
Triangle markers on the bar that first confirms a close outside the channel, above or below.
Lines extend left from their pivot anchors. Projection to the current bar is used internally to test for breakouts and to set alerts.
Alerts
The script defines two alert conditions:
Close Above Channel
Triggers when the bar closes above the projected upper line plus tolerance.
Close Below Channel
Triggers when the bar closes below the projected lower line minus tolerance.
Practical usage
Trend channels
In a steady trend, a high inside ratio with a moderate width often highlights the dominant channel. Consider trend entries near the lower line in an uptrend or near the upper line in a downtrend, with exits or stops beyond the opposite boundary.
Breakout trades
Combine the channel breakout alert with volume or a separate momentum filter. The tolerance input helps avoid false triggers from small wicks.
Tuning for timeframe and symbol
• Faster markets or lower timeframes usually benefit from a larger ZigZag percentage and a smaller pivot count.
• Slower markets or higher timeframes can use more pivots and a tighter slope difference to enforce cleaner geometry.
Notes and limitations
Channels are derived from ZigZag pivots. If your ZigZag settings change, the detected channel will also change.
The script plots only the single best channel at any time to keep the chart clean.
Breakout markers appear on confirmed bars. For historical bars, markers appear only where a breakout would have been confirmed at that time.
Lines extend left from their anchors. The script projects the lines internally to the current bar for checks and alerts.
License and attribution
License
Creative Commons Attribution-NonCommercial 4.0 International (CC BY-NC 4.0).
Open source for educational and personal use only. Commercial use requires written permission.
Attribution
© 2025 SciQua — Joshua Danford
Libraries
Uses TradingView/ZigZag/7.
Changelog
v1.0
Initial release. Automatic parallel channel detection from ZigZag pivots, quality scoring, live plotting, and close-based breakout alerts.
FAQ
Why do I not see any channel sometimes?
There may not be a valid pair of highs and lows that pass the slope, inside ratio, and tolerance checks. Loosen the constraints by increasing Max slope difference, lowering Minimum inside ratio, or increasing the ZigZag percentage.
The channel looks too narrow or too wide?
Adjust Number of recent pivots and Minimum inside ratio. A higher inside ratio tends to favor cleaner, sometimes wider channels. A lower ratio may admit narrower, more reactive channels.
How can I reduce false breakout alerts?
Increase Max price tolerance outside channel to ignore small wicks. Add a volume or momentum confirmation in your personal alert workflow.
Thank you for using Auto Channel . Feedback and improvements are welcome.

Internal Pivot Pattern [LuxAlgo]The Internal Pivot Pattern indicator is a novel method allowing traders to detect pivots without excessive delay on the chart timeframe, by using the lower timeframe data from a candle.
It features custom colors for candles and zigzag lines to help identify trends. A dashboard showing the accuracy of the pattern is also included.
🔶 USAGE
We define a pivot as the occurrence where the middle candle over a specific interval (for example, the most recent 21 bars) is the highest (pivot high) or the lowest (pivot low). This method commonly allows for identifying swing highs/lows on a trader's chart; however, this pattern can only be identified after a specific number of bars has been formed, rendering this pattern useless for real-time detection of swing highs/lows.
This indicator uses a different approach, removing the need to wait for candles to form on the user chart; instead, we check the lower timeframe data of the current candle and evaluate for the presence of a pivot given the internal data, effectively providing pivot confirmation at the candle close.
An internal pivot low pattern is indicative of a potential uptrend, while an internal pivot high is indicative of a potential downtrend.
Candles are colored based on the last internal pivot detected, with blue candle colors indicating that the most recent internal pivot is a pivot low, indicating an uptrend, while an orange candle color indicates that the most recent internal pivot is a pivot high, indicating a downtrend.
🔹 Timeframes
The timeframe setting allows controlling the amount of lower timeframe data to consider for the internal pivot detection. This setting must be lower than the user's chart timeframe.
Using a timeframe significantly lower than the user chart timeframe will evaluate a larger amount of data for the pivot detection, making it less frequent, while using a timeframe closer to the chart timeframe can make the internal pivot detection more frequent, and more prone to false positives.
🔹 Accuracy Dashboard
The Accuracy Dashboard allows evaluating how accurate the detected patterns are as a percentage, with a pattern being judged accurate if subsequent patterns are detected higher or lower than a previous one.
For example, an internal pivot low is judged accurate if the following internal pivot is higher than it, indicating that higher highs have been made.
This dashboard can be useful to determine the timeframe setting to maximize the respective internal pivot accuracy.
🔶 SETTINGS
Timeframe: Timeframe for detecting internal swings
Accuracy Dashboard: Enable or disable the Accuracy Dashboard.
🔹 Style
Internal Pivot High: Color of the dot displayed upon the detection of an internal pivot high
Internal Pivot Low: Color of the dot displayed upon the detection of an internal pivot low
Zig-Zag: Color of the zig-zag segments connecting each internal pivot
Candles: Enable candle coloring, with control over the color of the candles highlighting the detected trend

Zigzag Simple [SCL]🟩 OVERVIEW
Draws zigzag lines from pivot Highs to pivot Lows. You can choose between three different ways of calculating pivots:
• True Highs and Lows
• Williams pivots
• Oscillator pivots
🟩 HOW TO USE
This indicator can be used to understand market structure, which is arguably the primary thing you need to be aware of when trading. The zigzag by itself does not display a market structure bias, nor any information about prices of pivots, HH and HL labels, or anything like that. Nevertheless, a simple zigzag is perhaps the easiest and most intuitive way to understand what price is doing.
Choose a pivot style that you like, customise the colours and line style, and enjoy!
🟩 PIVOT TYPES EXPLAINED
True Highs and Lows
This is not an invention of mine (all credit to my humble mentor), but I haven't seen anyone else code them up. A true High is a close below the low of the candle with the highest high. A true Low is a close above the high of a candle with the lowest low. These are solid, price action-based pivots that can sometimes confirm quickly.
Williams pivots
This is how most people calculate pivots. They're simply the highest high for x bars back and x bars forwards. They're the vanilla of pivots IMO: serviceable but not very interesting. They're very convenient to code because there are built-in Pine functions for them: ta.pivothigh and ta.pivotlow . They confirm a predictable number of bars after they happen, which is great for coding but also makes the trader wait for confirmation.
Oscillator pivots
This is a completely different concept, which uses momentum in order to define pivots. For example, when you get a rise in momentum and momentum then drops a configurable amount, it confirms a pivot high, and vice versa for a pivot low. I don't know if anyone else does it –- although some indicators do mark pivots in momentum itself, and plenty do divergences, I wasn't able to find one that specifically marked *pivots in price* because of pivots in momentum 🤷♂️
Anyway, while this approach needs a whole investigation on its own, here we simply plot some pivots in a smoothed RSI. This indicator doesn't plot the actual momentum values -- for a more visual understanding of how this works, refer to the examples in the OscillatorPivots library.
🟩 UNIQUE ADVANTAGES
In contrast to other zigzag indicators available, this one lets you choose between the standard and some more unique methods of generating the zigzags. Additionally, because it's based on libraries, it is relatively easy for programmers to use as a basis for experimentation.
🟩 GEEK STUFF
Although there is considerable practical use for pivot-based zigzags in trading, this script is primarily a demonstration in coding -- specifically the power of libraries!
Most of the script consists of setup, especially defining inputs. The final section sacrifices some readability for conciseness, simply to emphasise how little code you need when the heavy lifting is done by libraries .
The actual calculations and drawing are achieved in just 8 lines.
The equivalent code in the libraries is ~250 lines long.
All libraries used are my own, public and open-source:
• MarketStructure
• DrawZigZag
• OscillatorPivots

DrawZigZag🟩 OVERVIEW
This library draws zigzag lines for existing pivots. It is designed to be simple to use. If your script creates pivots and you want to join them up while handling edge cases, this library does that quickly and efficiently. If you want your pivots created for you, choose one of the many other zigzag libraries that do that.
🟩 HOW TO USE
Pine Script libraries contain reusable code for importing into indicators. You do not need to copy any code out of here. Just import the library and call the function you want.
For example, for version 1 of this library, import it like this:
import SimpleCryptoLife/DrawZigZag/1
See the EXAMPLE USAGE sections within the library for examples of calling the functions.
For more information on libraries and incorporating them into your scripts, see the Libraries section of the Pine Script User Manual.
🟩 WHAT IT DOES
I looked at every zigzag library on TradingView, after finishing this one. They all seemed to fall into two groups in terms of functionality:
• Create the pivots themselves, using a combination of Williams-style pivots and sometimes price distance.
• Require an array of pivot information, often in a format that uses user-defined types.
My library takes a completely different approach.
Firstly, it only does the drawing. It doesn't calculate the pivots for you. This isn't laziness. There are so many ways to define pivots and that should be up to you. If you've followed my work on market structure you know what I think of Williams pivots.
Secondly, when you pass information about your pivots to the library function, you only need the minimum of pivot information -- whether it's a High or Low pivot, the price, and the bar index. Pass these as normal variables -- bools, ints, and floats -- on the fly as your pivots confirm. It is completely agnostic as to how you derive your pivots. If they are confirmed an arbitrary number of bars after they happen, that's fine.
So why even bother using it if all it does it draw some lines?
Turns out there is quite some logic needed in order to connect highs and lows in the right way, and to handle edge cases. This is the kind of thing one can happily outsource.
🟩 THE RULES
• Zigs and zags must alternate between Highs and Lows. We never connect a High to a High or a Low to a Low.
• If a candle has both a High and Low pivot confirmed on it, the first line is drawn to the end of the candle that is the opposite to the previous pivot. Then the next line goes vertically through the candle to the other end, and then after that continues normally.
• If we draw a line up from a Low to a High pivot, and another High pivot comes in higher, we *extend* the line up, and the same for lines down. Yes this is a form of repainting. It is in my opinion the only way to end up with a correct structure.
• We ignore lower highs on the way up and higher lows on the way down.
🟩 WHAT'S COOL ABOUT THIS LIBRARY
• It's simple and lightweight: no exported user-defined types, no helper methods, no matrices.
• It's really fast. In my profiling it runs at about ~50ms, and changing the options (e.g., trimming the array) doesn't make very much difference.
• You only need to call one function, which does all the calculations and draws all lines.
• There are two variations of this function though -- one simple function that just draws lines, and one slightly more advanced method that modifies an array containing the lines. If you don't know which one you want, use the simpler one.
🟩 GEEK STUFF
• There are no dependencies on other libraries.
• I tried to make the logic as clear as I could and comment it appropriately.
• In the `f_drawZigZags` function, the line variable is declared using the `var` keyword *inside* the function, for simplicity. For this reason, it persists between function calls *only* if the function is called from the global scope or a local if block. In general, if a function is called from inside a loop , or multiple times from different contexts, persistent variables inside that function are re-initialised on each call. In this case, this re-initialisation would mean that the function loses track of the previous line, resulting in incorrect drawings. This is why you cannot call the `f_drawZigZags` function from a loop (not that there's any reason to). The `m_drawZigZagsArray` does not use any internal `var` variables.
• The function itself takes a Boolean parameter `_showZigZag`, which turns the drawings on and off, so there is no need to call the function conditionally. In the examples, we do call the functions from an if block, purely as an illustration of how to increase performance by restricting the amount of code that needs to be run.
🟩 BRING ON THE FUNCTIONS
f_drawZigZags(_showZigZag, _isHighPivot, _isLowPivot, _highPivotPrice, _lowPivotPrice, _pivotIndex, _zigzagWidth, _lineStyle, _upZigColour, _downZagColour)
This function creates or extends the latest zigzag line. Takes real-time information about pivots and draws lines. It does not calculate the pivots. It must be called once per script and cannot be called from a loop.
Parameters:
_showZigZag (bool) : Whether to show the zigzag lines.
_isHighPivot (bool) : Whether the current bar confirms a high pivot. Note that pivots are confirmed after the bar in which they occur.
_isLowPivot (bool) : Whether the current bar confirms a low pivot.
_highPivotPrice (float) : The price of the high pivot that was confirmed this bar. It is NOT the high price of the current bar.
_lowPivotPrice (float) : The price of the low pivot that was confirmed this bar. It is NOT the low price of the current bar.
_pivotIndex (int) : The bar index of the pivot that was confirmed this bar. This is not an offset. It's the `bar_index` value of the pivot.
_zigzagWidth (int) : The width of the zigzag lines.
_lineStyle (string) : The style of the zigzag lines.
_upZigColour (color) : The colour of the up zigzag lines.
_downZagColour (color) : The colour of the down zigzag lines.
Returns: The function has no explicit returns. As a side effect, it draws or updates zigzag lines.
method m_drawZigZagsArray(_a_zigZagLines, _showZigZag, _isHighPivot, _isLowPivot, _highPivotPrice, _lowPivotPrice, _pivotIndex, _zigzagWidth, _lineStyle, _upZigColour, _downZagColour, _trimArray)
Namespace types: array
Parameters:
_a_zigZagLines (array)
_showZigZag (bool) : Whether to show the zigzag lines.
_isHighPivot (bool) : Whether the current bar confirms a high pivot. Note that pivots are usually confirmed after the bar in which they occur.
_isLowPivot (bool) : Whether the current bar confirms a low pivot.
_highPivotPrice (float) : The price of the high pivot that was confirmed this bar. It is NOT the high price of the current bar.
_lowPivotPrice (float) : The price of the low pivot that was confirmed this bar. It is NOT the low price of the current bar.
_pivotIndex (int) : The bar index of the pivot that was confirmed this bar. This is not an offset. It's the `bar_index` value of the pivot.
_zigzagWidth (int) : The width of the zigzag lines.
_lineStyle (string) : The style of the zigzag lines.
_upZigColour (color) : The colour of the up zigzag lines.
_downZagColour (color) : The colour of the down zigzag lines.
_trimArray (bool) : If true, the array of lines is kept to a maximum size of two lines (the line elements are not deleted). If false (the default), the array is kept to a maximum of 500 lines (the maximum number of line objects a single Pine script can display).
Returns: This function has no explicit returns but it modifies a global array of zigzag lines.
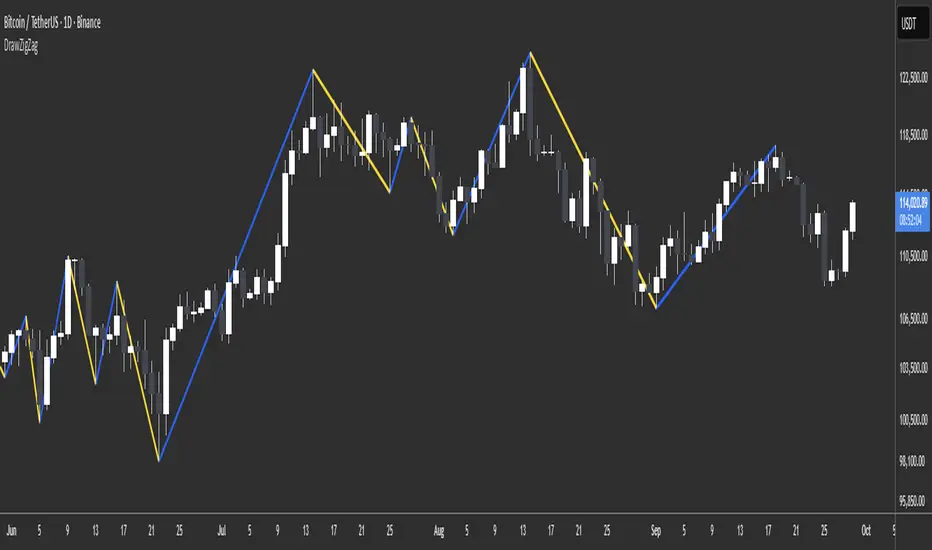
ZigZag ProZigZag Pro is a precise market structure indicator that automatically detects two independent ZigZag patterns and highlights breakouts whenever significant highs or lows are breached.
The indicator calculates two separate ZigZag structures in real time. ZigZag1 captures the broader market swings and is ideal for trend or swing trading. ZigZag2 is optional and reacts more quickly – perfect for intraday or scalping setups. Both layers are fully customizable in terms of depth, color, and line width.
What makes this tool especially useful: whenever a previous swing high (for long trades) or swing low (for short trades) is broken, the indicator draws a horizontal breakout line on the chart. This makes it easy to spot structural breakouts and take advantage of potential momentum moves.
ZigZag Pro is designed for traders who rely on clean, rule-based market structure — whether you're trading classic breakouts, smart money concepts, or simply want a clearer view of trend shifts. The visuals are minimal, responsive, and suitable for any timeframe.

Zig Zag Trend Metrics“ Zig Zag Trend Metrics ” is a highly versatile indicator, built on the classic Zig Zag concept and thoughtfully designed for technical traders seeking a deeper, more structured view of market dynamics. This tool identifies significant swing highs and lows, classifies them, and annotates each with key metrics, offering a precise snapshot of each movement. It enhances visual analysis by drawing connecting lines that outline the flow of market structure, making trend progression and reversals instantly recognizable. Beyond visual mapping, it features a compact, real-time statistics table that calculates the average price and time deltas for both bullish and bearish swings, giving traders deep insights into trend momentum and rhythm. With extensive customization options, this indicator adapts seamlessly to vast trading styles or chart setups, empowering traders to spot patterns, evaluate trend strength, and make more confident, data-backed decisions.
❖ FEATURES
✦ Automatic Swing Detection
At its core, this indicator automatically identifies swing highs and lows based on a customizable lookback period (default: 10 bars).
✦ Labeling Swing Points
Each swing is visualized with a label that includes:
Swing Classification : “HH” (Higher High), “LH” (Lower High), “LL” (Lower Low), or “HL” (Higher Low).
Price Difference : Displayed in percentage or absolute value from the previous opposite swing.
Time Difference : The number of bars since the previous swing of the opposite type.
These labels offer traders clear, immediate insight into price movements and structural changes.
✦ Visual Lines
The indicator draws three types of lines:
Bullish Lines: Connect recent swing lows to new swing highs, indicating uptrends.
Bearish Lines: Connect recent swing highs to new swing lows, indicating downtrends.
Range Lines: Connect consecutive highs or lows to outline price channels.
Each line type can be color-coded and customized for visibility.
✦ Statistics Table
An on-screen metrics table provides a live summary of trends. Script uses Relative Averaging to smooth price and time changes. This prevents outliers from distorting the data and provides a more reliable sense of typical swing behavior.
Uptrend Metrics: Shows average price and time differences from recent bullish swings.
Downtrend Metrics: Shows the same for bearish swings.
🛠️ Customization Options
Ability to tailor the indicator to suit their strategy and aesthetic preferences:
Swing Period: Adjust sensitivity to short- or long-term swings.
Color Settings: Customize line and label colors.
Label Display: Choose between absolute or percentage price differences.
Table Settings: Modify size, location, or visibility.
This makes the indicator highly flexible and useful across various timeframes and assets.

ZigZag█ Overview
This Pine Script™ library provides a comprehensive implementation of the ZigZag indicator using advanced object-oriented programming techniques. It serves as a developer resource rather than a standalone indicator, enabling Pine Script™ programmers to incorporate sophisticated ZigZag calculations into their own scripts.
Pine Script™ libraries contain reusable code that can be imported into indicators, strategies, and other libraries. For more information, consult the Libraries section of the Pine Script™ User Manual.
█ About the Original
This library is based on TradingView's official ZigZag implementation .
The original code provides a solid foundation with user-defined types and methods for calculating ZigZag pivot points.
█ What is ZigZag?
The ZigZag indicator filters out minor price movements to highlight significant market trends.
It works by:
1. Identifying significant pivot points (local highs and lows)
2. Connecting these points with straight lines
3. Ignoring smaller price movements that fall below a specified threshold
Traders typically use ZigZag for:
- Trend confirmation
- Identifying support and resistance levels
- Pattern recognition (such as Elliott Waves)
- Filtering out market noise
The algorithm identifies pivot points by analyzing price action over a specified number of bars, then only changes direction when price movement exceeds a user-defined percentage threshold.
█ My Enhancements
This modified version extends the original library with several key improvements:
1. Support and Resistance Visualization
- Adds horizontal lines at pivot points
- Customizable line length (offset from pivot)
- Adjustable line width and color
- Option to extend lines to the right edge of the chart
2. Support and Resistance Zones
- Creates semi-transparent zone areas around pivot points
- Customizable width for better visibility of important price levels
- Separate colors for support (lows) and resistance (highs)
- Visual representation of price areas rather than just single lines
3. Zig Zag Lines
- Separate colors for upward and downward ZigZag movements
- Visually distinguishes between bullish and bearish price swings
- Customizable colors for text
- Width customization
4. Enhanced Settings Structure
- Added new fields to the Settings type to support the additional features
- Extended Pivot type with supportResistance and supportResistanceZone fields
- Comprehensive configuration options for visual elements
These enhancements make the ZigZag more useful for technical analysis by clearly highlighting support/resistance levels and zones, and providing clearer visual cues about market direction.
█ Technical Implementation
This library leverages Pine Script™'s user-defined types (UDTs) to create a robust object-oriented architecture:
- Settings : Stores configuration parameters for calculation and display
- Pivot : Represents pivot points with their visual elements and properties
- ZigZag : Manages the overall state and behavior of the indicator
The implementation follows best practices from the Pine Script™ User Manual's Style Guide and uses advanced language features like methods and object references. These UDTs represent Pine Script™'s most advanced feature set, enabling sophisticated data structures and improved code organization.
For newcomers to Pine Script™, it's recommended to understand the language fundamentals before working with the UDT implementation in this library.
█ Usage Example
//@version=6
indicator("ZigZag Example", overlay = true, shorttitle = 'ZZA', max_bars_back = 5000, max_lines_count = 500, max_labels_count = 500, max_boxes_count = 500)
import andre_007/ZigZag/1 as ZIG
var group_1 = "ZigZag Settings"
//@variable Draw Zig Zag on the chart.
bool showZigZag = input.bool(true, "Show Zig-Zag Lines", group = group_1, tooltip = "If checked, the Zig Zag will be drawn on the chart.", inline = "1")
// @variable The deviation percentage from the last local high or low required to form a new Zig Zag point.
float deviationInput = input.float(5.0, "Deviation (%)", minval = 0.00001, maxval = 100.0,
tooltip = "The minimum percentage deviation from a previous pivot point required to change the Zig Zag's direction.", group = group_1, inline = "2")
// @variable The number of bars required for pivot detection.
int depthInput = input.int(10, "Depth", minval = 1, tooltip = "The number of bars required for pivot point detection.", group = group_1, inline = "3")
// @variable registerPivot (series bool) Optional. If `true`, the function compares a detected pivot
// point's coordinates to the latest `Pivot` object's `end` chart point, then
// updates the latest `Pivot` instance or adds a new instance to the `ZigZag`
// object's `pivots` array. If `false`, it does not modify the `ZigZag` object's
// data. The default is `true`.
bool allowZigZagOnOneBarInput = input.bool(true, "Allow Zig Zag on One Bar", tooltip = "If checked, the Zig Zag calculation can register a pivot high and pivot low on the same bar.",
group = group_1, inline = "allowZigZagOnOneBar")
var group_2 = "Display Settings"
// @variable The color of the Zig Zag's lines (up).
color lineColorUpInput = input.color(color.green, "Line Colors for Up/Down", group = group_2, inline = "4")
// @variable The color of the Zig Zag's lines (down).
color lineColorDownInput = input.color(color.red, "", group = group_2, inline = "4",
tooltip = "The color of the Zig Zag's lines")
// @variable The width of the Zig Zag's lines.
int lineWidthInput = input.int(1, "Line Width", minval = 1, tooltip = "The width of the Zig Zag's lines.", group = group_2, inline = "w")
// @variable If `true`, the Zig Zag will also display a line connecting the last known pivot to the current `close`.
bool extendInput = input.bool(true, "Extend to Last Bar", tooltip = "If checked, the last pivot will be connected to the current close.",
group = group_1, inline = "5")
// @variable If `true`, the pivot labels will display their price values.
bool showPriceInput = input.bool(true, "Display Reversal Price",
tooltip = "If checked, the pivot labels will display their price values.", group = group_2, inline = "6")
// @variable If `true`, each pivot label will display the volume accumulated since the previous pivot.
bool showVolInput = input.bool(true, "Display Cumulative Volume",
tooltip = "If checked, the pivot labels will display the volume accumulated since the previous pivot.", group = group_2, inline = "7")
// @variable If `true`, each pivot label will display the change in price from the previous pivot.
bool showChgInput = input.bool(true, "Display Reversal Price Change",
tooltip = "If checked, the pivot labels will display the change in price from the previous pivot.", group = group_2, inline = "8")
// @variable Controls whether the labels show price changes as raw values or percentages when `showChgInput` is `true`.
string priceDiffInput = input.string("Absolute", "", options = ,
tooltip = "Controls whether the labels show price changes as raw values or percentages when 'Display Reversal Price Change' is checked.",
group = group_2, inline = "8")
// @variable If `true`, the Zig Zag will display support and resistance lines.
bool showSupportResistanceInput = input.bool(true, "Show Support/Resistance Lines",
tooltip = "If checked, the Zig Zag will display support and resistance lines.", group = group_2, inline = "9")
// @variable The number of bars to extend the support and resistance lines from the last pivot point.
int supportResistanceOffsetInput = input.int(50, "Support/Resistance Offset", minval = 0,
tooltip = "The number of bars to extend the support and resistance lines from the last pivot point.", group = group_2, inline = "10")
// @variable The width of the support and resistance lines.
int supportResistanceWidthInput = input.int(1, "Support/Resistance Width", minval = 1,
tooltip = "The width of the support and resistance lines.", group = group_2, inline = "11")
// @variable The color of the support lines.
color supportColorInput = input.color(color.red, "Support/Resistance Color", group = group_2, inline = "12")
// @variable The color of the resistance lines.
color resistanceColorInput = input.color(color.green, "", group = group_2, inline = "12",
tooltip = "The color of the support/resistance lines.")
// @variable If `true`, the support and resistance lines will be drawn as zones.
bool showSupportResistanceZoneInput = input.bool(true, "Show Support/Resistance Zones",
tooltip = "If checked, the support and resistance lines will be drawn as zones.", group = group_2, inline = "12-1")
// @variable The color of the support zones.
color supportZoneColorInput = input.color(color.new(color.red, 70), "Support Zone Color", group = group_2, inline = "12-2")
// @variable The color of the resistance zones.
color resistanceZoneColorInput = input.color(color.new(color.green, 70), "", group = group_2, inline = "12-2",
tooltip = "The color of the support/resistance zones.")
// @variable The width of the support and resistance zones.
int supportResistanceZoneWidthInput = input.int(10, "Support/Resistance Zone Width", minval = 1,
tooltip = "The width of the support and resistance zones.", group = group_2, inline = "12-3")
// @variable If `true`, the support and resistance lines will extend to the right of the chart.
bool supportResistanceExtendInput = input.bool(false, "Extend to Right",
tooltip = "If checked, the lines will extend to the right of the chart.", group = group_2, inline = "13")
// @variable References a `Settings` instance that defines the `ZigZag` object's calculation and display properties.
var ZIG.Settings settings =
ZIG.Settings.new(
devThreshold = deviationInput,
depth = depthInput,
lineColorUp = lineColorUpInput,
lineColorDown = lineColorDownInput,
textUpColor = lineColorUpInput,
textDownColor = lineColorDownInput,
lineWidth = lineWidthInput,
extendLast = extendInput,
displayReversalPrice = showPriceInput,
displayCumulativeVolume = showVolInput,
displayReversalPriceChange = showChgInput,
differencePriceMode = priceDiffInput,
draw = showZigZag,
allowZigZagOnOneBar = allowZigZagOnOneBarInput,
drawSupportResistance = showSupportResistanceInput,
supportResistanceOffset = supportResistanceOffsetInput,
supportResistanceWidth = supportResistanceWidthInput,
supportColor = supportColorInput,
resistanceColor = resistanceColorInput,
supportResistanceExtend = supportResistanceExtendInput,
supportResistanceZoneWidth = supportResistanceZoneWidthInput,
drawSupportResistanceZone = showSupportResistanceZoneInput,
supportZoneColor = supportZoneColorInput,
resistanceZoneColor = resistanceZoneColorInput
)
// @variable References a `ZigZag` object created using the `settings`.
var ZIG.ZigZag zigZag = ZIG.newInstance(settings)
// Update the `zigZag` on every bar.
zigZag.update()
//#endregion
The example code demonstrates how to create a ZigZag indicator with customizable settings. It:
1. Creates a Settings object with user-defined parameters
2. Instantiates a ZigZag object using these settings
3. Updates the ZigZag on each bar to detect new pivot points
4. Automatically draws lines and labels when pivots are detected
This approach provides maximum flexibility while maintaining readability and ease of use.
