Qullamaggie 8EMA/21EMA/50EMA//Exponantial Moving Average - 8 //Exponantial Moving Average - 21 //Simple Moving Average - 50Penunjuk Pine Script®oleh ickaya_Telah dikemas kini 32
MCX RSI Screener (5m,15m,1D)A complete multi-timeframe RSI screener designed for MCX commodities. It automatically fetches RSI values from 5-minute, 15-minute, and 1-day timeframes for up to 10 selected MCX symbols — all in one compact table.Penunjuk Pine Script®oleh gurpreet-aroraTelah dikemas kini 24
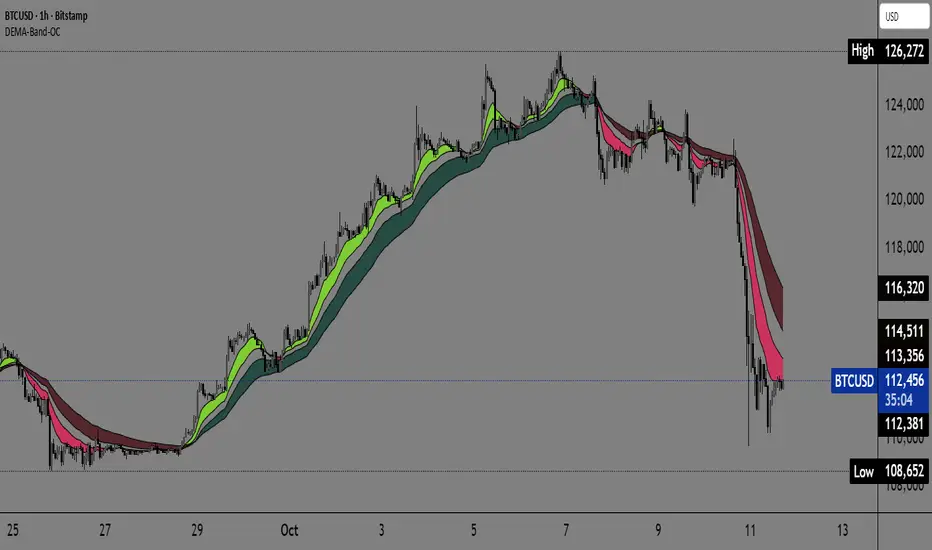
Dual EMA Trend Ribbon (Multi-Timeframe Trend Confirmation) Dual EMA Trend Ribbon (Multi-Timeframe Trend Confirmation) This Pine Script indicator creates a visually clear representation of trend direction using two overlaid Exponential Moving Average (EMA) Ribbons, which allows traders to assess both short-term and medium-term momentum at a glance. How It Works: The indicator plots two separate EMA ribbons, each calculated using a distinct set of periods, simulating a multi-timeframe approach on a single chart: Inner (Fast) Ribbon (Defaults 10/30): Represents the fast-moving, short-term trend. Green: Fast EMA 1 > Slow EMA 1 (Short-term Bullish) Red: Fast EMA 1 < Slow EMA 1 (Short-term Bearish) Outer (Slow) Ribbon (Defaults 40/50): Represents the slower, medium-term trend. Darker Green/Red: Indicates the overall, underlying market bias. How to Use: Strong Trend Confirmation: A strong signal occurs when both ribbons are aligned (e.g., both are Green). This suggests that short-term momentum aligns with the medium-term bias. Trend Weakness/Reversal: Pay attention when the two ribbons cross or when the fast ribbon changes color against the slow ribbon's color (e.g., fast ribbon turns Red while the slow ribbon remains Green). This often signals a temporary pullback or potential reversal of the underlying trend. Settings: Users can easily adjust the four input periods (Fast EMA 1, Slow EMA 1, Fast EMA 2, Slow EMA 2) to customize the sensitivity to any trading style or asset.Penunjuk Pine Script®oleh Aleksin_Aleksandar88993
Continuation Suite v1 — 5m/15mContinuation Suite v1 — 5m/15m (Non-Repainting, S/R + Trend Continuation) What it does Continuation Suite v1 is a practical intraday toolkit that combines non-repainting trend-continuation signals with auto-built Support/Resistance (S/R) from confirmed pivots. It’s designed for fast, liquid names on 5m charts with an optional 15m higher-timeframe (HTF) overlay. You get: stacked-EMA bias, disciplined pullback+reclaim entries, optional volume/volatility gates, a “Strong” signal tier, solid S/R lines or zones, and a compact dashboard for fast reads. ⸻ Why traders use it • Clear bias using fast/mid/slow EMA stacking. • Actionable entries that require a pullback, a reclaim, and (optionally) a minor break of prior extremes. • Signal quality gates (volume vs SMA, ATR%, ADX/DI alignment, EMA spacing, slope). • Non-repainting logic when “Confirm on Close” = ON. Intrabar previews show what’s forming, but confirmed signals only print on bar close. • S/R that matters: confirmed-pivot lines or ATR-sized zones, optional HTF overlay, and auto de-dup to avoid clutter. ⸻ Signal construction (no magic, just rules) Bullish continuation (base): 1. Trend: EMA fast > EMA mid > EMA slow 2. Pullback: price pulls into the stack (lowest low or close vs EMA fast/mid over a lookback) 3. Reclaim: close > EMA fast and close > open 4. Break filter (optional): current bar takes out the prior bar’s high 5. Filters: volume > SMA (if enabled) and ATR% ≤ max (if enabled) 6. Cooldown: a minimum bar gap between signals Bearish continuation (base): mirror of the above. Strong signals: base conditions plus ADX ≥ threshold, DI alignment (DI+>DI- for longs; DI->DI+ for shorts), minimum EMA-spacing %, and minimum fast-EMA slope. Reference stops: • Longs: lowest low over the pullback lookback • Shorts: highest high over the pullback lookback Alerts are included for: Bullish Continuation, Bearish Continuation, STRONG Bullish, STRONG Bearish. ⸻ S/R engine (current TF + optional HTF) • Builds S/R from confirmed pivots only (left/right bars). • Choose Lines (midlines) or Zones (ATR-sized). • Zones merge when a new pivot lands near an existing zone’s mid (ATR-scaled epsilon). • Touches counter tracks significance; you can require a minimum to draw. • HTF overlay (default 15m) draws separate lines/zones with tiny TF tags on the right. • De-dup option hides current-TF zones that sit too close to HTF zones (ATR-scaled), reducing overlap. • Freeze on Close (optional) keeps arrays stable intrabar; snapshots show levels immediately as bars open. ⸻ Presets • Auto: Detects QQQ-like tickers (QQQ, QLD, QID) or SoFi; else defaults to Custom. • QQQ: Tighter ATR% and EMA settings geared to index-ETF behavior. • SoFi: Wider ATR allowances and longer mid/slow for single-name behavior. • Custom: Expose all key inputs to tune for your product. ⸻ Dashboard (top-right) • Preset in use • Bias (Bullish CONT / Bearish CONT / Neutral) • Strong (Yes/No) • Volatility (ATR% bucket) • Trend (ADX bucket) • HTF timeframe tag • Volume (bucket or “off”) • Signals mode (Close-Confirmed vs Intrabar) ⸻ Inputs you’ll actually adjust Trend/Signals • Fast/Mid/Slow EMA lengths • Pullback lookback, Min bars between signals • Volume filter (vol > SMA N) • ATR% max filter (cap excessive volatility) • Require break of prior bar’s high/low • “Strong” gates: min EMA slope, min EMA spacing %, ADX length & threshold Support/Resistance • Lines vs Zones • Pivot left/right bars • Extend left/right (bars) • Max pivots kept (current & HTF) • Zone width (× ATR), Merge epsilon (× ATR), Min gap (× ATR) • Min touches, Max zones per side near price • De-dup current TF vs HTF (× ATR) Repainting control • Confirm on Close: when ON, signals/SR finalize on bar close (non-repainting) • Freeze on Close: freeze S/R intrabar with snapshot updates • Show previews: translucent intrabar labels for what’s forming ⸻ How to use it (straightforward) 1. Load on 5-minute chart (baseline). Keep Confirm on Close ON if you hate repainting. 2. Use Bias + Strong + S/R context. If a long prints into HTF resistance, you have information. 3. Manage risk off the reference stop (pullback extreme). If ATR% reads “Great,” widen expectations; if “Poor,” size down or pass. 4. Alerts: wire the four alert types to your workflow. ⸻ Notes and constraints • Designed for liquid symbols. Thin books and synthetic “volume” will degrade the volume gate. • S/R is pivot-based. On very choppy tape, touch counts help. Increase min touches or switch to Lines to declutter. • If your chart timeframe isn’t 5m, behavior changes because lengths are in bars, not minutes. Tune lengths accordingly. ⸻ Disclaimers This is a research tool. No signals are guaranteed. Markets change, outliers happen, slippage is real. Nothing here is financial advice—use your own judgment and risk management. ⸻ Author: DaddyScruff License: MPL-2.0 (Mozilla Public License 2.0)Penunjuk Pine Script®oleh DaddyScruffTelah dikemas kini 11129
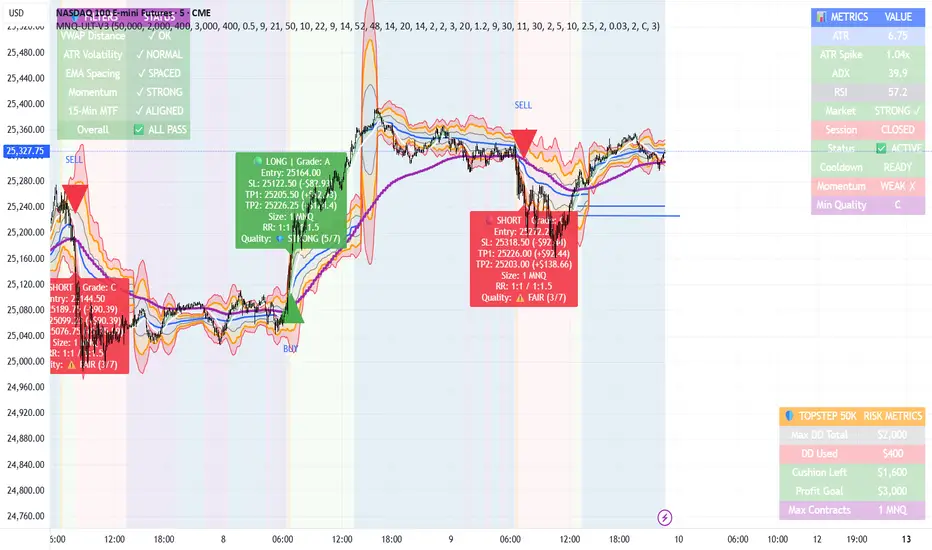
MNQ TopStep 50K | Ultra Quality v3.0MNQ TopStep 50K | Ultra Quality v3.0 - Publish Summary📊 OverviewA professional-grade trading indicator designed specifically for MNQ futures traders using TopStep funded accounts. Combines 7 technical confirmations with 5 advanced safety filters to deliver high-quality trade signals while managing drawdown risk.🎯 Key FeaturesCore Signal System 7-Point Confirmation: VWAP, EMA crossovers, 15-min HTF trend, MACD, RSI, ADX, and Volume Signal Grading: Each signal is rated A+ through D based on 7 quality factors Quality Threshold: Adjustable minimum grade requirement (A+, A, B, C, D) Advanced Safety Filters (Customizable) Mean Reversion Filter - Prevents chasing extended moves beyond VWAP bands ATR Spike Filter - Avoids trading during extreme volatility events EMA Spacing Filter - Ensures proper trend separation (optional) Momentum Filter - Requires consecutive directional bars (optional) Multi-Timeframe Confirmation - Aligns with 15-min trend (optional) TopStep Risk Management Real-time drawdown tracking Position sizing calculator based on remaining cushion Daily loss limit monitoring Consecutive loss protection Max trades per day limiter Visual Components VWAP with 1σ, 2σ, 3σ bands EMA 9/21 with cloud fill 15-min EMA 50 for HTF trend Comprehensive metrics dashboard Risk management panel Filter status panel Detailed trade labels with entry, stops, and targets ⚙️ Default Settings (Balanced for Regular Signals)Technical Indicators Fast EMA: 9 | Slow EMA: 21 | HTF EMA: 50 (15-min) MACD: 10/22/9 RSI: 14 period | Thresholds: 52 (buy) / 48 (sell) ADX: 14 period | Minimum: 20 ATR: 14 period | Stop: 2x | TP1: 2x | TP2: 3x Volume: 1.2x average required Session Settings Default: 9:30 AM - 11:30 AM ET (adjustable) Avoids first 15 minutes after market open Customizable trading hours Safety Filters (Default Configuration) ✅ Mean Reversion: Enabled (2.5σ max from VWAP) ✅ ATR Spike: Enabled (2.0x threshold) ❌ EMA Spacing: Disabled (can enable for quality) ❌ Momentum: Disabled (can enable for quality) ❌ MTF Confirmation: Disabled (can enable for quality) Risk Controls Minimum Signal Quality: C (adjustable to A+ for fewer/better signals) Min Bars Between Signals: 10 Max Trades Per Day: 5 Stop After Consecutive Losses: 2 📈 Expected PerformanceWith Default Settings: Signals per week: 10-15 trades Estimated win rate: 55-60% Risk-Reward: 1:2 (TP1) and 1:3 (TP2) With Aggressive Settings (Min Quality = D, All Filters Off): Signals per week: 20-25 trades Estimated win rate: 50-55% With Conservative Settings (Min Quality = A, All Filters On): Signals per week: 3-5 trades Estimated win rate: 65-70% 🚀 How to UseBasic Setup: Add indicator to MNQ 5-minute chart Adjust TopStep account settings in inputs Set your risk per trade percentage (default: 0.5%) Configure trading session hours Set minimum signal quality (Start with C for balanced results) Signal Interpretation: Green Triangle (BUY): Long signal - all confirmations aligned Red Triangle (SELL): Short signal - all confirmations aligned Label Details: Shows entry, stop loss, take profit levels, position size, and signal grade Signal Grade: A+ = Elite (6-7 points) | A = Strong (5) | B = Good (4) | C = Fair (3) Dashboard Monitoring: Top Right: Technical metrics and market conditions Top Left: Filter status (which filters are passing/blocking) Bottom Right: TopStep risk metrics and position sizing ⚡ Customization TipsFor More Signals: Lower "Minimum Signal Quality" to D Decrease ADX threshold to 18-20 Lower RSI thresholds to 50/50 Reduce Volume multiplier to 1.1x Disable additional filters For Higher Quality (Fewer Signals): Raise "Minimum Signal Quality" to A or A+ Increase ADX threshold to 25-30 Enable all 5 advanced filters Tighten VWAP distance to 2.0σ Increase momentum requirement to 3-4 bars For TopStep Compliance: Adjust "Max Total Drawdown" and "Daily Loss Limit" to match your account Update "Already Used Drawdown" daily Monitor the Risk Panel for cushion remaining Use recommended contract sizing 🛡️ Risk DisclaimerIMPORTANT: This indicator is for educational and informational purposes only. Past performance does not guarantee future results All trading involves substantial risk of loss Use proper risk management and position sizing Test thoroughly in paper trading before live use The indicator does not guarantee profitable trades Adjust settings based on your risk tolerance and trading style Always comply with your broker's and TopStep's rulesPenunjuk Pine Script®oleh elivgorelick80
Santhosh VWAP + 3 EMA + Buy Sell AlertI have combined VWAP and EMA , along with this generated buy and sell alert based on ATR . Best for Scalping Penunjuk Pine Script®oleh santhosh_sendme109
MNQ Morning Indicator | Clean SignalsMNQ Morning Trading Indicator Summary What It Does This is a TradingView indicator designed for day trading MNQ (Micro Nasdaq-100 futures) during morning sessions. It generates BUY and SELL signals only when multiple technical conditions align, helping traders identify high-probability trade setups. Core Strategy BUY Signal Requirements (All must be true): ✅ Price above VWAP (volume-weighted average price) ✅ Fast EMA (9) above Slow EMA (21) - uptrend confirmation ✅ Price above 15-minute 50 EMA - higher timeframe confirmation ✅ MACD histogram positive - momentum confirmation ✅ RSI above 55 - strength confirmation ✅ ADX above 25 - trending market (not choppy) ✅ Volume 1.5x above average - strong participation SELL Signal (opposite conditions) Key Features 🎯 Risk Management Stop Loss: 2× ATR (Average True Range) Take Profit 1: 2× ATR (1:2 risk-reward) Take Profit 2: 3× ATR (1:3 risk-reward) Dollar values: Calculates P&L based on MNQ's $2/point value ⏰ Session Filter Default: 9:30 AM - 11:30 AM ET (customizable) Safety feature: Avoids first 15 minutes (high volatility period) Won't generate signals outside trading hours 🛡️ Signal Quality Rates each signal: 🔥 STRONG, ⚡ MEDIUM, or ⚠️ WEAK Requires minimum 15 bars between signals (prevents overtrading) 📊 Visual Dashboard Shows real-time metrics: ATR values ADX (trend strength) RSI (momentum) Market condition (TREND/CHOP) Session status Volume status Signal cooldown timer Visual Elements 📈 VWAP with standard deviation bands (1σ, 2σ, 3σ) 📉 Multiple EMAs with trend-based coloring 🟢/🔴 Buy/Sell arrows on chart 📋 Detailed trade labels showing entry, SL, TPs, and risk-reward ratios 🎨 Background highlighting for market conditions Safety Features Cooldown period between signals Session restrictions (no trading outside set hours) First 15-minute avoidance (post-open volatility) Multi-confirmation requirement (all 7 conditions must align) Trend filter (ADX minimum to avoid choppy markets) Best For Day traders focused on morning sessions MNQ futures traders Traders who prefer systematic, rule-based entries Those wanting pre-calculated risk management levels Customization All parameters are adjustable: EMA periods MACD settings RSI thresholds ADX minimum ATR multipliers Session times Visual preferences This indicator is designed to be conservative — it waits for strong confirmation before signaling, which means fewer but potentially higher-quality trades.Penunjuk Pine Script®oleh elivgorelick1188
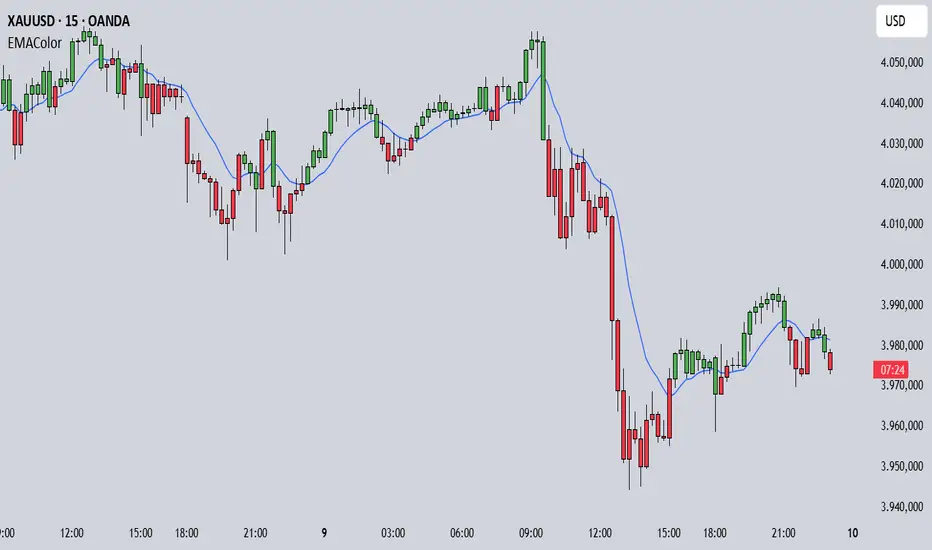
EMA Candle ColorEMA Candle Color - Visual EMA-Based Candle Coloring System Overview: This indicator provides a visual approach to trend identification by coloring candles based on their relationship with an Exponential Moving Average (EMA). The script dynamically colors both the candle bars and plots custom candles to give traders an immediate visual representation of price momentum relative to the EMA. How It Works: The indicator calculates an EMA based on your chosen source (default: open price) and length (default: 10 periods). It then applies a simple yet effective rule: When the source price is ABOVE the EMA → Candles turn GREEN (bullish) When the source price is BELOW the EMA → Candles turn RED (bearish) This instant visual feedback helps traders quickly identify: Current trend direction Potential support/resistance levels (the EMA line itself) Momentum shifts when candles change color Key Features: Customizable EMA Parameters: Adjust the EMA length (1-500) and source (open, close, high, low, hl2, hlc3, ohlc4) Custom Color Selection: Choose your preferred bullish and bearish colors to match your chart theme Dual Visualization: Both bar coloring and custom plotcandle for enhanced visibility Offset Capability: Shift the EMA line forward or backward for advanced analysis Clean Design: Minimal overlay that doesn't clutter your chart How to Use: 1. Add the indicator to your chart 2. Adjust the EMA Length based on your trading timeframe: - Shorter periods (5-20) for day trading and scalping - Medium periods (20-50) for swing trading - Longer periods (50-200) for position trading 3. Watch for candle color changes as potential entry/exit signals 4. Combine with other indicators for confirmation Trading Applications: Trend Following: Stay in trades while candles remain the same color Reversal Signals: Watch for color changes as early reversal warnings Filter System: Only take long positions during green candles, shorts during red Visual Clarity: Quickly assess market sentiment at a glance Settings: Length: EMA calculation period (default: 10) Source: Price data used for EMA calculation (default: open) Offset: Shift EMA line on chart (default: 0) Bullish Color: Color for candles above EMA (default: green) Bearish Color: Color for candles below EMA (default: red) Technical Details: The script uses Pine Script v6 and employs the standard ta.ema() function for smooth, responsive EMA calculations. The candle coloring is achieved through both barcolor() and plotcandle() functions, ensuring visibility across different chart settings. Note: This indicator works on all timeframes and instruments. For best results, combine with proper risk management and additional confirmation indicators. The EMA Candle Color system is designed to simplify trend identification, not as a standalone trading system. Tips: Use on higher timeframes for more reliable signals Combine with volume analysis for confirmation Consider using multiple EMA periods for confluence Disable default candles if using the plotcandle feature to avoid overlap This script is open-source. Feel free to use it as a foundation for your own trading system or modify it to suit your specific trading style.Penunjuk Pine Script®oleh agatariganTelah dikemas kini 29
EMA 9, 21 & 50 Indicator with Floating Labels🟢 EMA 9, 21 & 50 Indicator with Floating Labels 📘 Overview This indicator plots three exponential moving averages (EMAs) to visualize short-, medium-, and longer-term trend structure on any timeframe: EMA 9 – Bright Green (short-term momentum) EMA 21 – Bright Yellow (medium-term trend) EMA 50 – Red (broader trend confirmation) Each EMA has a floating label on the right edge of the chart, so line identities remain visible as new candles form. 🪶 Features Clear, fixed colors for easy recognition (Green 9 / Yellow 21 / Red 50) Floating labels that stay visible off the right edge Clean overlay compatible with any chart style Lightweight and fast to render 📈 How to Use Trend Filter: Price above 21 & 50 → bullish bias; look for long setups or pullbacks toward the 9/21. Price below 21 & 50 → bearish bias; look for short setups or rallies into 9/21. Momentum vs. Structure: 9 EMA = momentum guide for quick swings. 21 EMA = primary trend line for swing entries/exits. 50 EMA = confirmation of broader direction. 🔧 Tips Analyze trend on Daily or 4H; fine-tune entries on 1H/15m near the 9 or 21 EMA. Pair with volume or RSI/MACD for extra confirmation at EMA touches/crosses.Penunjuk Pine Script®oleh zannic515Telah dikemas kini 25
Daily/Weekly EMAs on Lower TimeframesThis indicator allows traders to view Daily and Weekly EMAs (Exponential Moving Averages) directly on lower timeframes such as 1m, 5m, 15m, or 1h charts — providing a higher timeframe perspective without switching charts. The script includes individual checkboxes for each EMA length — 5, 8, 9, 21, 50, and 200 — organized into two clear sections: 🟢 Daily EMAs 🔵 Weekly EMAs You can selectively enable or disable any EMA to match your trading style and reduce chart clutter. Each EMA is color-coded for clarity and consistency: 5 EMA: Green 8 EMA: Blue 9 EMA: Blue 21 EMA: Orange 50 EMA: Purple 200 EMA: Red Weekly EMAs appear slightly transparent to distinguish them from daily ones. This makes it easy to visualize higher timeframe trend direction, confluence zones, and dynamic support/resistance levels while trading intraday. 💡 Key Features View Daily and Weekly EMAs on smaller timeframes. Individual checkbox toggles for all 6 EMA lengths. Separate sections for Daily and Weekly EMAs. Color-coded lines for easy visual recognition. Works seamlessly on any symbol or timeframe below Daily. Penunjuk Pine Script®oleh pavankjaddaTelah dikemas kini 4460
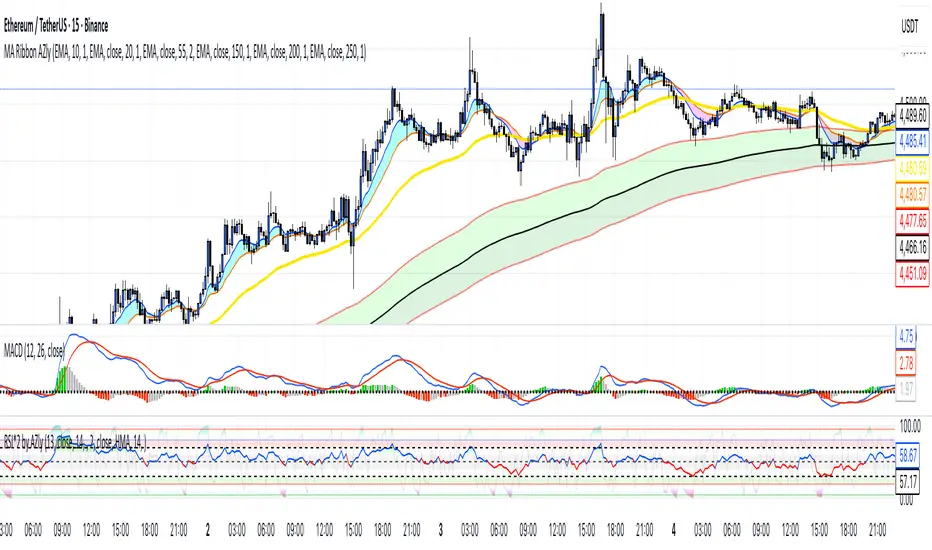
Moving Average Ribbon AZlyMoving Average Ribbon AZly The Moving Average Ribbon AZly is a flexible trend-following indicator that visualizes market direction, strength, and transition phases using multiple customizable moving averages. It helps traders instantly identify when short-, medium-, and long-term trends align or diverge. 🔧 How it works Up to six moving averages can be plotted, each with its own: Type (SMA, EMA, SMMA, WMA, VWMA, or HMA) Length, color, and width Custom source input The script also adds adaptive color fills between key pairs: MA1–MA2: short-term momentum MA4–MA5: mid-term bias MA5–MA6: long-term trend Bullish alignment paints green or blue ribbons, while bearish alignment turns them red or pink. The wider the ribbon, the stronger the trend separation. 💡 Why it’s better Unlike typical ribbon indicators, this version offers full per-line customization, adaptive color fills, and a clean, high-contrast design that makes trend shifts instantly recognizable . It’s optimized for clarity, flexibility, and smooth performance on any market or timeframe. 🎯 Trading ideas Trend confirmation: Trade only in the direction of the ribbon (green for long, red for short). Early reversals: Watch for the fastest MAs (MA1–MA2) crossing the mid-term pair (MA4–MA5) as early signals of a trend shift. Momentum compression: When the ribbon narrows or colors alternate rapidly, it signals consolidation or potential breakout zones. Pullback entries: Enter trades when price bounces off the outer ribbon layer in the direction of the dominant trend. Multi-timeframe use: Combine with a higher timeframe ribbon to confirm overall market bias. 📊 Recommended use Works on all markets and timeframes. Ideal for trend-following, swing trading, and visual confirmation of price structure.Penunjuk Pine Script®oleh YunakAZly22
EMA Trend Buy sell strategyThis strategy is built to help investors get into a trend safely and smartly — without rushing and without getting in and out too often. When to Buy: First Signal – Small Step In (50% Buy) When the short-term trend (EMA 18) turns positive and goes above the medium trend (EMA 33), 👉 we buy half of our planned position. This is an early warning that a new upward trend might be starting. Second Signal – Full Confidence (Buy other 50%) If the medium-term trend (EMA 33) also crosses above the long-term (EMA 50), 👉 we buy the other half of the position. Now we’re more confident that the trend is real. When to Sell: First Warning – Reduce Position (Sell 50%) If EMA 33 falls below EMA 50, 👉 we sell half of the position to reduce risk. Trend Reversal – Exit Completely (Sell the rest) If EMA 18 also falls below EMA 33, 👉 we sell the remaining half and leave the trade fully. Why This Strategy? 📉 We don’t jump in all at once. → We wait for confirmation before going full in. ⏳ We stay in the trade as long as the trend is healthy. → No overtrading or reacting to small moves. 📊 We get out slowly, not suddenly. → This helps protect profits and avoid emotional decisions.Strategi Pine Script®oleh BULLBEARFL233
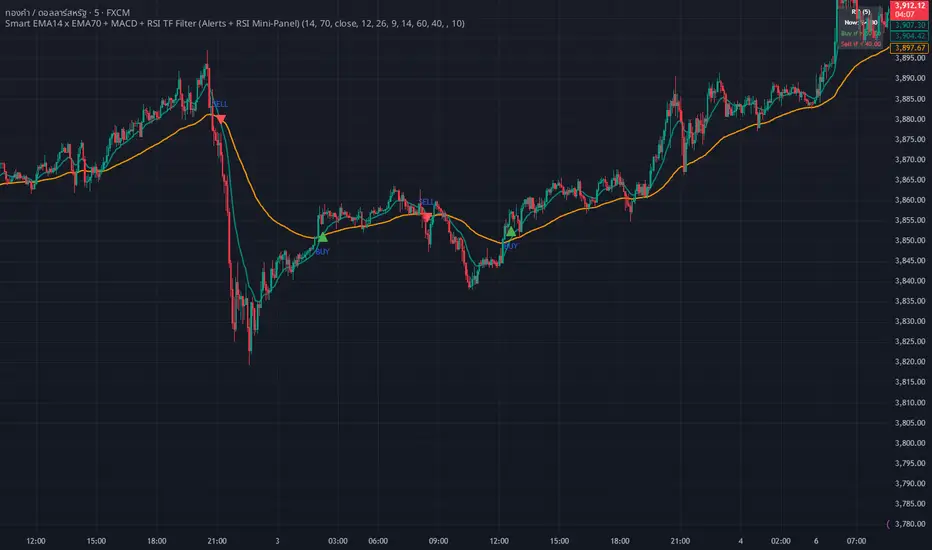
WHANG EMA-MACD🔥 Smart EMA14 x EMA70 + MACD Trend Alert System Description: Tired of chasing false signals? This simple but powerful indicator helps you catch real trend moves — not the noise. When EMA14 crosses EMA70 with MACD confirmation, and both EMAs point the same way, you’ll get a clean Buy or Sell alert right on your chart. No messy settings, no guessing — just clear signals in strong trends. ✨ Features: 🔔 Real-time alerts via “Any alert() function call” 🟢 Buy when EMA14 crosses above EMA70 + MACD > 0 🔴 Sell when EMA14 crosses below EMA70 + MACD < 0 📈 Trades only when both EMAs slope in the same direction ⚙️ Customizable inputs for any market or timeframe How to use: Add the indicator to your chart Create an alert → choose Any alert() function call Relax and wait for your signals — no need to watch every candle! Perfect for traders who want to follow the trend, avoid sideways traps, and get early alerts when momentum kicks in 🚀Penunjuk Pine Script®oleh NHUMNOOITelah dikemas kini 35
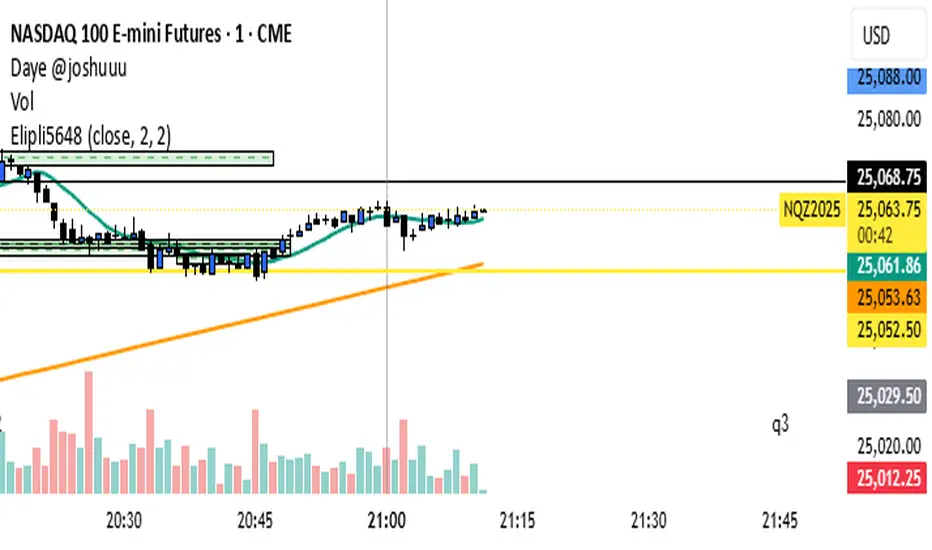
Elipli5648This indicator displays two moving averages on the same chart — the 9-period and 200-period simple moving averages (SMA). Both lines are customizable in color and line width directly from the settings menu. Useful for identifying short-term vs long-term trend direction.Penunjuk Pine Script®oleh a05568307124
elipli5648 , MA 9 & 200 (Combined) — clean versionThis indicator displays two moving averages on the same chart — the 9-period and 200-period simple moving averages (SMA). Both lines are customizable in color and line width directly from the settings menu. Useful for identifying short-term vs long-term trend direction.Penunjuk Pine Script®oleh a05568307126
RED RICHI EMA 34&55This indicator displays two exponential moving averages (EMA 34 & EMA 55) to identify mid-term trend direction. It also marks crossover points with green and red circles for bullish and bearish trend shifts. Penunjuk Pine Script®oleh Omri427
BTC 5-MA Multi Cross Strategy By Hardik Prajapati Ai TradelabThis strategy is built around the five most powerful and commonly used moving averages in crypto trading — 5, 20, 50, 100, and 200-period SMAs (Simple Moving Averages) — applied on a 1-hour Bitcoin chart. Core Idea: The strategy aims to identify strong bullish trends by confirming when the price action crosses above all key moving averages. This alignment of multiple MAs indicates momentum shift and helps filter out false breakouts. ⸻ ⚙️ How It Works: 1. Calculates 5 Moving Averages: • 5 MA → Short-term momentum (fastest signal) • 20 MA → Near-term trend confirmation • 50 MA → Mid-term trend filter • 100 MA → Long-term trend foundation • 200 MA → Macro-trend direction (strongest support/resistance) 2. Buy Condition (Entry): • A Buy is triggered when: • The price crosses above the 5 MA, and • The closing price remains above all other MAs (20, 50, 100, 200) This signals that momentum is aligned across all time horizons — a strong uptrend confirmation. 3. Sell Condition (Exit): • The position is closed when price crosses below the 20 MA, showing weakness in short-term momentum. 4. Visual Signals: • 🟢 BUY triangle below candles → Entry signal • 🔴 SELL triangle above candles → Exit signal • Colored MAs plotted for trend clarity. ⸻ 📈 Recommended Usage: • Chart: BTC/USDT • Timeframe: 1 Hour • Type: Trend-following crossover strategy • Ideal for: Identifying major breakout moves and confirming trend reversals. ⸻ ⚠️ Notes: • This script is meant for educational and backtesting purposes only. • Always apply additional confirmation tools (like RSI, Volume, or VIX-style filters) before live trading. • Works best during trending markets; may produce whipsaws in sideways zones.Strategi Pine Script®oleh hpstudio3d26
Multiple EMA/SMA v6This indicator plots up to eight Exponential Moving Averages (EMAs) and six Simple Moving Averages (SMAs) on the same chart. Each moving average can be individually customized or disabled by setting its length to 0. It’s designed for traders who want to visually compare multiple EMAs and SMAs with consistent styling and color-coding. Key features: Displays up to 14 customizable EMAs/SMAs. Adjustable line width and source (e.g., close, open, hlc3). Simple and performance-optimized structure. Clean color scheme for quick trend identification. Usage: Set any moving average length to 0 to hide it, or adjust lengths and colors to match your strategy. Ideal for identifying short-, mid-, and long-term trend alignments.Penunjuk Pine Script®oleh WolleTradet14
BanditExperimental %R and Moving Average Bands. This is just for fun :) Comment below if you spot a good pattern to trade.Penunjuk Pine Script®oleh llbot9
Multi-Timeframe 20 EMA PackMultiple 20 EMA's, each for a different time frame but all on the same chart. This will help you make sure that the 20EMA has been crossed on all time frames before taking action.Penunjuk Pine Script®oleh Marwan_Moallem5
MA Dist% Screener [Pineify]MA Distance Screener: Multi-Asset Market Scanner for TradingView Screen multiple symbols and multiple timeframes on TradingView with the MA Distance Screener. Compare asset prices to flexible moving average types. Visual table view, custom assets, timeframes, and MA types. Supercharge your TradingView screener, optimize your workflow, and catch opportunities across assets in real time. Key Features Screen up to 10 custom symbols simultaneously across four configurable timeframes. Choose from multiple Moving Average types: EMA, SMA, WMA, HMA, RMA, VWMA for flexible market context. Visualize real-time % distance between price and moving average per asset/timeframe in a clean, color-coded table. Highly customizable: Set your own symbol list, timeframes, MA length and type. Alerts for symbol/MA deviations—instantly see overbought/oversold status with intuitive background coloring. Optimized for crypto, FX, and traditional assets – all asset types supported. How It Works The MA Distance Screener acts as a dynamic multi-symbol, multi-timeframe scanner. For each selected symbol and timeframe, it calculates the percentage distance between the latest close price and the selected type of moving average (EMA/SMA/etc.). This is achieved by making secure `request.security` calls per asset/timeframe combination, retrieving updated values for each matrix cell. The computed distance (%) is displayed in a color-coded table: a positive value signals price above the MA (potential trend strength), while negatives indicate price below the MA (potential weakness or retracement). Custom colors highlight extreme overbought/oversold readings for quick visual cues. Trading Ideas and Insights Quickly spot assets showing the largest deviation from their moving averages – ideal for mean reversion or trend-following entries. Identify clusters of assets and timeframes lining up in overbought or oversold states; optimize entries with multi-timeframe confirmation. Scan the market in one glance—reduce chart-hopping and never miss an opportunity when multiple assets align for signals. The ability to scan distance-to-MA across assets and periods gives traders a statistical edge, surfacing hidden pivots, breakouts, and mean-reversion trades that single-chart analysis may miss. How Multiple Indicators Work Together At its core, this screener allows the trader to configure what gets scanned—pick your top 10 assets and favorite 4 timeframes. With each matrix cell, the selected MA (e.g., 14-period EMA) is recalculated, and the current price's distance (%) from that value is computed. By offering six distinct moving average algorithms (EMA, SMA, RMA, HMA, WMA, VWMA), traders can choose their preferred method, adapting the screener for trend, swing, or mean-reversion style. All values are visualized in a single table, creating a true "market dashboard" effect for real-time cross-asset assessment. Unique Aspects True cross-asset, cross-timeframe screening in a unified table—rare for Pine Script indicators. Full flexibility—customizable list of assets, timeframes, and MA parameters to suit any market/trading plan. Intuitive color-coding and table display eliminates guesswork, enabling “at-a-glance” screening and rapid decision-making. Efficient, optimized Pine v6 codebase—minimal lag even with 40+ concurrent streams. How to Use Add the indicator to your TradingView chart (overlay: off, use a clean chart). In the settings panel, enter up to 10 symbols (tickers) you want to screen—crypto, stocks, FX, or indices. Set the 4 timeframes to scan (e.g., 1m, 5m, 15m, 1h), plus your preferred moving average length and type. Review the results in the pop-up table, where each cell shows "% Distance" from MA for each symbol/timeframe. Monitor table background/text color for overbought vs. oversold cues. Customization Symbol List: Track any asset by typing its TradingView ticker. Timeframes: Full freedom to select 4 timeframes per scan, from 1min to monthly. MA Config: Choose period length and MA algorithm (classic or exotic types). Color Themes: Easily spot signals with dynamic color backgrounds and customizable thresholds. Conclusion The MA Distance Screener is a must-have tool for systematic traders, portfolio managers, and retail chartists seeking a true multi-asset edge. With real-time cross-checking against multiple moving averages and timeframes, it empowers faster, more confident decision-making, while reducing chart fatigue and missed setups. Unlock new insights, catch broad and hidden opportunities, and optimize your market workflow—all in a single TradingView panel. Penunjuk Pine Script®oleh Pineify54
Howard Intraday Edge (JH Edge) - (VWAP + EMA9/EMA21 + RSI)Howard Intraday Edge (JH Edge) A disciplined intraday trading system by J. Howard. Uses VWAP, EMA 9/21, RSI, and Optional EMA 200 to confirm trends and momentum. Automatically plots Clean stop-loss and take profit levels. Built for SPY 0DTE-5DTE options, but works on other liquid tickers. Focus: 1-3 high probability trades/day with tight risk control. Best used on 1 or 3 minute timeframes.Penunjuk Pine Script®oleh jhowardfla34
Multi-Timeframe Multi-EMA StatusMultiple changeable EMAs and Timeframes to tell you if the stock price is above or below them. Can be used on any ticker where EMAs can be used.Penunjuk Pine Script®oleh Altivolans16