Aljane's 1348ema strategy13/48ema crossover powerful setup
EMAs (13, 48, 200)
VWAP
buy/sell labels
Candles turn white on bullish , red on bearish
Ideal for traders who want a simplified but powerful chart setup without clutter.
Exponential Moving Average (EMA)

Aljane's 13/48 strategyThis indicator combines key moving averages (EMA 13, EMA 48, and EMA 200) with VWAP and SuperTrend to help identify market trends, reversals, and potential entry/exit points. EMA crosses provide momentum signals, VWAP tracks volume-weighted price, and SuperTrend highlights trend direction with buy/sell labels.

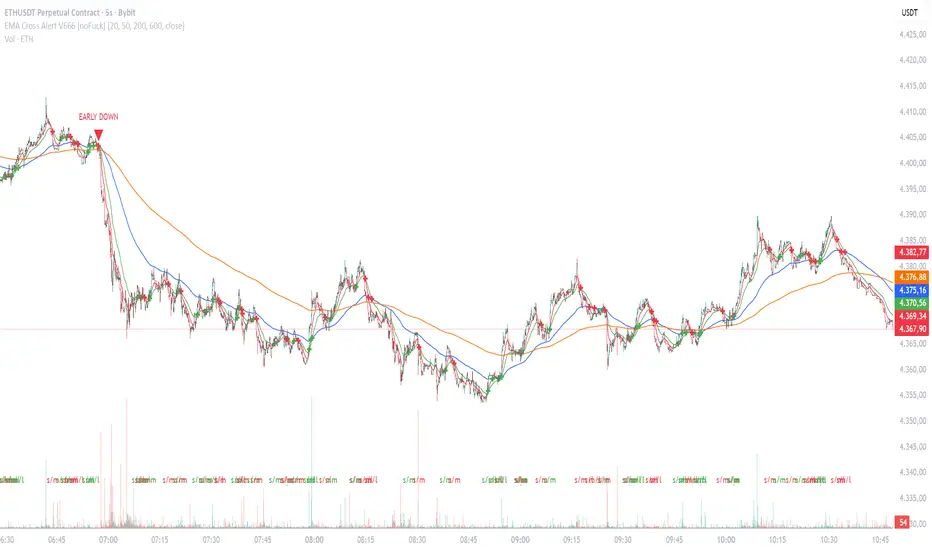
EMA Cross Alert V666 [noFuck]EMA Cross Alert — What it does
EMA Cross Alert watches three EMAs (Short, Mid, Long), detects their crossovers, and reports exactly one signal per bar by priority: EARLY > Short/Mid > Mid/Long > Short/Long. Optional EARLY mode pings when Short crosses Long while Mid is still between them—your polite early heads-up.
Why you might like it
Three crossover types: s/m, m/l, s/l
EARLY detection: earlier hints, not hype
One signal per bar: less noise, more focus
Clear visuals: tags, big cross at signal price, EARLY triangles
Alert-ready: dynamic alert text on bar close + static alertconditions for UI
Inputs (plain English)
Short/Mid/Long EMA length — how fast each EMA reacts
Extra EMA length (visual only) — context EMA; does not affect signals
Price source — e.g., Close
Show cross tags / EARLY triangles / large cross — visual toggles
Enable EARLY signals (Short/Long before Mid) — turn early pings on/off
Count Mid EMA as "between" even when equal (inclusive) — ON: Mid counts even if exactly equal to Short or Long; OFF (default): Mid must be strictly between them
Enable dynamic alerts (one per bar close) — master alert switch
Alert on Short/Mid, Mid/Long, Short/Long, EARLY — per-signal alert toggles
Quick tips
Start with defaults; if you want more EARLY on smooth/low-TF markets, turn “inclusive” ON
Bigger lengths = calmer trend-following; smaller = faster but choppier
Combine with volume/structure/risk rules—the indicator is the drummer, not the whole band
Disclaimer
Alerts, labels, and triangles are not trade ideas or financial advice. They are informational signals only. You are responsible for entries, exits, risk, and position sizing. Past performance is yesterday; the future is fashionably late.
Credits
Built with the enthusiastic help of Code Copilot (AI)—massively involved, shamelessly proud, and surprisingly good at breakfasting on exponential moving averages.
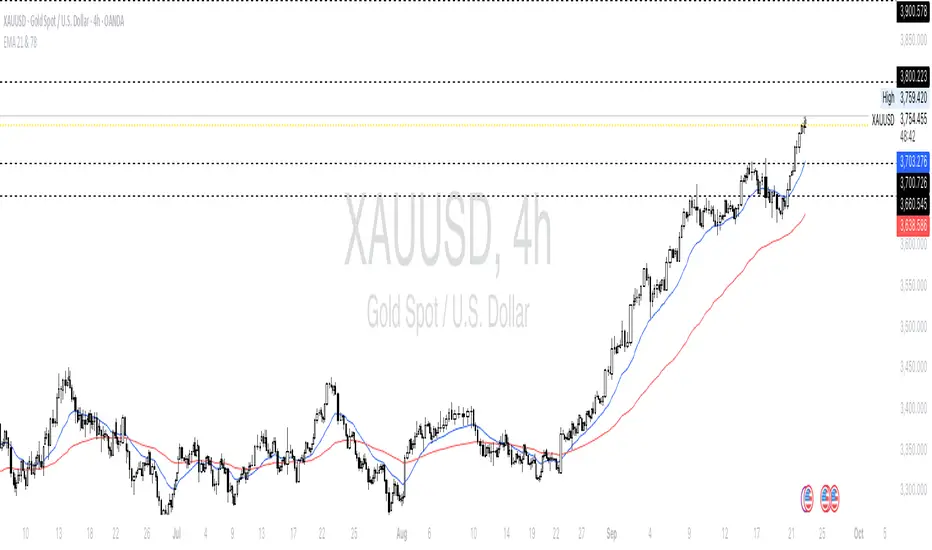
EMA 21 & 78 - With Instrument Nameonly add EMA21 and 78, I saw the 21 and 78 period is the most favor period when trading with gold
Triple Tap Sniper Triple Tap Sniper v3 – EMA Retest Precision System
Triple Tap Sniper is a precision trading tool built around the 21, 34, and 55 EMAs, designed to capture high-probability retests after EMA crosses. Instead of chasing the first breakout candle, the system waits for the first pullback into the EMA21 after a trend-confirming cross — the spot where professional traders often enter.
🔑 Core Logic
EMA Alignment → Trend defined by EMA21 > EMA34 > EMA55 (bullish) or EMA21 < EMA34 < EMA55 (bearish).
Cross Detection → Signals are only armed after a fresh EMA cross.
Retest Entry → Buy/Sell signals fire only on the first retest of EMA21, with trend still intact.
Pro Filters →
📊 Higher Timeframe Confirmation: Aligns signals with larger trend.
📈 ATR Volatility Filter: Blocks weak signals in low-vol chop.
📏 EMA Spread Filter: Ignores tiny “fake crosses.”
🕯️ Price Action Filter: Requires a proper wick rejection for valid entries.
🚀 Why Use Triple Tap Sniper?
✅ Filters out most false signals from sideways markets.
✅ Focuses only on clean trend continuations after pullbacks.
✅ Beginner-friendly visuals (Buy/Sell labels) + alert-ready for automation.
✅ Flexible: works across multiple timeframes & asset classes (stocks, crypto, forex).
⚠️ Notes
This is a signal indicator, not a full strategy. For backtesting and optimization, convert to a strategy and adjust filters per market/timeframe.
No indicator guarantees profits — use with sound risk management.

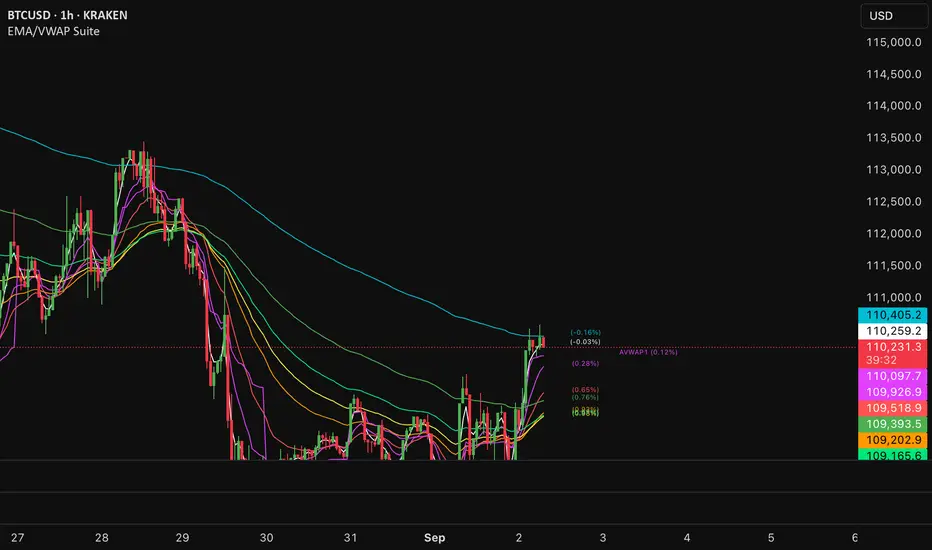
EMA/VWAP SuiteEMA/VWAP Suite
Overview
The EMA/VWAP Suite is a versatile and customizable Pine Script indicator designed for traders who want to combine Exponential Moving Averages (EMAs) and Volume Weighted Average Prices (VWAPs) in a single, powerful tool. It overlays up to eight EMAs and six VWAPs (three anchored, three rolling) on the chart, each with percentage difference labels to show how far the current price is from these key levels. This indicator is perfect for technical analysis, supporting strategies like trend following, mean reversion, and VWAP-based trading.
By default, the indicator displays eight EMAs and a session-anchored VWAP (AVWAP 1, in fuchsia) with their respective percentage difference labels, keeping the chart clean yet informative. Other VWAPs and their bands are disabled by default but can be enabled and customized as needed. The suite is designed to minimize clutter while providing maximum flexibility for traders.
Features
- Eight Customizable EMAs: Plot up to eight EMAs with user-defined lengths (default: 3, 9, 19, 38, 50, 65, 100, 200), each with a unique color for easy identification.
- EMA Percentage Difference Labels: Show the percentage difference between the current price and each EMA, displayed only for visible EMAs when enabled.
- Three Anchored VWAPs: Plot VWAPs anchored to the start of a session, week, or month, with customizable source, offset, and band multipliers. AVWAP 1 (session-anchored, fuchsia) is enabled by default.
- Three Rolling VWAPs: Plot VWAPs calculated over fixed periods (default: 20, 50, 100), with customizable source, offset, and band multipliers.
- VWAP Bands: Optional upper and lower bands for each VWAP, based on standard deviation with user-defined multipliers.
- VWAP Percentage Difference Labels: Display the percentage difference between the current price and each VWAP, shown only for visible VWAPs. Enabled by default to show the AVWAP 1 label.
- Customizable Colors: Each VWAP has a user-defined color via input settings, with labels matching the VWAP line colors (e.g., AVWAP 1 defaults to fuchsia).
Flexible Display Options: Toggle individual EMAs, VWAPs, bands, and labels on or off to reduce chart clutter.
Settings
The indicator is organized into intuitive setting groups:
EMA Settings
Show EMA 1–8 : Toggle each EMA on or off (default: all enabled).
EMA 1–8 Length : Set the period for each EMA (default: 3, 9, 19, 38, 50, 65, 100, 200).
Show EMA % Difference Labels : Enable/disable percentage difference labels for all EMAs (default: enabled).
EMA Label Font Size (8–20) : Adjust the font size for EMA labels (default: 10, mapped to “tiny”).
Anchored VWAP 1–3 Settings
Show AVWAP 1–3 : Toggle each anchored VWAP on or off (default: AVWAP 1 enabled, others disabled).
AVWAP 1–3 Color : Set the color for each VWAP line and its label (default: fuchsia for AVWAP 1, purple for AVWAP 2, teal for AVWAP 3).
AVWAP 1–3 Anchor : Choose the anchor period (“Session,” “Week,” “Month”; default: Session for AVWAP 1, Week for AVWAP 2, Month for AVWAP 3).
AVWAP 1–3 Source : Select the price source (default: hlc3).
AVWAP 1–3 Offset : Set the horizontal offset for the VWAP line (default: 0).
Show AVWAP 1–3 Bands : Toggle upper/lower bands (default: disabled).
AVWAP 1–3 Band Multiplier : Adjust the standard deviation multiplier for bands (default: 1.0).
Rolling VWAP 1–3 Settings
Show RVWAP 1–3 : Toggle each rolling VWAP on or off (default: disabled).
RVWAP 1–3 Color : Set the color for each VWAP line and its label (default: navy for RVWAP 1, maroon for RVWAP 2, fuchsia for RVWAP 3).
RVWAP 1–3 Period Length : Set the period for the rolling VWAP (default: 20, 50, 100).
RVWAP 1–3 Source : Select the price source (default: hlc3).
RVWAP 1–3 Offset : Set the horizontal offset (default: 0).
Show RVWAP 1–3 Bands : Toggle upper/lower bands (default: disabled).
RVWAP 1–3 Band Multiplier : Adjust the standard deviation multiplier for bands (default: 1.0).
VWAP Label Settings
Show VWAP % Difference Labels : Enable/disable percentage difference labels for all VWAPs (default: enabled, showing AVWAP 1 label).
VWAP Label Font Size (8–20) : Adjust the font size for VWAP labels (default: 10, mapped to “tiny”).
How It Works
EMAs : Calculated using ta.ema(close, length) for each user-defined period. Percentage differences are computed as ((close - ema) / close) * 100 and displayed as labels for visible EMAs when show_ema_labels is enabled.
Anchored VWAPs : Calculated using ta.vwap(source, anchor, 1), where the anchor is determined by the selected timeframe (Session, Week, or Month). Bands are computed using the standard deviation from ta.vwap.
Rolling VWAPs : Calculated using ta.vwap(source, length), with bands based on ta.stdev(source, length).
Labels : Updated on each new bar (ta.barssince(ta.change(time) != 0) == 0) to show percentage differences. Labels are only displayed for visible EMAs/VWAPs to avoid clutter.
Color Matching: VWAP labels use the same color as their corresponding VWAP lines, set via input settings (e.g., avwap1_color for AVWAP 1).
Example Use Cases
- Trend Following: Use longer EMAs (e.g., 100, 200) to identify trends and shorter EMAs (e.g., 3, 9) for entry/exit signals.
- Mean Reversion: Monitor percentage difference labels to spot overbought/oversold conditions relative to EMAs or VWAPs.
- VWAP Trading: Use the default session-anchored AVWAP 1 for intraday trading, adding weekly/monthly VWAPs or rolling VWAPs for broader context.
- Intraday Analysis: Leverage the session-anchored AVWAP 1 (enabled by default) for day trading, with bands as support/resistance zones.
Anchorman - EMA Channel + EMA + MTF Status Table PRICE BREAKOUTUses a high/low EMA Channel to tell you when strong price breakouts are happening plus comes with a EMA to help follow the trend if you like. I designed it so it can alert you when a single TF touch happens or a breakout alignment on MTF happens (I recommend this) its up to you also its single alert so no need to do bullish or bearish signals just one signal will alert you when a breakout happens in EITHER direction.

Customizable EMA 10/20/50/100Customizable EMA indicator. Fully adjustable with inputs so you can change EMA lengths and colors directly from the indicator settings panel.

AlgoFlex Buy Sell Signal (1h only)
**Overview**
AlgoFlex Scalper plots buy/sell signal markers using:
* a range filter (EMA of absolute bar changes) to define short-term bias,
* an Adaptive Moving Average (AMA) slope to confirm direction, and
* an ATR threshold to filter weak momentum.
Signals are evaluated on bar close to reduce intrabar noise. This is an indicator, not a strategy.
**How it works (concepts)**
* Range filter: smooths price with an EMA-based range measure and forms upper/lower bands.
* Trend state: counts consecutive movements of the filtered series (up/down counters) to avoid whipsaws.
* AMA + ATR gate: rising AMA with change > ATR \* atrMult can produce a long signal; falling AMA with change < -ATR \* atrMult can produce a short signal.
* TP/SL markers: projected using ATR multiples (tpMult, slMult). Visual guides only.
* Buy Signal, Sell Signal, plus optional TP/SL notifications. Designed to fire on bar close.

MEMA X-OL9+A. 5, 10, 20, 50 ema's
B. When the 10 goes below the 20 it has shades of red between the 10 and 20.
C. When there is a downward crossover, There will be a Red arrow pointing down.
D. When the 10 is moving closer (upward) towards the 20 it has orange shading. I use this to catch 10 over 20 crossovers.
E. When there is a crossover 10 over 20 it will shade green and have a gold arrow pointing upward. A little redundant, because you'll see the crossover from the shading.
F. Finally there will be smaller blue arrows that represent when there is a close of a candle, if it is lower than the prior candle.
All customizable and defaults should work.

EMA多空趋势信号The EMA multi-period moving average combination retains the Fibonacci sequence 144 for moving support and resistance. It also integrates 1ATR to facilitate users to set take-profit and stop-loss.
Signalgo VSignalgo V: Technical Overview and Unique Aspects
Signalgo V is a technical indicator for TradingView that integrates multiple layers of analysis: moving averages, MACD, Bollinger Bands and RSI to deliver buy and sell signals. Below is an informational breakdown of how the indicator functions, its input parameters, signal logic, exit methodology, and how it stands apart from traditional moving average (MA) tools, without disclosing specifics that allow for code duplication.
How Signalgo V Works
1. Multi-Layered Technical Synthesis
Signalgo V processes several technical studies simultaneously:
Fast/Slow Moving Averages: Uses either EMA or SMA (user-selected) with adjustable periods. These are central to initial trend detection through crossovers.
MACD Filter: MACD line vs. signal line cross-check ensures trend direction is supported by both momentum and MA structure.
RSI Confirmation: The RSI is monitored to verify that signals are not excessively overbought or oversold, tuning the system to changing momentum regimes.
Bollinger Bands Context: Entry signals are only considered when price action is beyond the Bollinger Bands envelope, which further filters for unusually strong movements.
These strict, multi-indicator entry criteria are designed to ensure only the most robust signals are surfaced, each is contingent on the presence of aligned trend, momentum and volatility.
2. Exit Methodology
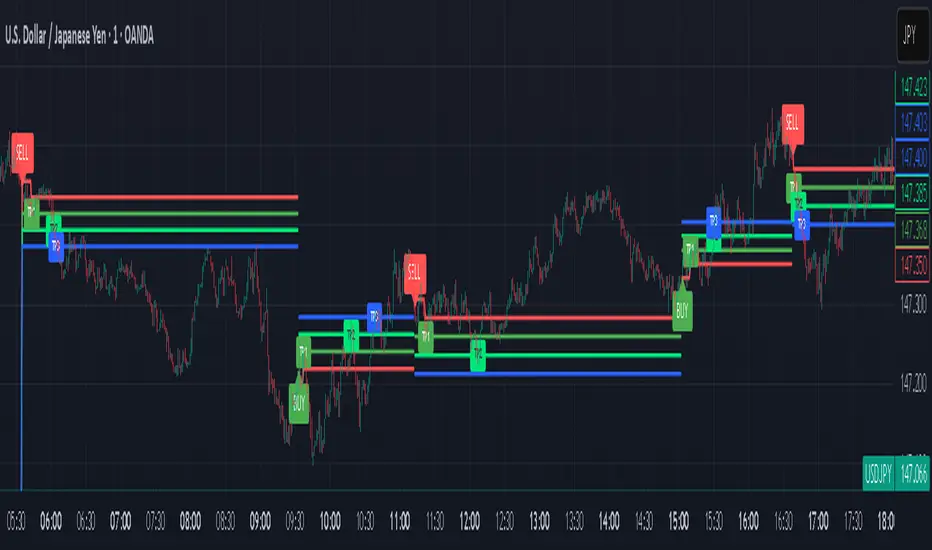
Take-Profit Levels: After entering a trade, the strategy automatically sets three predefined profit targets (TP1, TP2, TP3). If the price reaches any of these targets, the system marks it, helping you lock in profits at different stages.
Stop-Loss System: Simultaneously, a stop-loss (SL) value is set, protecting you from significant losses if the market moves against your position.
Dynamic Adjustment: When the first profit target (TP1) is hit, the system can automatically move the stop-loss to your entry price. This means your worst-case outcome is break-even from that point, reducing downside risk.
Trailing Stop-Loss: After TP1 is reached, a dynamic trailing stop can activate. This allows the stop-loss to follow the price as it moves in your favor, aiming to capture more profit if the trend continues, while still protecting your gains if the price reverses.
Visual Markers: The system plots all important exit levels (profit targets, stop-loss, trailing stop) directly on the chart. Optional labels also appear whenever a target or stop-loss is hit, making it easy to see progress.
Visual cues (labels) are plotted directly on the bar where a buy or sell signal triggers, clarifying entry points and aiding manual exit/risk management decisions.
Input Parameters
rsiLen: Lookback period for RSI calculation.
rsiOB and rsiOS: Overbought/oversold thresholds, adaptive to the indicator’s multi-layered logic.
maFastLen and maSlowLen: Periods for fast and slow MAs.
maType: EMA or SMA selectable for both MAs.
bbLen: Length for Bollinger Bands mean calculation.
bbMult: Standard deviation multiplier for BB width.
macdFast, macdSlow, macdSig: Standard MACD parameterization for nuanced momentum oversight.
What Separates Signalgo V from Traditional Moving Average Indicators
Composite Signal Architecture: Where traditional MA systems generate signals solely on MA crossovers, Signalgo V requires layered, cross-confirmational logic across trend (MAs), momentum (MACD), volatility (Bollinger Bands), and market strength (RSI).
Adaptive Volatility Context: MA signals only “count” when price is meaningfully breaking out of its volatility envelope, filtering out most unremarkable crosses that plague basic MA strategies.
Integrated Multi-Factor Filters: Strict compliance with all layers of signal logic is enforced. A marked improvement over MA strategies that lack secondary or tertiary confirmation.
Non-Redundant Event Limiting: Each entry is labeled as a unique event. The indicator does not repeat signals on subsequent bars unless all entry conditions are freshly met.
Trading Strategy Application
Trend Identification: By requiring concurrence among MA, MACD, RSI, and BB, this tool identifies only those trends with robust, multifactor support.
Breakout and Momentum Entry: Signals are bias-toward trades that initiate at likely breakout points (outside BB range), combined with fresh momentum and trend alignment.
Manual Discretion for Exits: The design is to empower traders with high-confidence entries and leave risk management or partial profit-taking adaptive to trader style, using visual cues from all component indicators.
Alert Generation: Each buy/sell event optionally triggers an alert, supporting systematic monitoring without constant chart watching.
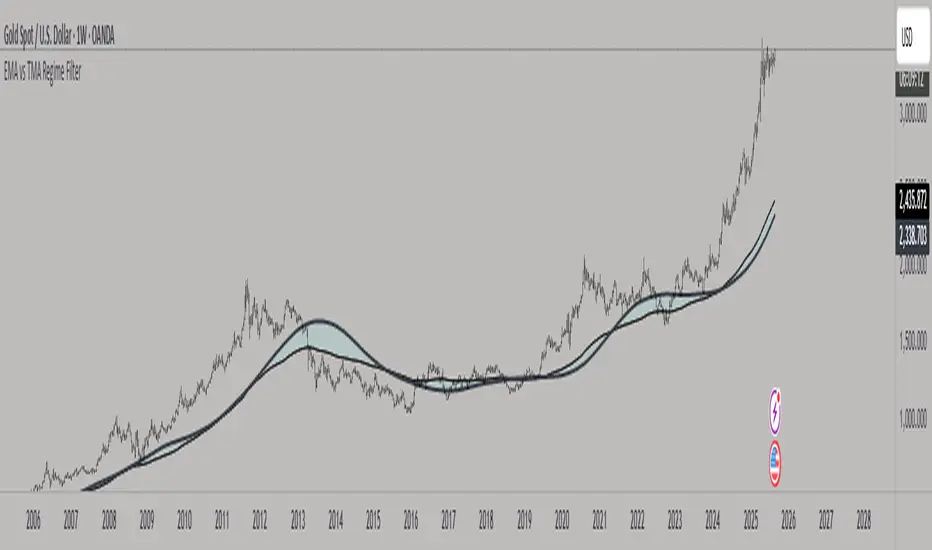
EMA vs TMA Regime FilterEMA vs TMA Regime Filter
This indicator is built as a visual study tool to compare the behavior of the Exponential Moving Average (EMA) and the Triangular Moving Average (TMA).
The EMA applies an exponential weighting to price data, giving stronger importance to the most recent values. This makes it a faster, more responsive line that reflects short-term momentum. The TMA, by contrast, applies a double-smoothing process (or in the “True TMA” option, a split SMA sequence), which produces a much slower curve. The TMA emphasizes balance over reactivity, often used for filtering noise and observing longer-term structure.
When both are plotted on the same chart, their differences become clear. The shaded region between them highlights times when short-term price dynamics diverge from longer-term smoothing. This is where the idea of “regime” comes in — not as a trading signal, but as a descriptive way of seeing whether market action is currently dominated by speed or by stability.
Users can customize:
Line styles, widths, and colors.
Cloud transparency for visual clarity.
Whether to color bars based on relative position (optional, purely visual).
The goal is not to create a system, but to help traders experiment, observe, and learn how different smoothing techniques can emphasize different aspects of price. By switching between the legacy and true TMA, or adjusting lengths, users can study how each approach interprets the same data differently.
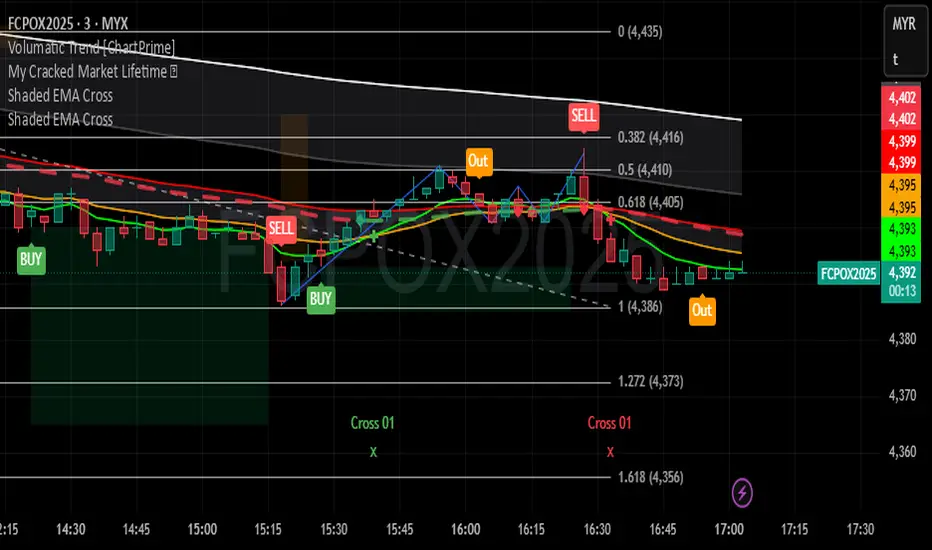
Shaded EMA CrossIndicator included 5 EMA's ( 9,20,50,100,200 ) with EMA cross marker
and shaded area between EMAs.
Shaded EMA100 and EMA200 to see market trend.
Shaded EMA20 and EMA50 to see market short trend.
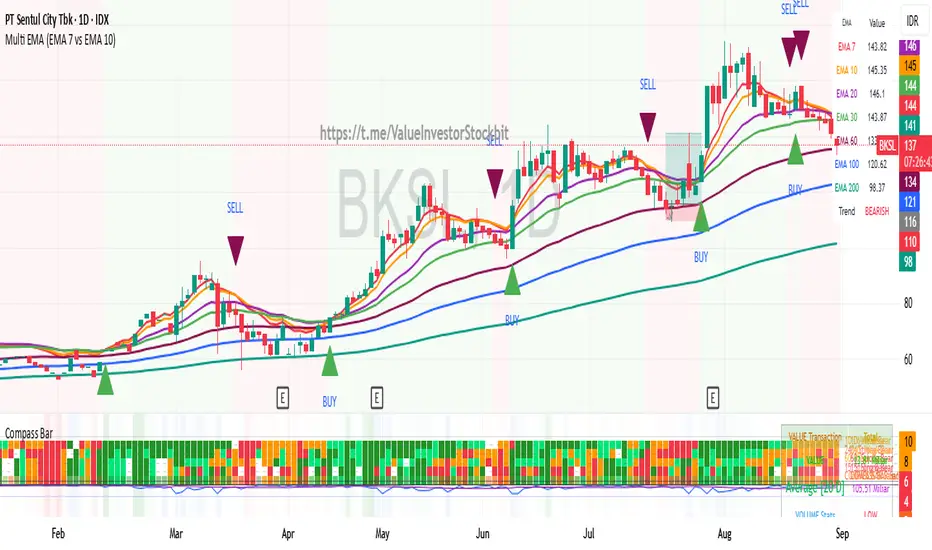
Multi Triple EMA Crossover [Salamun]Multi EMA Crossover Indicator Function:
1. Identifying Trends:
Short EMA (7, 10, 20) for short term trend
Intermediate EMA (30, 60, 100) for intermediate trends
Long EMA (200) for long term trend
The shorter the EMA period, the more sensitive it is to price changes.
2. Providing Entry/Exit Signals:
Green Arrow (BUY) : When fast EMA crosses above slow EMA = bullish momentum
Red Arrow (SELL) : When the fast EMA crosses below the slow EMA = bearish momentum
How to Read Indicators:
✅ Bullish Condition:
Price is above the majority of EMA
The short EMA is above the long EMA
Light green background
A green arrow appears.
❌ Bearish Condition:
Price is below the majority of EMA
The short EMA is below the long EMA
Pink background
A red arrow appears
📊 Tips Trading:
Trend confirmation : Make sure the EMAs are in sequence (EMA7 > EMA10 > EMA20 for uptrend)
Support/Resistance : EMA can function as dynamic support/resistance
Signal filter : Use higher timeframe for confirmation
Risk management : Do not trade against the 200 EMA trend.
The table on the top right displays the real-time values of all EMAs and the current trend status for easy quick analysis.
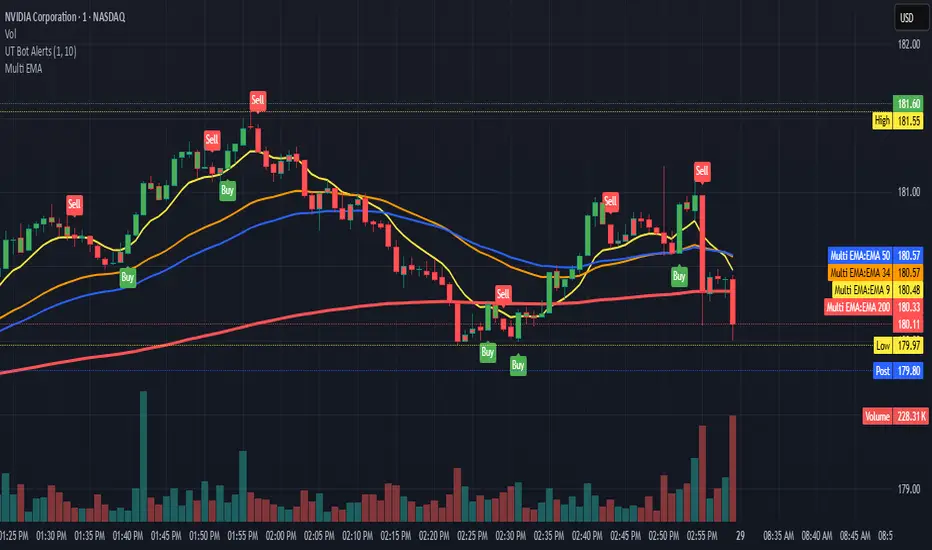
Multi-EMA System (9,34,50,200)This script gives you:
Yellow line: 9 EMA (your fastest momentum indicator)
Orange line: 34 EMA (good for short-term trend confirmation)
Blue line: 50 EMA (classic medium-term trend line)
Red line: 200 EMA (the big daddy - long-term trend and major support/resistance)
I made the 200 EMA a bit thicker since it's usually the most significant level. You can adjust the colors in the script if you prefer different ones.
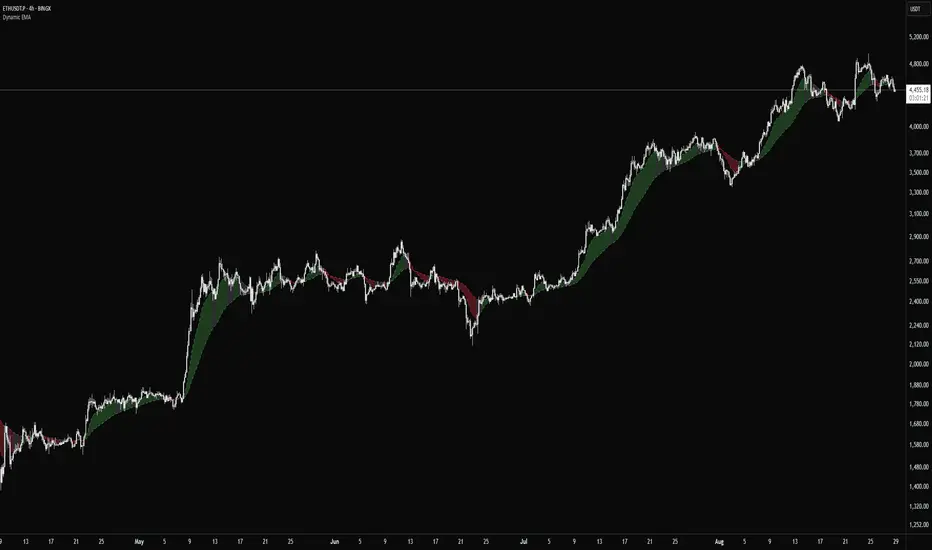
Dynamic EMADynamic EMA — Flexible Trend Indicator
Dynamic EMA is a clean and universal indicator that uses two Exponential Moving Averages to highlight market direction. By default, it applies the popular EMA 14/50 setup, but both EMA lengths can be freely customized.
Why EMA 14 and EMA 50?
The 14-period EMA is commonly used to capture short-term price momentum, making it sensitive to quick market moves.
The 50-period EMA reflects the medium-term trend and is widely recognized by traders and institutions.
Together, EMA 14/50 provide a balanced view: fast enough to react to price changes, yet smooth enough to filter out noise.
Key Features
Two EMAs (fast and slow) with fully adjustable lengths
Automatic dynamic coloring for bullish, bearish, and neutral conditions
Optional fill between EMAs for improved visualization
Adjustable opacity to control chart clarity
Why use it?
Dynamic EMA offers a reliable way to read market trends, spot momentum shifts, and confirm entries or exits. It works across all asset classes and timeframes, while allowing traders to adjust EMA settings to their own strategy.
EMA Crossover Alert with Pullback and Crossthis is mr. priyank sharma sir 's ema strategy indicator
it will plot buy or sell signal after ema break and opposite candle formed
it will aslo plot "cross" signal if price cross ema again
thank you priyanks sir for this awsome knowledge

BornInvestor MA CloudsBornInvestor MA Clouds
The BornInvestor MA Clouds script is a powerful, multi-layered moving average cloud system designed to help traders visualize market trends, momentum shifts, and crossover signals in a clear, intuitive way.
🔑 Features
Up to 5 customizable MA Clouds
Choose between SMA or EMA for each moving average.
Flexible input sources (Close, Open, High, Low, etc.).
Adjustable lengths for full control over short-, medium-, and long-term trend analysis.
Dynamic Cloud Coloring
Clouds automatically change color to reflect bullish or bearish momentum.
Customizable transparency and color schemes for each cloud.
Crossover Signals
Visual triangle markers appear when faster MAs cross above/below slower MAs.
Bullish crossovers are shown below bars, bearish crossovers above bars.
Alerts Ready 🚨
Built-in alert conditions for bullish and bearish crossovers (Cloud 1).
Alerts trigger once per bar for cleaner signals.
Clean Visuals
Option to show/hide individual MA lines.
Lightweight design optimized for clarity on any chart.
📊 How to Use
Clouds act as dynamic support/resistance zones. Price above the cloud signals bullish momentum, while price below the cloud signals bearish conditions.
Crossover signals help identify potential trend reversals or entry points.
Use multiple clouds (short, medium, long-term) for multi-timeframe confluence.
⚠️ Disclaimer
This script is for educational purposes only and not financial advice. Always combine with your own research and risk management before trading.
INE-VISION-PRO🎯 PROFESSIONAL EMA200 RIBBON INDICATOR
✨ FEATURES:
• Colored ribbon between EMA200 High and EMA200 Close
• Automatic trend detection (price above/below)
• Customizable sources (High/Close adjustable)
• Fully configurable colors
• Intuitive interface
🎨 SMART COLORS:
• GREEN: Price above EMA200 (bullish trend)
• RED: Price below EMA200 (bearish trend)
• GRAY: Neutral position
🔧 PARAMETERS:
• Adjustable EMA200 length
• Customizable High/Close sources
• Organized color group
• Ribbon display on/off
💡 Perfect for visually identifying trend zones and potential reversals on all timeframes.
📈 Developed for inemployable.com community
Simple EMA IndicatorSimple EMA Indicator by Ashwin Kumar. Includes all prominent timeframe moving averages on a single indicator.

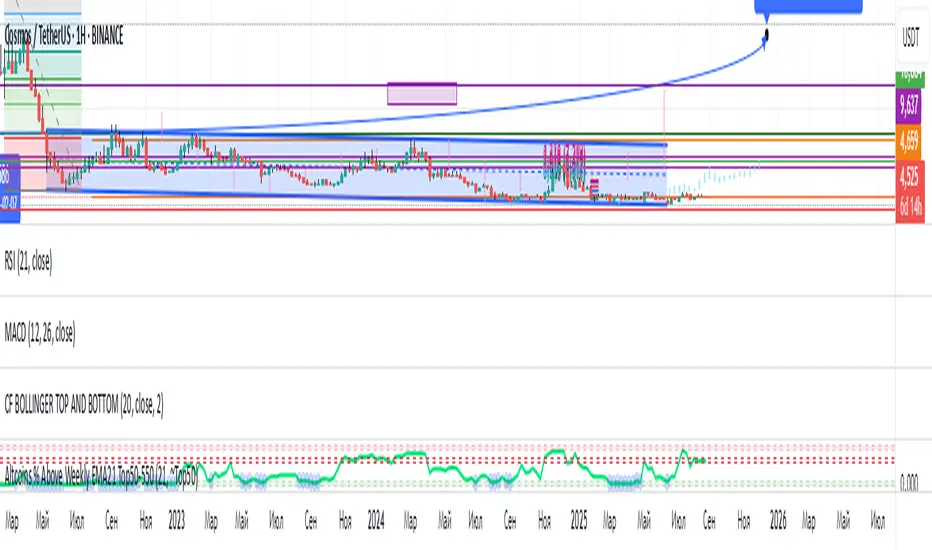
Altcoins % Above Weekly EMA21 Top50-550The indicator shows the percentage of altcoins trading above the weekly EMA21 within a selected group (Top50, Top150, Top550, or Personal).
It helps assess overall altcoin market strength, identify overbought/oversold zones, and spot potential entry or exit points.