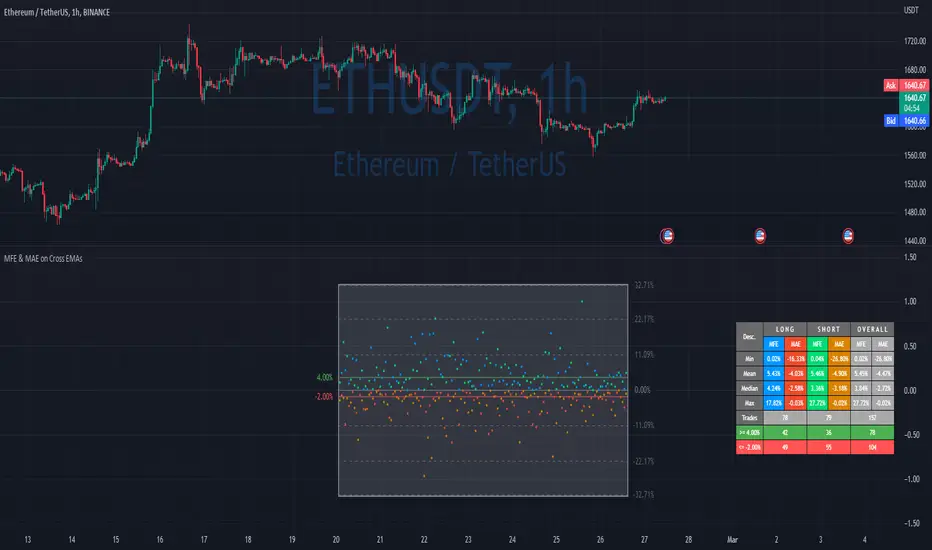
Advanced Optimized VSA - 15 MinThis script is written in Pine Script and is designed to be run on the TradingView trading platform. It is an advanced technical analysis indicator that utilizes various methods and indicators to generate trading signals based on a Volume Spread Analysis (VSA) approach.
Here's a detailed breakdown of its functionalities:
### Customizable Parameters:
1. `scoreLabel` and `TDLabel`: Customizable labels for score and trend direction.
2. `labelColorScore` and `labelColorTD`: Colors for the score and trend direction labels.
### Base Indicators and Variables:
1. `spread`: Calculates the difference between the high and low of a candle.
2. `emaVolume`: Exponential moving average of volume over a 21-period range.
3. `rsi14`: Relative Strength Index (RSI) over a 14-period range.
4. `sma200` and `ema50`: Simple moving average over a 200-period range and exponential moving average over a 50-period range, respectively.
5. `volatility`: Calculates the 14-period Average True Range (ATR) to determine volatility.
6. `trendDirection`: Establishes the trend direction based on the SMA200.
### Risk Management:
1. `atrValue`: Calculates the value of the ATR.
2. `stopLoss` and `takeProfit`: Calculates the stop-loss and take-profit levels based on the ATR.
### MACD:
Computes the MACD line, signal line, and histogram.
### Volume Analysis:
1. `weightedVol`: Weighted volume.
2. `forceFactor`: Measures the strength of price movement in relation to volume.
### Support and Resistance:
1. `support` and `resistance`: Calculates support and resistance levels based on the most recent 50 periods.
### Liquidity Check:
1. `isLiquid`: Checks if an asset is sufficiently liquid.
### Score Calculation:
Evaluates various factors such as price position relative to support/resistance levels, RSI, MACD, strength of movement, and volatility to generate a score.
### Criteria for Final Signals:
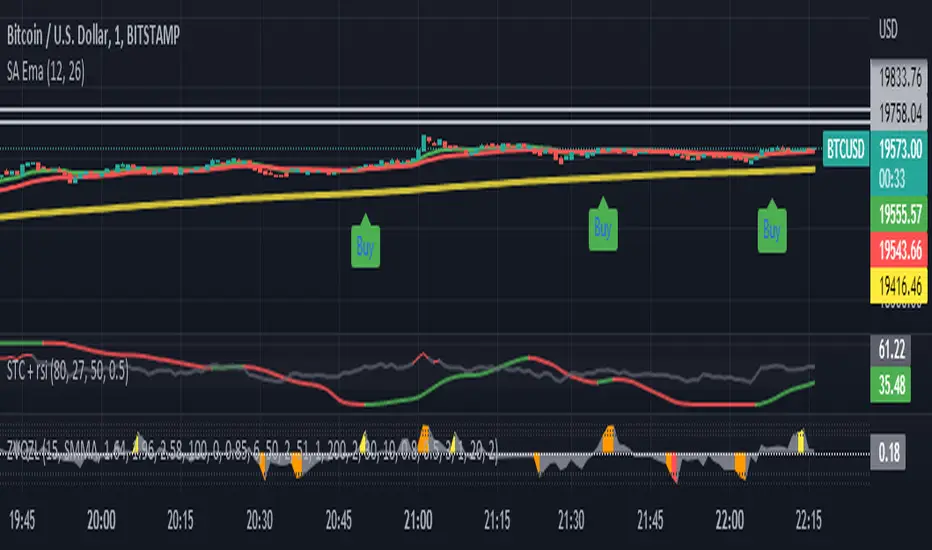
1. `isBullSpread` and `isBearSpread`: Generates a bullish or bearish signal based on various factors, including the score, trend direction, and liquidity.
### Notifications:
Generates alert conditions for bullish and bearish signals.
### Graphical Elements:
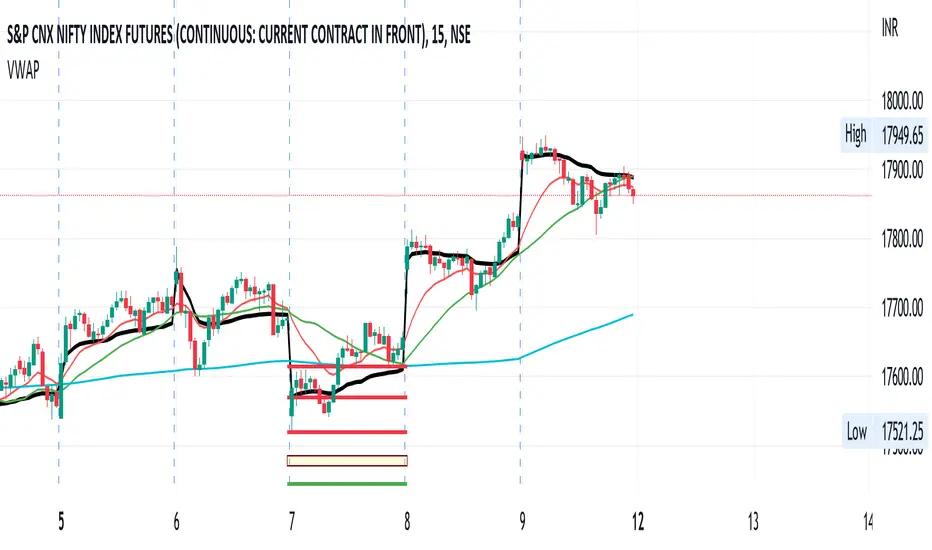
Displays various indicators and signals on the chart, including stop-loss, take-profit, SMA200, EMA50, and support and resistance lines.
### Debugging Labels:
Shows labels on the chart for score and trend direction.
The goal is to provide a comprehensive picture of the current asset, taking into consideration various factors and generating potentially profitable trading signals.
################################################################### ITALIANO ########################################################################################
##############################################################################################################################################################################################
Questo script è scritto in Pine Script e progettato per essere eseguito sulla piattaforma di trading TradingView. È un indicatore di analisi tecnica avanzata che utilizza diversi metodi e indicatori per generare segnali di trading basati su un approccio Volume Spread Analysis (VSA).
Ecco un riepilogo dettagliato delle funzionalità:
### Parametri personalizzabili:
1. `scoreLabel` e `TDLabel`: Etichette personalizzabili per i punteggi e la direzione del trend.
2. `labelColorScore` e `labelColorTD`: Colori delle etichette per punteggio e direzione del trend.
### Indicatori e variabili base:
1. `spread`: Calcola la differenza tra il massimo e il minimo di una candela.
2. `emaVolume`: Media mobile esponenziale del volume con un periodo di 21.
3. `rsi14`: RSI (Relative Strength Index) con un periodo di 14.
4. `sma200` e `ema50`: Media mobile semplice con un periodo di 200 e media mobile esponenziale con un periodo di 50, rispettivamente.
5. `volatility`: Calcola l'Average True Range (ATR) con un periodo di 14 per determinare la volatilità.
6. `trendDirection`: Stabilisce la direzione del trend basata sulla SMA200.
### Gestione del rischio:
1. `atrValue`: Calcola il valore dell'ATR.
2. `stopLoss` e `takeProfit`: Calcola i livelli di stop-loss e take-profit basati sull'ATR.
### MACD:
Calcola le linee MACD, segnale e l'istogramma.
### Analisi del volume:
1. `weightedVol`: Volume ponderato.
2. `forceFactor`: Misura la forza del movimento del prezzo in relazione al volume.
### Supporto e resistenza:
1. `support` e `resistance`: Calcola i livelli di supporto e resistenza basati sui 50 periodi più recenti.
### Verifica della liquidità:
1. `isLiquid`: Verifica se un asset è sufficientemente liquido.
### Calcolo del punteggio:
Valuta diversi fattori come la posizione del prezzo rispetto ai livelli di supporto/resistenza, RSI, MACD, forza del movimento e volatilità per generare un punteggio.
### Criteri per i segnali finali:
1. `isBullSpread` e `isBearSpread`: Genera un segnale rialzista o ribassista basato su vari fattori, incluso il punteggio, la direzione del trend e la liquidità.
### Notifiche:
Genera condizioni di allarme per segnali rialzisti e ribassisti.
### Elementi grafici:
Visualizza diversi indicatori e segnali sul grafico, inclusi stop-loss, take-profit, SMA200, EMA50, e linee di supporto e resistenza.
### Etichette di debug:
Mostra etichette sul grafico per il punteggio e la direzione del trend.
L'obiettivo è fornire un quadro completo dell'asset corrente, prendendo in considerazione diversi fattori e generando segnali di trading potenzialmente profittevoli.
Penunjuk Pine Script®