Advanced custom multi MA signals (EMA/SMA/VWMA/VWAP) Features of Multi Moving Averages
The biggest enemy in trading is "Noise." If you get swayed by minute fluctuations on the chart, you end up missing the forest for the trees.
This indicator (Advanced Custom Multi MA Signals) is not just a simple line. By combining the three core elements of Price, Time, and Volume, it acts as a navigation system that visualizes the market's "true trend." In particular, the ability to analyze 5 moving averages simultaneously across various timeframes is akin to viewing a 3D map of the battlefield.
Understanding Core Concepts
This indicator supports 4 types of moving averages. It is crucial to clearly understand the nature of each tool.
SMA (Simple Moving Average): The most basic average value. Since it produces fewer whipsaws (false signals), it is used as a baseline to judge the "long-term trend."
EMA (Exponential Moving Average): Places more weight on recent prices. It reacts sensitively to market changes, making it advantageous for identifying "entry points."
VWMA (Volume Weighted Moving Average): Incorporates "volume" into the price calculation. It acts as a "false signal filter," weeding out price moves that aren't backed by trading volume.
VWAP (Volume Weighted Average Price): The benchmark price used by institutional investors for daily trading. It is calculated based on the session, regardless of the period settings. It is considered the "lifeline" of day trading.
Indicator Settings Guide
Open the settings window and tune it to fit your trading style.
MA 01 ~ 05 (Moving Average Settings)
MA Type: Select according to your purpose. (Generally, EMA is recommended for short-term analysis, SMA/VWMA for long-term).
Length: Enter the period you wish to analyze (e.g., 20, 60, 120, 200).
Timeframe: This is the core feature. It allows you to overlay moving averages from a higher timeframe (e.g., 4-hour, Daily) onto the chart you are currently viewing (e.g., 15-minute).
Signal Option (Trading Signals)
Golden Cross (GC) / Death Cross (DC): Captures the moment the short-term line breaks through the long-term line. You can run up to 3 strategies simultaneously.
Ribbon Gradient (Trend Visualization)
Represents the gap between two moving averages with color. As the color deepens and the width expands, it indicates a powerful trend; if the width narrows, it suggests a high probability of a trend reversal.
5 Usage Strategies
The highlight of this indicator is the cross strategy utilizing the "Multi-Timeframe (MTF)" feature. Familiarize yourself with the 5 example strategies below and set up your own strategy based on your expertise.
💡 Tip 1. Do not go against the "Major Trend" (The Authority of the Weekly Candle)
Settings: Set MA5 to .
Interpretation: The Weekly 50 line is the "major trend line" managed by institutions and market makers. If the current price is above this line, maintain only a "Buy (Long)" bias; if below, maintain only a "Sell (Short)" bias. Adhering to this rule alone can help you avoid massive losses.
💡 Tip 2. Highly Reliable "Swing Signal" (Daily Golden Cross)
Settings: In Signal 1, configure the Short MA to and the Long MA to .
Interpretation: A Golden Cross where the 4-Hour 50 EMA breaks above the Daily 50 EMA often signifies a major "trend reversal" rather than a temporary rebound. This provides an ideal entry signal for office workers or swing traders who need high reliability.
💡 Tip 3. 4-Hour Candle as the Standard for "Precision Entry"
Situation: When the Daily trend is rising (Bullish alignment).
Strategy: While watching the 15-minute or 1-hour chart, set the indicator's Signal 2 to the cross of and .
Interpretation: When the Daily chart is in an uptrend, a Golden Cross occurring on the 4-Hour chart marks "the point where a correction (pullback) ends and the rise resumes." This is the entry point with the best risk-to-reward ratio.
💡 Tip 4. Filtering Out "Fake Signals" (The Secret of Volume)
Strategy: When creating a cross signal, try using VWMA (Volume Weighted) for the Long MA, even if you use EMA for the Short MA.
Reason: A Golden Cross caused simply by a rise in price can be a trap. However, if it breaks through the heavy VWMA line accompanied by volume, it is strong evidence that "genuine liquidity" has entered.
💡 Tip 5. Remember the "Hierarchy" (Higher Timeframe Priority Rule)
Principle: If a Golden Cross (Buy Signal) appears on the 4-Hour chart, but the Daily chart is in a Death Cross (Sell Signal) state, do not enter.
Interpretation: A signal from a lower timeframe cannot overcome the power of a higher timeframe. The professional approach is to trade with significant volume only when signals align (Sync) in the order of Weekly > Daily > 4-Hour. Keep this indicator's dashboard feature on and always check the status of higher timeframes.
Signal Generation Principle (Operating Mechanism)
Signals are generated when the set short-term moving average and long-term moving average cross each other.
📈 1. Golden Cross (BUY = Buy Signal)
Situation: The moment the short-term MA crosses upward from below the long-term MA.
Principle: It implies that recent buying pressure has broken through the resistance level accumulated over a long period.
📉 2. Death Cross (SELL = Sell Signal)
Situation: The moment the short-term MA crosses downward from above the long-term MA.
Principle: It implies that recent selling pressure has collapsed the long-term support line.
※ If the candles are not displaying correctly or are flickering, please set the indicator's 'Visual order' to 'Bring to front' as shown in the image below.
Investment Caution and Disclaimer
Before using this indicator for actual trading, please strictly read the contents below.
① Auxiliary indicators are a "Compass," not a "Book of Prophecy."
This indicator is merely a tool that mathematically calculates and visualizes past price data. A "magic indicator" that predicts future price fluctuations 100% accurately or guarantees profit does not exist. The signals provided are for reference only and must never be the sole basis for entry/exit decisions.
② The responsibility for all investments lies with "Yourself."
Financial investment (Cryptocurrencies, Stocks, Futures, etc.) involves high volatility and is a risky activity that can result in the loss of some or all of the principal. The final responsibility for all trading results (profits and losses) incurred by utilizing this indicator lies entirely with the investor. The distributor and developer accept no legal responsibility for investment results under any circumstances.
③ Past data does not guarantee the future.
Even a Golden Cross that fit perfectly in backtesting or past charts may operate differently in tomorrow's market situation (News, Macroeconomics, Unexpected Variables, etc.). Do not rely solely on technical analysis; you must conduct fundamental analysis and risk management in parallel.
④ Risk management is the top priority.
No matter how promising a signal appears, "all-in trading" (investing all assets in a single trade) is a shortcut to bankruptcy. More important than the indicator itself is adhering to the principles of strict scaling in (split buying) and Stop-Loss.
Emassignal

Kinetic EMA & Volume with State EngineKinetic EMA & Volume with State Engine (EMVOL)
1. Introduction & Concept
The EMVOL indicator converts a dense family of EMA signals and volume flows into a compact “state engine”. Instead of looking at individual EMA lines or simple crossovers, the script treats each EMA as part of a kinetic vector field and classifies the market into interpretable states:
- Trend direction and strength (from a grid of prime‑period EMAs).
- Volume regime (expansion, contraction, climax, dry‑up).
- Order‑flow bias via delta (buy versus sell volume).
- A combined scenario label that summarises how these three layers interact.
The goal is educational: to help traders see that moving averages and volume become more meaningful when observed as a structure, not as isolated lines. EMVOL is therefore designed as a real‑time teaching tool, not as an automatic signal generator.
2. Volume Settings
Group: “Volume Settings”
A. Calculation Method
- Geometry (Source File) – Default mode.
Buy and sell volume are estimated from each candle’s geometry: the close is compared to the high/low range and the bar’s total volume is split proportionally between buyers and sellers. This approximation works on any TradingView plan and does not require lower‑timeframe data.
- Intrabar (Precise) – Reconstructs buy/sell volume using a lower timeframe via requestUpAndDownVolume(). The script asks TradingView for historical intrabar data (e.g., 15‑second bars) and builds buy/sell volume and delta from that stream. This mode can produce a more accurate view of order flow, but coverage is limited by your account’s history limits and the symbol’s available lower‑timeframe data.
B. Intrabar Resolution (If Precise)
- Intrabar Resolution (If Precise) – Selected only when the calculation method is “Intrabar (Precise)”. It defines which lower timeframe (for example 15S, 30S, 1m) is used to compute up/down volume. Smaller intrabar timeframes may give smoother and more granular deltas, but require more historical depth from the platform.
When “Intrabar (Precise)” is active, the dashboard’s extended section shows the resolution and the number of bars for which precise volume has been successfully retrieved, in the format:
- Mode: Intrabar (15S) – where N is the count of bars with valid high‑resolution volume data.
In Geometry mode this counter simply reflects the processed bars in the current session.
3. Kinetic Vector Settings
Group: “Kinetic Vector”
A. Vector Window
- Vector Window – Controls the temporal smoothing applied to the aggregated vectors (trend, volume, delta, etc.). Internally, each bar’s vector value is averaged with a simple moving window of this length.
- Shorter windows make the state engine more reactive and sensitive to local swings.
- Longer windows make the states more stable and better suited to higher‑timeframe structure.
B. Max Prime Period
- Max Prime Period – Sets the largest prime number used in the EMA grid. The engine builds a family of EMAs on prime lengths (2, 3, 5, 7, …) up to this limit and converts their slopes into angles.
- A higher limit increases the number of long‑horizon EMAs in the grid and makes the vectors sensitive to broader structure.
- A lower limit focuses the analysis on short- and medium‑term behaviour.
C. Price Source
- Price Source – The price series from which the kinetic EMA grid is built (e.g., Close, HLC3, OHLC4). Changing the source modifies the context that the state engine is reading but does not change the core logic.
4. State Engine Settings
Group: “State Engine Settings”
These inputs define how the continuous vectors are translated into discrete states.
A. Trend Thresholds
- Strong Trend Threshold – Value above which the trend vector is treated as “extreme bullish” and below which it is “extreme bearish”.
- Weak Trend Threshold – Inner boundary between neutral and directional conditions.
Roughly:
- |trend| < weak → Neutral trend state.
- weak < |trend| ≤ strong → Bullish/Bearish.
- |trend| > strong → Extreme Bullish/Extreme Bearish.
B. Volume Thresholds
- Volume Climax Threshold – Upper bound at which volume is considered “climax” (unusually expanded participation).
- Volume Expansion Threshold – Boundary for normal expansion versus contraction.
Conceptually:
- Volume above “expansion” indicates increasing activity.
- Volume near or above “climax” marks extreme participation.
- Negative values below the symmetric thresholds map to contraction and extreme dry‑up (liquidity vacuum) states.
C. Delta Thresholds
- Strong Delta Threshold – Cut‑off for extreme buying or selling dominance in delta.
- Weak Delta Threshold – Threshold for mild buy/sell bias versus neutral order flow.
Combined with the sign of the delta vector, these thresholds classify order flow as:
- Extreme Buy, Buy‑Dominant, Neutral, Sell‑Dominant, Extreme Sell.
D. State Hysteresis Bars
- State Hysteresis Bars – Minimum number of bars for which a new state must persist before the engine commits to the change. This prevents the dashboard from flickering during fast spikes and emphasises persistent market behaviour.
- Smaller values switch states quickly; larger values demand more confirmation.
5. Visual Interface
Group: “Visual Interface”
A. Ribbon Base Color
- Ribbon Base Color – Base hue for the multi‑layer EMA ribbon drawn around price. The script plots a dense grid of hidden EMAs and fills the gaps between them to form a semi‑transparent band. Narrow, overlapping bands hint at compression; wider separation hints at dispersion across EMA horizons.
B. Show Dashboard
- Show Dashboard – Toggles the on‑chart table which summarises the current state engine output. Disable this if you only want to keep the EMA ribbon and volume‑based structure on the price chart.
C. Color Theme
- Color Theme – Switch between a dark and light style for the dashboard background and text colours so that the table matches your chart theme.
D. Table Position
- Table Position – Places the dashboard at any corner or edge of the chart (Top / Middle / Bottom × Left / Centre / Right).
E. Table Size
- Table Size – Changes the dashboard’s text size (Tiny, Small, Normal, Large). Use a larger size on high‑resolution screens or when streaming.
F. Show Extended Info
- Show Extended Info – Adds diagnostic rows under the main state summary:
- Mode / Primes / Vector – Shows the current calculation mode (Geometry / Intrabar), the selected intrabar resolution and coverage in bars ( ), how many prime periods are active, and the vector window.
- Values – Displays the current aggregated vectors:
- P: price vector
- V: volume vector
- B: buy‑volume vector
- S: sell‑volume vector
- D: delta vector
Values are bounded between ‑1 and +1.
- Volume Stats – Prints the last bar’s raw buy volume, sell volume and delta as formatted numbers.
- Footer – A final row with the symbol and current time: #SYMBOL | HH:MM.
These extended rows are meant for inspecting how the engine is behaving under the hood while you scroll the chart and compare different assets or timeframes.
6. Language Settings
Group: “Language Settings”
- Select Language – Switches the entire dashboard between English and Turkish.
The underlying calculations and scenario logic are identical; only the labels, titles and comments in the table are translated.
7. Dashboard Structure & Reading Guide
The table summarises the current situation in a few rows:
1. System Header – Shows the script name and the active calculation method (“Geometry” or “Intrabar”).
2. Scenario Title – High‑level description of the current combined scenario (e.g., “Trending Buy Confirmed”, “Sideways Balanced”, “Bull Trap”, “Blow‑Off Top”). The background colour is derived from the scenario family (trending, compression, exhaustion, anomaly, etc.).
3. Bias / Trend Line – States the dominant trend bias derived from the trend vector (Extreme Bullish, Bullish, Neutral, Bearish, Extreme Bearish).
4. Signal / Consideration Line – A short sentence giving qualitative guidance about the current state (for example: continuation risk, exhaustion risk, trap‑like behaviour, or compression). This is deliberately phrased as a consideration, not as a direct trading signal.
5. Trend / Volume / Delta Rows – Three separate rows explain, in plain language, how the trend, volume regime and delta are classified at this bar.
6. Extended Info (optional) – Mode / primes / vector settings, current vector values, and last‑bar volume statistics, as described above.
Together, these rows are meant to be read as a narrative of what price, volume and order‑flow are doing, not as mechanical instructions.
8. State Taxonomy
The state engine organizes market behaviour in three stages.
8.1 Trend States (from the Price Vector)
- Extreme Bullish Trend – The prime‑grid price vector is strongly upward; most EMAs are aligned to the upside.
- Bullish Trend – Upward bias is present, but less extreme.
- Neutral Trend – EMAs are mixed or flat; price is effectively sideways relative to the grid.
- Bearish Trend – Downward bias, with the EMA grid sloping down.
- Extreme Bearish Trend – Strong downside alignment across the grid.
8.2 Volume Regime States (from the Volume Vector)
- Volume Climax (Buy‑Side) – Strong positive volume vector; participation is unusually high in the current direction.
- Volume Expansion – Activity above normal but below the climax threshold.
- Neutral Volume – No major expansion or contraction versus recent history.
- Volume Contraction – Activity is drying up compared with the past.
- Extreme Dry‑Up / Liquidity Vacuum – Very low participation; the market is thin and prone to slippage.
8.3 Delta Behaviour States (from the Delta Vector)
- Extreme Buy Delta – Buying pressure dominates strongly.
- Buy‑Dominant Delta – Buy volume exceeds sell volume, but not at an extreme.
- Neutral Delta – Buy and sell flows are roughly balanced.
- Sell‑Dominant Delta – Selling pressure dominates.
- Extreme Sell Delta – Aggressive, one‑sided selling.
8.4 Combined Scenario State s
EMVOL uses the three base states above to generate a single scenario label. These scenarios are designed to be read as context, not as entry or exit signals.
Trending Scenarios
1. Trending Buy Confirmed
- Bullish or extreme bullish trend, supported by expanding or climax volume and buy‑side delta.
- Educational idea: a healthy uptrend where both participation and order flow agree with the direction.
2. Trending Buy – Weak Volume
- Bullish trend, but volume is neutral, contracting or in dry‑up while delta is still buy‑side.
- Educational idea: price is advancing, yet participation is thinning; trend continuation becomes more fragile.
3. Trending Sell Confirmed
- Bearish or extreme bearish trend, with expanding or climax volume and sell‑side delta.
- Educational idea: strong downtrend with both volume and order‑flow confirmation.
4. Trending Sell – Weak Volume
- Bearish trend, but volume is neutral, contracting or very low while delta remains sell‑side.
- Educational idea: downside continues but with limited participation; vulnerable to short‑covering.
Sideways / Range Scenarios
5. Sideways Balanced
- Neutral trend, neutral delta, neutral volume.
- Classic range environment; low directional edge, suitable for observation and context rather than trend trading.
6. Sideways with Buy Pressure
- Neutral trend, but buy‑side delta is dominant or extreme.
- Range with latent accumulation: price may still appear sideways, but buyers are quietly more active.
7. Sideways with Sell Pressure
- Neutral trend with dominant or extreme sell‑side delta.
- Distribution‑like environment where price chops while sellers are gradually more aggressive.
Exhaustion & Volume Extremes
8. Exhaustion – Buy Risk
- Extreme bullish trend, volume climax and strong buy‑side delta.
- Educational idea: very strong up‑move where both participation and delta are already stretched; risk of exhaustion or blow‑off.
9. Exhaustion – Sell Risk
- Extreme bearish trend, volume dry‑up and strong sell‑side delta.
- Suggests one‑sided selling into increasingly thin liquidity.
10. Volume Climax (Buy)
- Neutral trend, neutral delta, but volume at climax levels.
- Often associated with a “big event” bar where participation spikes without a clear directional commitment.
11. Volume Climax (Sell / Dry‑Up)
- Neutral trend and neutral delta, while the volume vector indicates an extreme dry‑up.
- Highlights a stand‑still episode: very limited interest from both sides, increasing the sensitivity to future impulses.
Divergences
12. Divergence – Bullish Context
- Bullish or extreme bullish trend, but delta has faded back to neutral.
- Price trend continues while order‑flow conviction softens; can precede pauses or complex corrections.
13. Divergence – Bearish Context
- Bearish or extreme bearish trend with a neutral delta.
- Downtrend persists, but selling pressure no longer dominates as clearly.
Consolidation & Compression
14. Consolidation
- Default state when no specific pattern dominates and the market is broadly balanced.
- Educational use: treat this as a “no strong edge” label; focus on structure rather than direction.
15. Breakout Imminent
- Neutral trend with contracting volume.
- Compression phase where energy is building up; often precedes transitions into trending or shock scenarios.
Traps & Hidden Divergences
16. Bull Trap
- Bullish trend, with neutral or contracting volume and sell‑side delta.
- Price appears strong, but order‑flow shifts against it; often seen near fake breakouts or failing rallies.
17. Bear Trap
- Bearish trend, neutral or contracting volume, but buy‑side delta.
- Downtrend “looks” intact, while buyers become more aggressive underneath the surface.
18. Hidden Bullish Divergence
- Bullish trend, contracting volume, but strong buy‑side delta.
- Educational idea: price dips or slows while aggressive buyers step in, often inside an ongoing uptrend.
19. Hidden Bearish Divergence
- Bearish trend, volume expansion and strong sell‑side delta.
- Reinforced downside pressure even if price is temporarily retracing.
Reversal & Transition Patterns
20. Reversal to Bearish
- Neutral trend, volume climax and strong sell‑side delta.
- Suggests that heavy selling appears at the top of a move, turning a previously neutral or rising context into potential downside.
21. Reversal to Bullish
- Neutral trend, extreme volume dry‑up and strong buy‑side delta.
- Often associated with selling exhaustion where buyers start to take control.
22. Indecision Spike
- Neutral trend with extreme volume (climax or dry‑up) but neutral delta.
- Crowd participation changes sharply while order‑flow remains undecided; treat as an informational spike rather than a direction.
Extended Compression & Acceleration
23. Coiling Phase
- Neutral trend, contracting volume, and delta that is neutral or only mildly one‑sided.
- Extended compression where price, volume and delta all contract into a tightly coiled range, often preceding a strong move.
24. Bullish Acceleration
- Bullish trend with volume expansion and strong buy‑side delta.
- Uptrend not only continues but gains kinetic strength; educationally, this illustrates how trend, volume and delta align in the strongest phases of a move.
25. Bearish Acceleration
- Bearish trend with volume expansion and strong sell‑side delta.
- Mirror image of Bullish Acceleration on the downside.
Trend Exhaustion & Climax Reversal
26. Bull Exhaustion
- Bullish or extreme bullish trend, with contraction or dry‑up in volume and buy‑side or neutral delta.
- The move has already travelled far; participation fades while price is still elevated.
27. Bear Exhaustion
- Bearish or extreme bearish trend, with volume climax or contraction and sell‑side or neutral delta.
- Down‑move may be approaching a point where additional selling pressure has diminishing impact.
28. Blow‑Off Top
- Extreme bullish trend, volume climax and extreme buy delta all at once.
- Classic blow‑off behaviour: price, volume and order‑flow are simultaneously stretched in the same direction.
29. Selling Climax Reversal
- Extreme bearish trend with extreme volume dry‑up and extreme sell‑side delta.
- Marks a very aggressive capitulation phase that can precede major rebounds.
Advanced VSA / Anomaly Scenarios
30. Absorption
- Typically neutral trend with expanding or climax volume and extreme delta (either buy or sell).
- Educational focus: large participants are aggressively absorbing liquidity from the opposite side, while price remains relatively contained.
31. Distribution
- Scenario where volume remains elevated while directional conviction weakens and the trend slows.
- Represents potential “selling into strength” or “buying into weakness”, depending on the active side.
32. Liquidity Vacuum
- Combination of thin liquidity (extreme dry‑up) with a directional trend or strong delta.
- Highlights environments where even small orders can move price disproportionately.
33. Anomaly / Shock Event
- Triggered when the vector z‑scores detect rare combinations of price, volume and delta behaviour that deviate from their own historical distribution.
- Intended as a warning label for unusual events rather than a specific tradeable pattern.
9. Educational Usage Notes
- EMVOL does not produce mechanical “buy” or “sell” commands. Instead, it classes each bar into an interpretable state so that traders can study how trends, volume and order‑flow interact over time.
- A common exercise is to overlay your usual EMA crossovers, support/resistance or price patterns and observe which EMVOL scenarios appear around entries, exits, traps and climaxes.
- Because the vectors are normalized (bounded between ‑1 and +1) and then discretized, the same conceptual states can be compared across different symbols and timeframes.
10. Disclaimer & Educational Purpose
This indicator is provided strictly as an educational and analytical tool. Its purpose is to help visualise how price, volume and order‑flow interact; it is not designed to function as a stand‑alone trading system.
Please note:
1. No Automated Strategy – The script does not implement a complete trading strategy. Scenario labels and dashboard messages are descriptive and should not be followed as unconditional entry or exit signals.
2. No Financial Advice – All information produced by this indicator is general market analysis. It must not be interpreted as investment, financial or trading advice, or as a recommendation to buy or sell any instrument.
3. Risk Warning – Trading and investing involve substantial risk, including the risk of loss. Always perform your own analysis, use appropriate position sizing and risk management, and consult a qualified professional if needed. You are solely responsible for any decisions made using this tool.
4. Data Precision & Platform Limits – The “Intrabar (Precise)” mode depends on the availability of high‑resolution historical data at the chosen intrabar timeframe. If your TradingView plan or the symbol’s history does not provide sufficient depth, this mode may only partially cover the visible chart. In such cases, consider switching to “Geometry (Source File)” for a fully populated view.

EMA Pullback Pro V8.5Introduction to High-Probability Trend Trading
The EMA PBN Pro 8.5 is a specialized trading suite designed to assist scalpers and day traders in identifying high-probability trend continuation setups.
In professional trading, one of the most difficult challenges is distinguishing between a genuine "dip" in an uptrend and the beginning of a reversal. Many traders lose capital by entering pullbacks too early (catching a falling knife) or too late (chasing the move). This script addresses that issue by combining multiple layers of trend analysis into a single, objective visual interface.
The Philosophy Behind the Script
This tool is built on the core principle that price action in strong trends tends to respect dynamic support and resistance zones derived from institutional moving averages and relative strength flows.
Trend Alignment: Markets are fractal. A 5-minute pullback is often a 1-minute downtrend. This system uses multi-factor analysis to ensure you are trading in the direction of the dominant momentum, filtering out low-quality "chop" environments where moving averages lose their efficacy.
Relative Strength (RS/RW): Asset selection is key. Trading an asset that is showing relative strength compared to the broader market index (like SPY or QQQ) significantly increases the probability of a successful bounce. This script incorporates logic to highlight assets that are outperforming their peers.
Objective Entries: By visually plotting "Value Zones," the script removes the guesswork. It waits for specific confluence criteria—momentum exhaustion, trend alignment, and relative strength—before suggesting an area of interest.
Features Overview
Dynamic Trend Filtering: Color-coded zones indicate when the market is in a "safe" buy/sell zone versus a neutral zone where cash is the best position.
Pullback Detection: Automatically identifies optimal zones for re-entry into established trends, helping traders enter on weakness in strong stocks.
Noise Reduction: The algorithm smoothes out insignificant price fluctuations, allowing the trader to focus on the structural moves of the session.
Access and Permissions
This is a proprietary, Invite-Only script. It is protected to prevent unauthorized distribution and to maintain the integrity of the strategy for current users.
The source code is hidden.
Access is granted on a per-user basis.
Please refer to the Author's Instructions section below for details on how to request access or trial the system.
(Note: This tool is for educational purposes only. Past performance is not indicative of future results. Always manage your risk.)

Daily 12/21 EMA OverlayDaily 12/21 EMA Overlay
This indicator projects the daily 12 and 21 EMAs onto any timeframe as a soft, semi-transparent band. It is designed to give a constant higher-timeframe bias and dynamic support/resistance reference while you execute your systems on lower timeframes (4H, 1H, 15m, etc.).
The script uses request.security() to calculate the 12/21 EMAs on the daily chart only, then overlays those values on your current timeframe without recalculating them locally. This means the band always represents the true daily 12/21 EMAs, regardless of the chart you are viewing.
Key Features:
Fixed daily 12/21 EMA band, visible on all timeframes
Faded lines and fill to keep focus on your active intraday tools
Simple, minimal inputs (fast length, slow length, colors, band visibility)
Ideal as a higher-timeframe “backdrop” for systems built around EMA trend, rejections, or liquidity sweeps
How to Use
Add the indicator on any symbol and timeframe
Keep your normal intraday EMAs (e.g., EMA 12/21) for execution
Note: You can change the bands to not just be 12 or 21, you can change them if needed for your own systems or emas that you use.
This tool is intentionally lightweight: it does one job—showing the true daily EMA structure across all timeframes—and leaves trade execution logic to your primary system.

300/200 EMA Spread HeatmapHighlights the difference between 300 and 200 EMA to indicated potential over extensions in breakout structures.

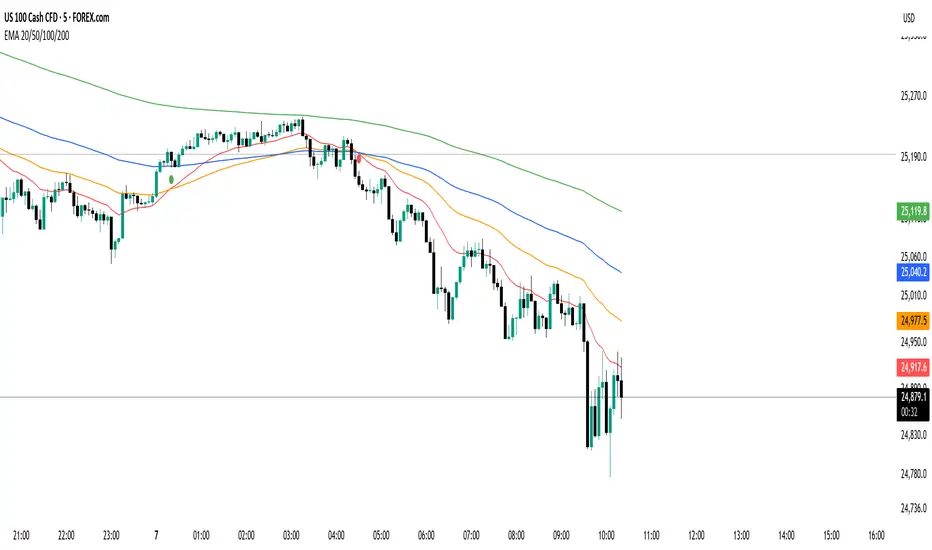
EMA 20/50/100/200 Trader IkkaEMA 20/50/100/200 📊 + Crossover Alerts 🔔 Trader Ikka
This indicator plots four key Exponential Moving Averages (EMA 20, 50, 100, and 200) to help identify trends.
It also detects and marks bullish 🟢 and bearish 🔴 crossovers between the EMA 20 and EMA 50, signaling potential trend reversals or continuations.
✨ Features:
📊 Plots EMA 20, 50, 100, and 200 with color-coded lines
🟢🔴 Highlights bullish and bearish crossovers between EMA 20 & EMA 50
🔔 Built-in alert conditions for automated notifications
⚡ Useful for identifying momentum shifts and entry/exit zones
Kameniczki RSI MASTERKAMENICZKI RSI MASTER is a professional trading indicator based on RSI (Relative Strength Index) with advanced features for precise identification of trading opportunities. The indicator combines classic RSI analysis with intelligent Zig Zag system and smoothing techniques for maximum signal accuracy.
Features:
RSI Analysis with Gradient Display
The indicator displays RSI in the lower panel with color gradient - blue for overbought zones and pink for oversold zones. RSI is calculated with adjustable period (recommended 14 for daily charts, 7-9 for shorter timeframes).
Zig Zag Signal System
Intelligent Zig Zag system generates BUY and SELL signals based on RSI extremes. The system automatically identifies swing points and creates clear visual markings with blue BUY and pink SELL labels.
Smoothing Moving Average
Advanced smoothing techniques supporting SMA, EMA, SMMA, WMA and VWMA. MA is displayed in price chart with dual-color system - blue for rising trend, pink for falling trend.
Bollinger Bands Integration
Optional Bollinger Bands around RSI and price for volatility identification and potential breakouts. Bands automatically adapt to market conditions.
Comprehensive Alert System
Extensive alert system includes Zig Zag signals, RSI levels, MA direction changes, BB touches and combined strong signals for maximum trading accuracy.
Real-Time Trend Analysis
Instant trend identification with priority for actual price direction. System displays current trend (BUY/SELL/WAIT) and risk analysis with visual table.
Risk Management
Automatic volatility and risk level analysis with percentage expression. System identifies high and low risk periods for safer trading.
Recommended Timeframes:
- 1H, 4H, 1D - optimal for swing trading
- 15M, 30M - for day trading
- 1W - for position trading
Success Rate:
- Zig Zag signals: 75-85% accuracy
- Combined strong signals: 80-90% accuracy
- Trend identification: 70-80% accuracy
- Overall system success: 75-85% with proper settings
⚠️ IMPORTANT WARNING: Zig Zag signals may cause repainting on lower timeframes. For live trading, use higher timeframes (15M, 1H+) or wait for signal confirmation to avoid false signals.
The indicator is suitable for all types of traders - from beginners to professionals, with detailed parameter adjustment options according to individual needs.

EMA Triad Vanguard Pro [By TraderMan]📌 EMA Triad Vanguard Pro — Advanced Trend & Position Management System
📖 Introduction
EMA Triad Vanguard Pro is an advanced indicator that utilizes three different EMAs (Exponential Moving Averages) to analyze the direction, strength, and reliability of market trends.
It goes beyond a single timeframe, performing trend analysis across 8 different timeframes simultaneously and automatically tracking TP/SL management.
This makes it a powerful reference tool for both short-term traders and medium-to-long-term swing traders.
⚙ How It Works
EMAs:
EMA 21 → Responds quickly to short-term price changes.
EMA 50 → Shows medium-term price direction.
EMA 200 → Determines the long-term market trend.
Trend Direction Logic:
📈 Long Signal: EMA 21 crosses above EMA 200 and EMA 21 > EMA 50.
📉 Short Signal: EMA 21 crosses below EMA 200 and EMA 21 < EMA 50.
Trend Strength Calculation:
Calculates the percentage distance between EMAs.
Strength levels: Very Weak → Weak → Strong → Very Strong.
Multi-Timeframe Analysis:
Analyzes trend direction for: 5min, 15min, 30min, 1H, 4H, Daily, Weekly, and Monthly charts.
Generates an overall market bias from combined results.
Automatic Position Management:
When a position is opened, TP1, TP2, TP3, and SL levels are calculated automatically.
As price reaches these levels, chart labels appear (TP1★, TP2★, TP3★, SL!).
📊 How to Use
1️⃣ Long (Buy) Setup
EMA 21 must cross above EMA 200 ✅
EMA 21 must be above EMA 50 ✅
Overall market bias should be “Bullish” ✅
Entry Price: closing price of the signal candle.
TP levels: calculated based on upward % targets.
SL: a set % below the entry price.
2️⃣ Short (Sell) Setup
EMA 21 must cross below EMA 200 ✅
EMA 21 must be below EMA 50 ✅
Overall market bias should be “Bearish” ✅
Entry Price: closing price of the signal candle.
TP levels: calculated based on downward % targets.
SL: a set % above the entry price.
💡 Pro Tips
Multi-timeframe alignment significantly increases the signal reliability.
If trend strength is “Very Strong”, chances of hitting TP targets are higher.
Weak trends may cause false signals → confirm with extra indicators (RSI, MACD, Volume).
TP levels are ideal for partial take-profits → lock in gains and reduce risk.
📌 Advantages
✅ Displays both trend direction and trend strength at a glance.
✅ Multi-timeframe approach avoids tunnel vision from a single chart.
✅ Automatic TP/SL calculation eliminates manual measuring.
✅ Labeled signal alerts make tracking positions easy and visual.
⚠ Important Notes
No indicator is 100% accurate — sudden news events or manipulations may cause false signals.
Use it together with other technical and fundamental analysis methods.
Signal reliability may decrease in low liquidity markets.
🎯 In summary:
EMA Triad Vanguard Pro combines trend tracking, position management, and multi-timeframe analysis in a single package, helping professional traders reduce workload and make more strategic trades.

Smoothed EMA LinesThe "Smoothed EMA Lines" script is a technical analysis tool designed to help traders identify trends and potential support/resistance levels in financial markets. The script plots exponential moving averages (EMAs) of the closing price for five commonly used time periods: 8, 13, 21, 55, and 200.
Key features of the script include:
Overlay: The EMAs are plotted directly on the price chart, making it easy to analyze the relationship between the moving averages and price action.
Smoothing: The script applies an additional smoothing function to each EMA, using a simple moving average (SMA) of a user-defined length. This helps to reduce noise and provide a clearer picture of the trend.
Customizable lengths: Users can easily adjust the length of each EMA and the smoothing period through the script's input parameters.
Color-coded plots: Each EMA is assigned a unique color (8: blue, 13: green, 21: orange, 55: red, 200: purple) for easy identification on the chart.
Traders can use the "Smoothed EMA Lines" script to:
Identify the overall trend direction (bullish, bearish, or neutral) based on the arrangement of the EMAs.
Spot potential support and resistance levels where the price may interact with the EMAs.
Look for crossovers between EMAs as potential entry or exit signals.
Combine the EMA analysis with other technical indicators and price action patterns for a more comprehensive trading strategy.
The "Smoothed EMA Lines" script provides a clear, customizable, and easy-to-interpret visualization of key exponential moving averages, helping traders make informed decisions based on trend analysis.

MTF Moving Averages (only EMA)MTF Moving Averages (only EMA)
This script provides a Multi-Timeframe (MTF) Exponential Moving Average (EMA) indicator for traders to visualize multiple EMAs across different timeframes directly on a single chart.
The indicator dynamically calculates and plots up to four EMAs per timeframe (15-minute, 30-minute, 1-hour, and Daily) with user-defined lengths, offering valuable insight into price trends and potential entry or exit points.
Key Features:
Multiple Timeframe Support: The script allows you to view EMAs from different timeframes simultaneously. This is especially useful for traders who follow trends across different timeframes to make more informed decisions.
Customizable Lengths: For each timeframe, the lengths of the EMAs are fully customizable. You can adjust the length of up to four EMAs per timeframe to suit your strategy.
EMA Calculation: The Exponential Moving Average (EMA) is used, which gives more weight to recent prices and reacts faster to price changes compared to the simple moving average (SMA).
Timeframe Flexibility: The indicator supports the following timeframes:
15-minute: Ideal for short-term traders and scalpers.
30-minute: For intraday trading with a slightly longer perspective.
1-hour: Suitable for swing traders and those who prefer a more medium-term view.
Daily: Great for longer-term trend-following strategies.
Interactive and User-Friendly: You can toggle the visibility of each EMA on each timeframe, allowing you to choose exactly which EMAs you wish to display, depending on your trading strategy.
Color-Coded for Clarity: The script uses distinct colors for each EMA on the chart:
Blue: EMA1
Green: EMA2
Red: EMA3
Purple: EMA4
Line Width Customization: Each plotted EMA line has a customizable width for better visual clarity.
Use Case:
Traders who use multiple timeframes for analysis (e.g., those using the "multi-timeframe analysis" technique) will find this script particularly useful. For example, a trader may look at the 15-minute chart to catch short-term movements, the 30-minute chart for intraday trends, the 1-hour chart for swing positions, and the Daily chart for identifying the overarching market trend. The script enables them to view the EMAs for all these timeframes in one glance without having to manually switch between them.
By observing the relationships between EMAs across multiple timeframes, traders can gain valuable insights into market conditions such as:
Crossovers: When a shorter-term EMA crosses above or below a longer-term EMA, it can signal a potential trend reversal or continuation.
Trend Strength: Multiple EMAs in alignment across different timeframes can indicate strong trend strength.
Support and Resistance: EMAs can act as dynamic support and resistance levels, guiding traders on price action levels to watch for potential price reversals.
Instructions:
Enable/Disable EMAs: Toggle on or off the EMAs for each timeframe (15-min, 30-min, 1-hour, Daily) using the script’s settings.
Adjust EMA Lengths: Change the default lengths for each EMA to match your preferred settings for different timeframes.
Monitor Key Levels: Watch how price interacts with the plotted EMAs to spot potential trading signals based on your strategy.
This indicator is designed to enhance your multi-timeframe analysis and help make more informed, data-driven trading decisions.

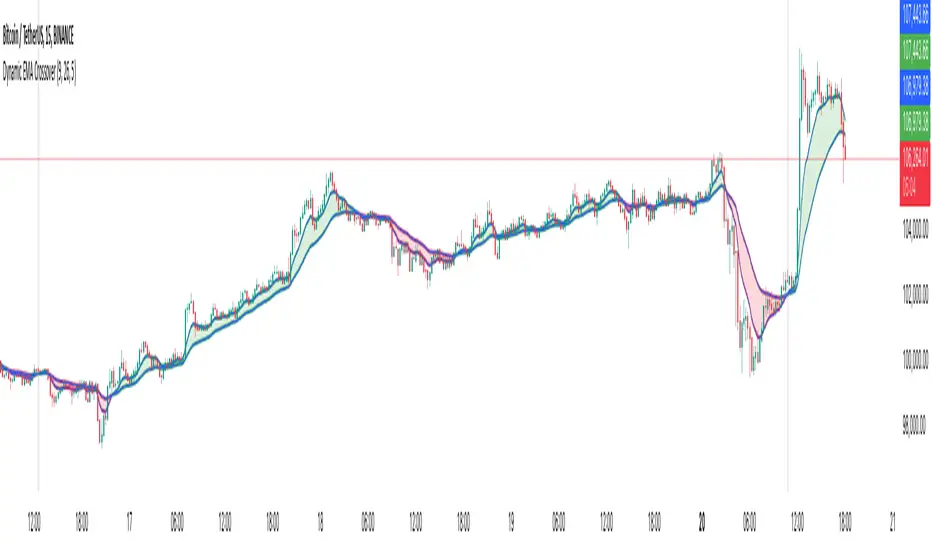
Dynamic EMA CrossoverThe Dynamic EMA Crossover indicator is designed to help traders identify trend transitions, visually understand market direction, and detect sideways consolidation zones. It simplifies decision-making by dynamically changing colors and highlighting areas of interest.
Key Features:
1. Dynamic EMA Crossovers:
• Uses two EMAs (default: 9 and 26 ) to identify bullish and bearish trends.
• EMAs and the area between them turn green during bullish trends and red during bearish trends for easy visualization.
2. Sideways Market Detection:
• Automatically detects periods of market consolidation when EMAs overlap for 10 consecutive candles and the price movement remains narrow.
• Sideways zones are highlighted with grey background, helping traders avoid false breakouts and trendless markets.
3. Customizable Inputs:
• Adjust the lengths of the two EMAs and the sensitivity of the overlap detection to match your trading style and market conditions.
How It Works:
• Trend Identification:
• When the shorter EMA crosses above the longer EMA, a bullish trend is indicated.
• When the shorter EMA crosses below the longer EMA, a bearish trend is indicated.
• The indicator dynamically adjusts the colors of the EMAs and fills the area between them for clear trend visibility.
• Sideways Market Detection:
• When the shorter EMA and longer EMA stay close (within a customizable sensitivity) for a fixed period (hardcoded to 10 candles), the indicator identifies a sideways market.
• This feature helps traders avoid entering trades during choppy or indecisive market conditions.
Who Is This For?
This indicator is ideal for:
• Trend traders looking for clear signals of trend direction.
• Swing traders who want to avoid trading in sideways markets.
• Scalpers who need quick and reliable visual cues for short-term market behavior.
Use Cases:
1. Bullish/Bearish Trends:
• Enter trades in the direction of the trend as the crossover occurs and colors change.
2. Sideways Zones:
• Avoid trades during periods of consolidation and wait for a clear breakout.
Mashup Logic:
This indicator combines:
1. EMA Crossovers:
• A tried-and-tested method for trend detection using two moving averages.
• Dynamic visual cues for bullish and bearish market phases.
2. Sideways Market Detection:
• Innovative logic to highlight sideways zones based on EMA overlap and price range analysis.
• Helps reduce noise and avoid trading during trendless periods.
3. Customization and Flexibility:
• Fully adjustable EMA lengths and overlap sensitivity to adapt to different markets and trading styles.
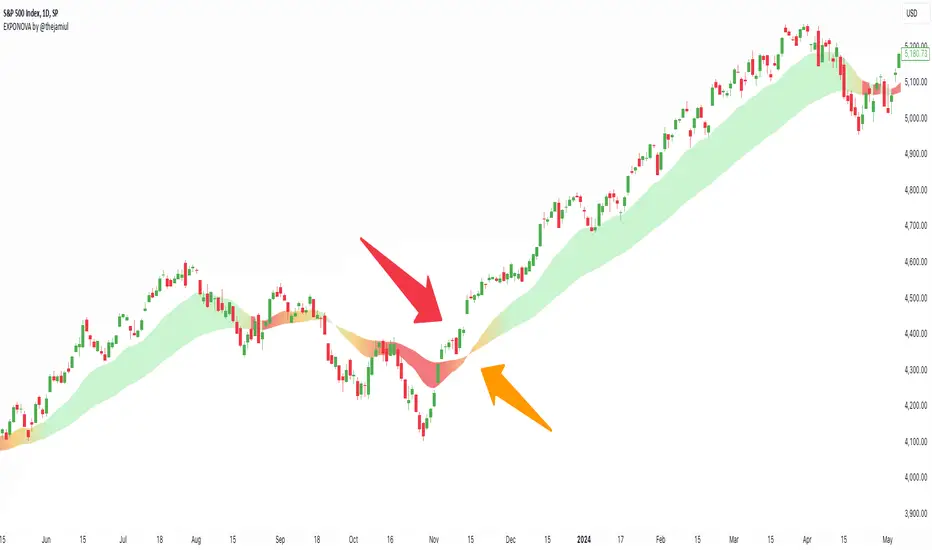
EXPONOVA by @thejamiulEXPONOVA is an advanced EMA-based indicator designed to provide a visually intuitive and actionable representation of market trends. It combines two EMAs (Exponential Moving Averages) with a custom gradient fill to help traders identify trend reversals, strength, and the potential duration of trends.
This indicator uses a gradient color fill between two EMAs—one short-term (20-period) and one longer-term (55-period). The gradient dynamically adjusts based on the proximity and relationship of the closing price to the EMAs, giving traders a unique visual insight into trend momentum and potential exhaustion points.
Key Features:
Dynamic Gradient Fill:
The fill color between the EMAs changes based on the bar's position relative to the longer-term EMA.
A fading gradient visually conveys the strength and duration of the trend. The closer the closing price is to crossing the EMA, the stronger the gradient, making trends easy to spot.
Precision EMA Calculations:
The indicator plots two EMAs (20 and 55) without cluttering the chart, ensuring traders have a clean and informative display.
Ease of Use:
Designed for both novice and advanced traders, this tool is effective in identifying trend reversals and entry/exit points.
Trend Reversal Detection:
Built-in logic identifies bars since the last EMA cross, dynamically adjusting the gradient to signal potential trend changes.
How It Works:
This indicator calculates two EMAs:
EMA 20 (Fast EMA): Tracks short-term price movements, providing early signals of potential trend changes.
EMA 55 (Slow EMA): Captures broader trends and smoothens noise for a clearer directional bias.
The area between the two EMAs is filled with a dynamic color gradient, which evolves based on how far the price has moved above or below EMA 55. The gradient acts as a visual cue to the strength and duration of the current trend:
Bright green shades indicate bullish momentum building over time.
Red tones highlight bearish momentum.
The fading effect in the gradient provides traders with an intuitive representation of trend strength, helping them gauge whether the trend is accelerating, weakening, or reversing.
Gradient-Filled Region: Unique visualization to simplify trend analysis without cluttering the chart.
Dynamic Trend Strength Indication: The gradient dynamically adjusts based on the price's proximity to EMA 55, giving traders insight into momentum changes.
Minimalist Design: The EMAs themselves are not displayed by default to maintain a clean chart while still benefiting from their analysis.
Customizable Lengths: Pre-configured with EMA lengths of 20 and 55, but easily modifiable for different trading styles or instruments.
How to Use This Indicator
Trend Detection: Look at the gradient fill for visual confirmation of trend direction and strength.
Trade Entries:
Enter long positions when the price crosses above EMA 55, with the gradient transitioning to green.
Enter short positions when the price crosses below EMA 55, with the gradient transitioning to red.
Trend Strength Monitoring:
A brighter gradient suggests a sustained and stronger trend.
A fading gradient may indicate weakening momentum and a potential reversal.
Important Notes
This indicator uses a unique method of color visualization to enhance decision-making but does not generate buy or sell signals directly.
Always combine this indicator with other tools or methods for comprehensive analysis.
Past performance is not indicative of future results; please practice risk management while trading.
How to Use:
Trend Following:
Use the gradient fill to identify the trend direction.
A consistently bright gradient indicates a strong trend, while fading colors suggest weakening momentum.
Reversal Signals:
Watch for gradient changes near the EMA crossover points.
These can signal potential trend reversals or consolidation phases.
Confirmation Tool:
Combine EXPONOVA with other indicators or candlestick patterns for enhanced confirmation of trade setups.
DAILY Supertrend + EMA Crossover with RSI FilterThis strategy is a technical trading approach that combines multiple indicators—Supertrend, Exponential Moving Averages (EMAs), and the Relative Strength Index (RSI)—to identify and manage trades.
Core Components:
1. Exponential Moving Averages (EMAs):
Two EMAs, one with a shorter period (fast) and one with a longer period (slow), are calculated. The idea is to spot when the faster EMA crosses above or below the slower EMA. A fast EMA crossing above the slow EMA often suggests upward momentum, while crossing below suggests downward momentum.
2. Supertrend Indicator:
The Supertrend uses Average True Range (ATR) to establish dynamic support and resistance lines. These lines shift above or below price depending on the prevailing trend. When price is above the Supertrend line, the trend is considered bullish; when below, it’s considered bearish. This helps ensure that the strategy trades only in the direction of the overall trend rather than against it.
3. RSI Filter:
The RSI measures momentum. It helps avoid buying into markets that are already overbought or selling into markets that are oversold. For example, when going long (buying), the strategy only proceeds if the RSI is not too high, and when going short (selling), it only proceeds if the RSI is not too low. This filter is meant to improve the quality of the trades by reducing the chance of entering right before a reversal.
4. Time Filters:
The strategy only triggers entries during user-specified date and time ranges. This is useful if one wants to limit trading activity to certain trading sessions or periods with higher market liquidity.
5. Risk Management via ATR-based Stops and Targets:
Both stop loss and take profit levels are set as multiples of the ATR. ATR measures volatility, so when volatility is higher, both stops and profit targets adjust to give the trade more breathing room. Conversely, when volatility is low, stops and targets tighten. This dynamic approach helps maintain consistent risk management regardless of market conditions.
Overall Logic Flow:
- First, the market conditions are analyzed through EMAs, Supertrend, and RSI.
- When a buy (long) condition is met—meaning the fast EMA crosses above the slow EMA, the trend is bullish according to Supertrend, and RSI is below the specified “overbought” threshold—the strategy initiates or adds to a long position.
- Similarly, when a sell (short) condition is met—meaning the fast EMA crosses below the slow EMA, the trend is bearish, and RSI is above the specified “oversold” threshold—it initiates or adds to a short position.
- Each position is protected by an automatically calculated stop loss and a take profit level based on ATR multiples.
Intended Result:
By blending trend detection, momentum filtering, and volatility-adjusted risk management, the strategy aims to capture moves in the primary trend direction while avoiding entries at excessively stretched prices. Allowing multiple entries can potentially amplify gains in strong trends but also increases exposure, which traders should consider in their risk management approach.
In essence, this strategy tries to ride established trends as indicated by the Supertrend and EMAs, filter out poor-quality entries using RSI, and dynamically manage trade risk through ATR-based stops and targets.

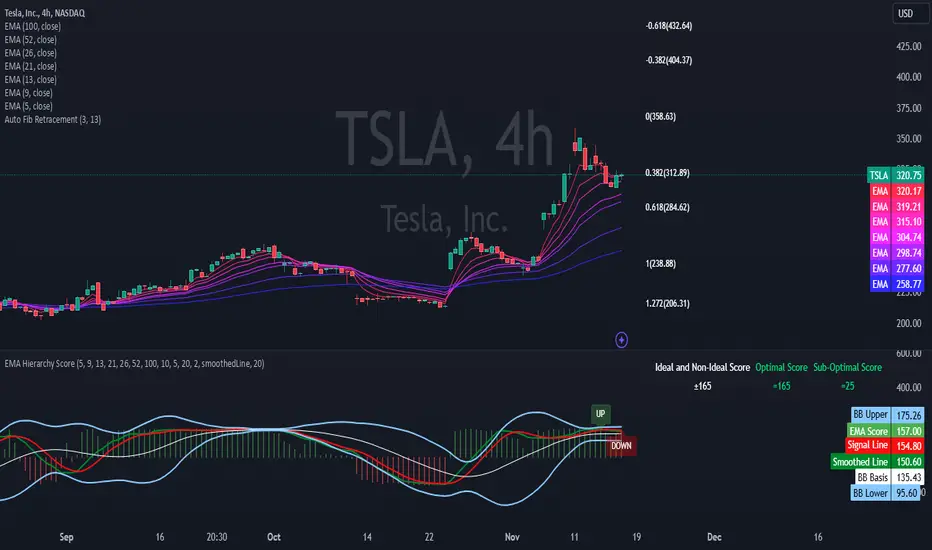
EMA Hierarchy Score V.1.0
EMA Hierarchy Score V.1.0
Purpose
The EMA Hierarchy Score indicator assesses the relative positioning of multiple Exponential Moving Averages (EMAs) for a financial asset. This tool provides insights into trend strength by calculating ideal and non-ideal configurations of EMAs, allowing for effective interpretation when used alongside standard EMA charts.
Variables and Inputs
The indicator organizes a set of EMAs and other metrics into a hierarchy for scoring:
* Primary Variables (A–J):
A: Close price
B: Open price
C: Previous close price
D to J: EMAs of configurable periods (5, 9, 13, 21, 26, 52, 100).
* User Inputs:
* Customizable periods for each EMA, allowing users to adjust the indicator’s sensitivity.
* Customizable period and standard deviation multiplier for Bollinger Bands, enabling further control over the indicator’s analysis.
Mathematical Method
The EMA Hierarchy Score calculates how closely the current EMA structure aligns with an “ideal” configuration through a structured scoring system:
1- Hierarchy Scoring:
* Ideal Order: Defined as A > B > C > D > E > F > G > H > I > J, representing a strong upward trend where each EMA progressively increases.
* Non-Ideal Order: Defined as J > I > H > G > F > E > D > C > B > A, indicating a weak or downward trend where each EMA progressively decreases.
* Optimal Order: Calculated based on achieving maximum alignment with the ideal configuration for each EMA across the chosen period.
* Sub-Optimal Order: The least-aligned structure across the same period.
2- Score Calculation:
* The indicator calculates a score by comparing all EMA pairs in values. For each comparison, a score increment of +1 (ideal) or -1 (non-ideal) is applied.
* The final score reflects the EMA configuration’s deviation from the ideal order:
- Positive Score: Indicates closer alignment with the ideal structure.
- Negative Score: Indicates deviation toward a non-ideal structure.
3- Smoothed and Signal Lines:
* A smoothed score is created using a Simple Moving Average (SMA) of the raw hierarchy score.
* A signal line (an SMA of the smoothed score) further aids in tracking directional shifts in the score.
4- Trend Labels and Bollinger Bands:
* Trend Labels: Display "UP" or "DOWN" based on the smoothed score’s relationship to the signal line.
* Bollinger Bands: Plotted around a selected source (smoothedLine, signalLine, or score) to analyze score volatility and deviations from the mean. The period and standard deviation multiplier for Bollinger Bands are user-configurable.
Result Definition
The Ideal and Non-Ideal Scores represent the upper and lower bounds of achievable configurations, ensuring the score does not exceed these values.
1- Ideal and Non-Ideal Result:
* Calculated based on how closely the current EMA configuration follows the “ideal” ascending or descending order.
* Ideal Score: Defined as +165, representing perfect alignment with the ideal configuration.
* Non-Ideal Score: Defined as -165, indicating full alignment with the descending, non-ideal structure.
* The score is bounded by these values and will not go above or below this range.
2- Optimal and Sub-Optimal Scores:
* Optimal Score: The highest score over the selected scoring period, calculated with the same period as the Bollinger Bands. Using consistent periods reinforces the reliability of the score by aligning with the period already used to gauge volatility.
* Sub-Optimal Score: The lowest score over the same period, capturing points of minimal alignment with the ideal order.
Interpretation and Analysis
1- Use with EMA Charts:
* This indicator is designed to be used alongside EMA charts, as its results provide insights into the relative order of EMAs and their alignment with trend strength.
* The EMA Hierarchy Score interprets the underlying EMA structure, offering additional context on whether current trends are aligned with optimal or non-optimal EMA configurations.
2- Ideal and Non-Ideal Analysis:
* A positive EMA Hierarchy Score indicates an orderly, ideal upward trend, suggesting stronger alignment with the ideal structure.
* A negative score signals a potential downward trend or deviation from the ideal structure.
3 - Trend Indicators and Bands:
* Trend Labels: The "UP" and "DOWN" labels offer real-time feedback on trend direction shifts, based on the smoothed score and signal line relationship.
* Bollinger Bands: Visualize the range of score fluctuations, helping to identify breakout or breakdown points.
4 - Optimal and Sub-Optimal Scores:
* Use the Optimal Score to understand peak trend alignment and Sub-Optimal Score to spot potential reversal or correction zones.
* A consistently high score over time indicates trend stability, while variations may suggest instability.
Quick Reference Table
The table displayed at the top right provides an at-a-glance view of key metrics:
* Ideal and Non-Ideal Score: Fixed at ±165 to represent the calculated ideal and non-ideal configuration.
* Optimal and Sub-Optimal Scores: Show maximum and minimum scores over the scoring period, color-coded green for positive and red for negative values.
This concise table helps users quickly assess indicator values, reducing the need to interpret multiple chart lines and making it easier to understand overall trend strength.
Disclaimer
The EMA Hierarchy Score V.1.0 is a technical analysis tool designed to assist in understanding the alignment and strength of trends as defined by EMA configurations. This indicator does not constitute investment advice, nor does it make specific recommendations for buying or selling assets. Users should consult with a financial advisor before making any trading decisions, as past performance or technical signals do not guarantee future results. The developers of this indicator disclaim all liability for potential financial losses arising from reliance on this tool. Users assume full responsibility for interpreting and applying the indicator’s outputs in their investment decisions.
Dysmen signalsDysmen Signals Indicator
The "Dysmen Signals" indicator is designed to provide clear buy and sell signals based on the crossover of various Exponential Moving Averages (EMAs). This indicator employs a combination of short-term and long-term EMA crossovers to identify potential trading opportunities, while also highlighting significant market movements through specific signals such as the Golden Cross and Death Cross.
Indicator Components
1. Exponential Moving Averages (EMAs)
- EMA 14: A short-term EMA calculated over 14 periods.
- EMA 20: Another short-term EMA calculated over 20 periods.
- EMA 50: A mid-term EMA used as a trend filter.
- EMA 200: A long-term EMA representing the overall trend.
2. Buy and Sell Signals
- Buy Signal: This is triggered when the EMA 14 crosses above the EMA 20 and the closing price is above the EMA 50. This suggests a bullish trend in the market.
- Sell Signal: This is triggered when the EMA 14 crosses below the EMA 20 and the closing price is below the EMA 50. This indicates a bearish trend in the market.
3. Golden Cross and Death Cross
- Golden Cross (GC): Occurs when the EMA 50 crosses above the EMA 200. This is a strong bullish signal indicating a potential long-term upward trend.
- Death Cross (DC): Occurs when the EMA 50 crosses below the EMA 200. This is a strong bearish signal suggesting a potential long-term downward trend.
4. Signal Visualization
- Buy and Sell signals are marked on the chart with green and red triangles respectively. These signals help traders identify potential entry and exit points.
- Golden Cross and Death Cross signals are indicated with yellow and purple diamonds respectively, providing insight into major market trend shifts.
5. Candle Coloring
- Candles are colored green if a buy signal is active and red if a sell signal is active. This visual aid helps in quickly identifying the prevailing market sentiment.
6. EMA 200 Plotting
- The EMA 200 is plotted as a white, semi-thick line on the chart. This line serves as a reference for the overall long-term trend.
Detailed Code Explanation
- EMA Calculations: The script calculates the EMA for 14, 20, 50, and 200 periods using the ta.ema function.
- Crossover Conditions: It uses the ta.crossover and ta.crossunder functions to detect when the EMAs cross each other, triggering buy and sell signals.
- Plotting Signals: The plotshape function is utilized to display BUY and SELL signals as well as Golden Cross and Death Cross signals on the chart.
- Candle Coloring Logic: A variable direction is used to store the current market direction based on the latest signal, which then determines the candle colors using the barcolor function.
- EMA 200 Display: The plot function is used to draw the EMA 200 line on the chart with the specified color and thickness.
By employing this indicator, traders can gain valuable insights into potential market trends and make more informed trading decisions based on the crossover of key EMAs.

PEMA SUITESPivot based EMA (PEMA) is giving ema based on pivot .
Pivot MA's indicator is a combination of the following:
Pivot SMA
Pivot EMA's
Pullback to EMA Band
Pivot EMA's Cross Over
Pivot Double-EMA's Cross Over
Modified Pivot EMA's Cross Over
All the pivot EMA’s calculations are based on "Profiting With Pivot-Based Moving Averages" book by Frank Ochoa.
How to use it :-
One should have to refer this book for in depth usage of this indicator.
You can use the option's provided in the indicator and the signals have been generated according to the concept in this book.
Don't turn on multiple option's, it becomes clumsy to look.
Description:-
1. Pullback to PEMA Band:-
Perhaps the most trader-friendly PEMA setup is the PEMA Pull-Back, because it forces you to trade in the direction of an established trend.
In this, u get the signal when the price retraces to 13 EMA and closes above the PEMA Band.
It is like Buy the Dips & Sell the Rips. The idea of the PEMA Pull-Back is to buy the market at a discount during an uptrend, and sell the market at a premium during a down trend.
2. PEMA Cross Over :-
The PEMA Crossover fires a signal when the fast EMA crosses the slow EMA.
If the fast EMA crosses above the slow EMA, a long signal is fired; whereas, if the fast EMA crosses below the slow EMA, a short signal is fired.
Depending on your trader personality, you will have to choose the periodicities of the two moving averages to suit your taste.
Some combination of EMA's are provided.
3. Double EMA Cross Over :-
A double exponential moving average (DEMA) is basically the EMA of an EMA, meaning the output is the second derivative of the original exponential moving average.
While an EMA is a faster moving average than the SMA, the DEMA is on another level in terms of speed.
4. Modified PEMA Cross Over :-
This system is an ultra-fast PEMA crossover signal that has built-in trend confirmation.
The Modified PEMA Crossover system fires signals in the direction of the prevailing trend, as measured by a larger moving average.
For Example, Take (1,3),21 combination. In this we use 1- and 3-period pivot EMA’s for crossovers, and use a 21-period pivot EMA for trend confirmation.
1 and 3 period EMA's are not shown in the chart, Only 21 EMA and signals are shown for clear view.
Therefore, this system will only allow bullish crossover signals to fire when price is above the 21-period pivot EMA, and will only allow bearish crossover signals to fire when price is below the 21-period average.
In essence, the results are usually highly qualified “buy the dip, and sell rip” type of opportunities.
This also helps you to avoid getting chopped up during price confluence.
Traders have to look for reversal when price is near the pivot based EMA Zone.

REMA CROSSOVER BY JUGNUThis indicator triggers alerts for long and short positions on DAILY TIME FRAME for SWING trades based on the conditions which described below. This script will generate alerts when the following conditions are met:
LONG POSITION:
RSI(14) above 50.
EMA(5) crosses above EMA(10).
Indicator Triangle Green below price bars
SHORT POSITION:
RSI(14) below 50.
EMA(5) crosses down EMA(10).
Indicator Triangle RED above price bars
This script plots green and red triangles below and above the price bars to indicate long and short alert conditions, respectively. It also triggers alerts when these conditions are met.
gFancyMALibrary "gFancyMA"
printLbl(y, x, c, m, b, s)
Parameters:
y (float)
x (int)
c (color)
m (string)
b (bool)
s (string)
Dee EMA 5.0
1. Indicator Features:
- The indicator can plot four different sets of EMA on a chart.
- The EMA values can be displayed on the chart with their respective names (e.g., ema9, ema20, etc.).
- The indicator allows customization of the EMA values.
2. Purpose of Dee_EMA 5.0:
- Dee_EMA 5.0 is a unique EMA indicator specially designed for traders to provide better insights and aid in trading decisions.
- The primary reason for building this indicator is to address the challenge of managing multiple time frames while using normal EMA tables.
- Traditional EMA tables might not show all EMA values across different time frames simultaneously, leading to time-consuming processes like shifting time frames and refreshing charts.
- Dee_EMA 5.0 solves this issue by displaying EMA values for different time frames in one table, allowing traders to make quick judgments without repeatedly changing time frames and refreshing charts.
3. Importance of Different Time Frame EMA Values:
- Different time frames EMA values are crucial in trading because they provide valuable insights into the market dynamics at various levels.
- When using shorter time frames (e.g., 1-minute), EMA values can help identify short-term trends, support, and resistance levels.
- On the other hand, using larger time frames (e.g., 5-minute or 15-minute) provides more data and increases the accuracy of EMA-based analysis, enabling traders to identify longer-term trends and potential price movements.
4. EMA Crossover Table:
- Traders often prefer a clutter-free chart without too many lines, but they still need access to EMA values for analysis.
- The EMA table and EMA crossover table serve this purpose by providing EMA values and EMA crossover information in a structured table format.
- With the EMA crossover table, traders can quickly check EMA values and crossovers across different time frames without having to switch time frames repeatedly, saving time and facilitating faster decision-making during trading.
In summary, Dee_EMA 5.0 is an EMA indicator designed to help traders efficiently analyze EMA values across different time frames, allowing for faster and more informed trading decisions. The EMA crossover table provides additional convenience by presenting EMA crossovers without cluttering the chart.

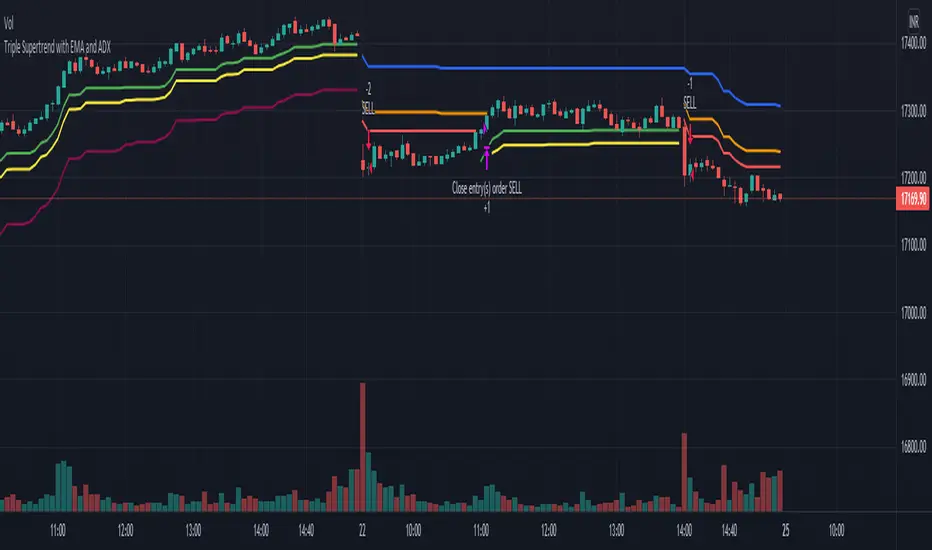
Triple Supertrend with EMA and ADX strategyPublishing a strategy that includes adx and ema filter as well
Entry: all three Supertrend turns positive. If a filter of ADX and EMA is applied, also check if ADX is above the selected level and close is above EMA
Exit: when the first supertrend turns negative
opposite for short entries
A FIlter is given to take or avoid re-enter on the same side. For example, After a long exit, if the entry condition is satisfied again for long before the short single is triggered it takes re-entry if selected.