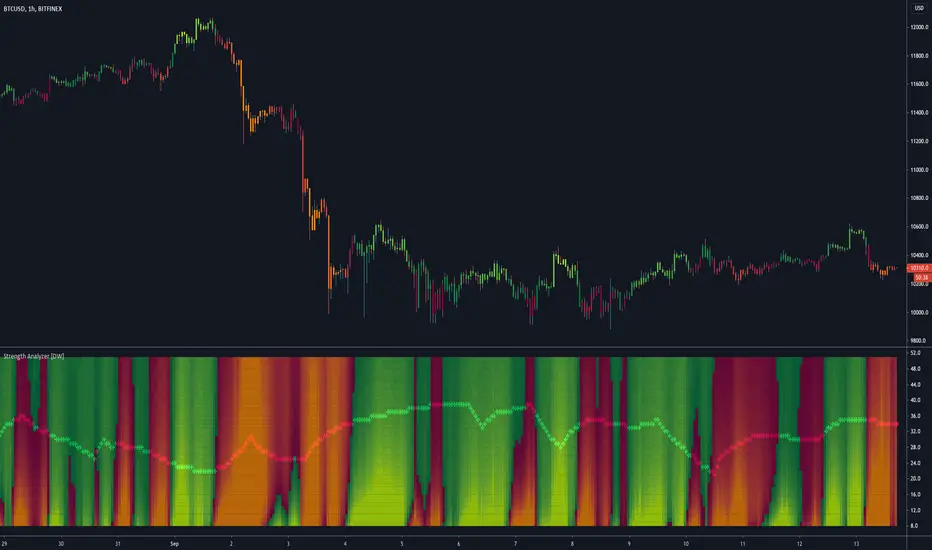
Strength Analyzer [DW]This is an experimental hybrid between relative strength and spectrum analysis methods aimed to deliver useful insights about cyclical dominance and momentum.
This study utilizes a modified RSI formula and a modified Goertzel algorithm to determine relative strength and spectral dominance for periods 8 through 50.
These periods are theorized by many analysts to be the main cyclical components of market movement.
In this study, you are given the option to apply equalization (EQ) to the dataset before estimating strength.
This enables you to transform your data and observe how strength estimates changes as well.
Whether you want to give emphasis to some frequencies, isolate specific bands, or completely alter the shape of your waveform, EQ filtration makes for an interesting experience.
The default EQ preset in this script cuts low end presence, dampens high frequency oscillations, and cleanly passes main cyclic components.
There are many ways to use EQ to transform your dataset, so play around with the settings and find the presets that work best for your analysis setup.
After EQ processing, the data is then passed through the modified RSI algorithm to generate momentum information
The modified RSI in this script is rescaled to oscillate between -1 and 1, and has the option to pass through a 2 pole Butterworth low pass filter before and after processing for a smoother output.
The strength thresholds are determined by the threshold value, which quantifies distance above and below 0.
The threshold value can also be thought of as conventional RSI distance from 50 rescaled so that an increment of 0.1 is equivalent to an increment of 5 on a conventional RSI.
A threshold value of 0.4 is equivalent to thresholds of 70 and 30 on a conventional RSI, so this is the default. The maximum threshold value is 1, which is equivalent to thresholds of 100 and 0.
This script plots colored sections for each period value using a gradient color scheme based on their respective strength estimates.
The color scheme in this script is a multicolored gradient that shows green scaled colors for bullish strength and red scaled colors for bearish strength.
Darker, less vibrant colors indicate lower strength. Brighter, more vibrant colors indicate higher strength.
Strength values near 0 will show the darkest colors, and values near the positive or negative threshold value will show the brightest.
The data is fed parallel through the modified Goertzel algorithm to obtain cyclic power information and to estimate the dominant cycle.
Gerald Goertzel's algorithm is a unique Fourier related transform that identifies tonal properties by quantifying resonance in a set of second order IIR filters with direct-form structure.
It is computationally more efficient than typical DFT or FFT algorithms, and yields decent spectral resolution.
In this variation of the algorithm, data is first passed through a 2 pole high pass filter to attenuate spectral dilation, then passed through a Hamming Window to tidy up the frequency range.
The clean windowed data is then passed through a recursive resonance loop over the frequency block to calculate filter coefficients, which are then used to identify real and imaginary magnitude components.
From there, the magnitude components are used to calculate cyclic power.
The power outputs of each period are then compared for dominant cycle estimation, which is plotted over the gradient.
The dominant cycle can also be optionally smoothed or halved based on your preferences.
Bar colors are included in this script. The color scheme is a gradient based on dominant cycle momentum.
Signals and alert conditions are included in this script as well, and can be customized to your liking.
The two main signal types in this script are:
-> Dominant Cycle - Signals based on dominant cycle or half dominant cycle changes from positive to negative strength or vice versa.
-> Confluence - Signals based on confluence emergence. Based on the majority of measured cycles or all measured cycles showing positive or negative strength.
The signals in this are also externally accessible by other scripts.
The output format is 1 for long signals, and -1 for short signals.
To integrate these signals with your own system, use a source input in your script and assign it to this script's "Direction Signals" output variable from the dropdown tab.
In addition, I included two external output variables that show dominant cycle strength and average cycle strength.
They can be integrated into your own scripts by using a source input and selecting the proper output variable, just like the signals.
The Strength Analyzer is a versatile and powerful analytical tool to have in the arsenal for generating unique insights about momentum and cycle dominance.
By analyzing strength on a spectral basis, we can look at relative price movements on a deeper level and gain insights that aren't necessarily obvious from simply looking at a price chart.
------------------------------------------------
This is a premium script, and access is provided on an invite-only basis.
To gain access, get a copy of the script overview, or for any other inquiries, send me a direct message!
I look forward to hearing from you!
------------------------------------------------
General Disclaimer:
Trading stocks, futures, Forex, options, ETFs, cryptocurrencies or any other financial instrument has large potential rewards, but also large potential risk.
You must be aware of the risks and be willing to accept them in order to invest in stocks, futures, Forex, options, ETFs or cryptocurrencies.
Don’t trade with money you can’t afford to lose.
This is neither a solicitation nor an offer to Buy/Sell stocks, futures, Forex, options, ETFs, cryptocurrencies or any other financial instrument.
No representation is being made that any account will or is likely to achieve profits or losses of any kind.
The past performance of any trading system or methodology is not necessarily indicative of future results.
------------------------------------------------
Note:
Because TV's UI can't handle displaying style options for 43 fills with 42 colors, the color scheme of the analyzer is currently not editable.
However, no other sacrifices to functionality or quality were made in this project.
As the TV team performs updates on the platform, the ability to customize this color scheme will likely come as well.
Also, it's important to note that this script uses a heavy amount of calculations to generate this output.
At times (very infrequently), TV will throw an error message saying "Calculation Takes Too Long", likely due to a momentary lull in available server space.
If you receive this error, simply hide then unhide the indicator, and everything should function as expected.
Equalizer
Advanced Fractal Dimension Index [DW]This is an experimental study based on Benoit Mandelbrot's fractal dimension concepts.
Fractal dimension is a ratio providing a statistical measure of complexity comparing how detail in a pattern changes with the scale at which it's measured.
The concept of a fractional or fractal dimension was derived from an unconventional approach to standard geometric definitions.
We all know the standard geometric rules of dimension: D=0 is a point, D=1 is a line, D=2 is a plane, and D=3 is a volume, based on the number of axes being occupied.
However, by taking a fractal geometric approach, we can define dimension like so:
N = s^-D , where N is the number of measurement segments, s is the scale factor, and D is the dimension of the object being measured.
This approach typifies conventional knowledge of dimensions as well. Here are some basic examples:
If we divide a line segment into 4 equal line segments, then we'd get 4 = (1/4)^-D. Solving for D, we get D=1, which is what we'd expect from a line.
If we divide a square into 16 equal squares, we'd be separating each line on the square into 4 pieces, so 16 = (1/4)^-D. Solving for D, we get D=2, which is what we'd expect from a square.
If we divide a cube into 64 equal cubes, we'd be separating each line on the cube into 4 pieces, so 64 = (1/4)^-D. Solving for D, we get D=3, which is what we'd expect from a cube.
The same approach can be applied to fractal objects, although admittedly it's less intuitive.
Let's say you use a stick to measure a curve, then you divide the stick into 3 equal segments and re-measure the length.
But rather than the re-measured curve showing a length of 3 of the smaller segments, it is actually 4 segments long.
This irregularity means that detail has increased as you scaled your measurement down, so the curve is dimensionally higher than the space it resides in.
In this example: 4 = (1/3)^-D. Solving for D, we get D=1.2619.
For a true fractal, this scaling of self-similar measurements would continue infinitely.
However, unlike true fractals, most real world phenomena exhibit limited fractal properties, in which they can be scaled down to some limited quantity.
Many forms of time series data (seismic data, ECG data, financial data, etc.) have been theoretically shown to have limited fractal properties.
Consequently, we can estimate fractal dimension from this data to get an approximate measure of how rough or convoluted the data stream is.
Financial data's fractal dimension is limited to between 1 and 2, so it can be used to roughly approximate the Hurst Exponent by the relationship H = 2 - D.
When D=1.5, data statistically behaves like a random walk. D above 1.5 can be considered more rough or "mean reverting" due to the increase in complexity of the series.
D below 1.5 can be considered more prone to trending due to the decrease in complexity of the series.
In this study, you are given the option to apply equalization (EQ) to the dataset before estimating dimension.
This enables you to transform your data and observe how its complexity changes as well.
Whether you want to give emphasis to some frequencies, isolate specific bands, or completely alter the shape of your waveform, EQ filtration makes for an interesting experience.
The default EQ preset in this script removes the low shelf, then attenuates low end and high end oscillations.
The dominant cyclical components (bands 3 - 5 on default settings) are passed at 100%, keeping emphasis on 8 to 64 sample per cycle oscillations.
In addition, if you're wanting a simpler filter process, or if you want a little extra, there are options included to pre and post smooth the data with 2 pole Butterworth LPFs.
The dimension estimation in this script works by measuring changes in detail using source's maximum range over a given lookback length.
In essence, it recursively updates its length parameter based on changes in range compared to the maximum over the lookback period, then uses the data to solve for D.
The FDI algorithm works on any length greater than 1. However, I didn't notice any particularly meaningful results with lookback lengths of 15 or less.
A custom color scheme is included in this script as well for FDI fill and bar colors.
The color scheme in this script is a multicolored thermal styled gradient.
The scale of gradient values is determined by the designated high and low dimension thresholds. These thresholds determine what range of values the gradient will focus on.
Values at the high threshold are the coolest and darkest, and values at the low threshold are the warmest and brightest.
Basically, the "trendier" the data is, the brighter and warmer the color will be.
Signals and alerts are included as well for crossovers on the high and low dimension thresholds.
These signals can also be externally linked to another script.
The output format is 1 for the trigger, and 0 otherwise. Basic boolean logic.
To integrate these signals with your script, simply use a source input and select the signal output from this script that you wish to use from the dropdown menu.
Fractal dimension is a powerful tool that can give valuable insight about the complexity and persistence / anti-persistence of price movements.
When used in conjunction with other analytical methods, it can prove to be a surprisingly beneficial tool to have in the arsenal.
-----------------------------------------------------
This is a premium script, and access is granted on an invite-only basis.
To gain access, get a copy of the indicator overview, or for additional inquiries, send me a direct message.
I look forward to hearing from you!
-----------------------------------------------------
General Disclaimer:
Trading stocks, futures, Forex, options, ETFs, cryptocurrencies or any other financial instrument has large potential rewards, but also large potential risk.
You must be aware of the risks and be willing to accept them in order to invest in stocks, futures, Forex, options, ETFs or cryptocurrencies.
Don’t trade with money you can’t afford to lose.
This is neither a solicitation nor an offer to Buy/Sell stocks, futures, Forex, options, ETFs, cryptocurrencies or any other financial instrument.
No representation is being made that any account will or is likely to achieve profits or losses of any kind.
The past performance of any trading system or methodology is not necessarily indicative of future results.

Dynamic Equalizer [DW]This is an experimental study inspired by techniques primarily utilized in the visual and audio processing worlds.
This study is designed to serve as a pre or post processing filter designer that allows you to shape the frequency spectrum of your data on a more "in-depth" level.
First the data is fed through my Band-Shelf Equalizer function.
The EQ in this script works by dividing the input signal into 6 bands and 2 shelves using a series of roofing filters.
The bands are then gain adjusted recursively (in %) to match source as closely as possible at unity gain.
The recursive adjustment size can be changed using the "Gain Adjustment Increment" input, which will affect how tightly the resulting filter approximates source at unity.
The frequency range of each band is adjustable via the period inputs. In default settings, these are the ranges:
-> Low Shelf : 256+ Samples Per Cycle. This shelf is the largest trend component of the signal. Unlike the other bands and shelf, this shelf is not zero mean unless source data is.
-> Band 1 : 128 - 256 Samples Per Cycle. This band is a moderate trend and low cyclic component of the signal.
-> Band 2 : 64 - 128 Samples Per Cycle. This band is a mild trend and moderate cyclic component of the signal.
-> Band 3 : 32 - 64 Samples Per Cycle. This band is a high cyclic component of the signal.
-> Band 4 : 16 - 32 Samples Per Cycle. This band is a high cyclic component of the signal.
-> Band 5 : 8 - 16 Samples Per Cycle. This band is a moderate cyclic and mild to moderate noise component of the signal.
-> Band 6 : 4 - 8 Samples Per Cycle. This band is a high noise component of the signal.
-> High Shelf : 4- Samples Per Cycle. This shelf is primarily noise.
Each band and shelf can be manually gain adjusted via their respective inputs.
After EQ processing, each band and shelf is then optionally fed through my Peak Envelope Compressor function for dynamics control.
The compressor in this script works by reducing band power by a specified percentage when it exceeds a user defined percentage of the peak envelope.
The peak envelope measures maximum power of the band over its period range multiplied by a user defined integer.
There is an option included to apply Butterworth smoothing to the envelope as well, which will alter the shape of the compressor.
If you want an envelope that quickly responds to power peaks, use little to no smoothing. If you desire something more static, use a large smoothing period.
Attack and release are included in the algorithm to shape the sensitivity of the compressor.
Attack controls how many bars it takes from being triggered for attenuation to reach its target amount.
Release controls how many bars it takes from being un-triggered for attenuation to reach back to 0.
In addition, the compressor is equipped with parallel processing.
The "Parallel Mix" inputs control the amount of compressed vs non-compressed signal presence in the final output.
And of course, the compressor has a post-processing gain input (in %) to fine-tune the presence of the band.
For easy visual tuning, you can view each independent band's magnitude or power by selecting them in the display inputs.
This display setup can also be beneficial analytically if you wish to analyze specific frequency components of the source signal.
The default preset for this script is meant to show how versatile EQ filtering and compression can be for technical analysis.
The EQ preset detrends the data, moderately smooths the data, and emphasizes dominant cyclical ranges.
The compression preset provides fast, moderately heavy shaping to dial in dynamics and reduce transient effects.
The resulting curve is a great filter for responsively analyzing cyclical momentum.
The script is also fully equipped with outputs that can be used externally by other scripts.
You can integrate these external outputs with your own script by using a source input. Simply select the desired output from the dropdown tab on your script.
Multiband filtering and compression are concepts that are not conventionally used in the world of finance.
However, the versatile capabilities of these concepts make this a wonderful tool to have in the arsenal.
By surgically adjusting separate frequency components of a signal, you're able to design a wide variety of filters with unique responses for a vast array of applications.
Play around with the settings and see what kinds of filters you can design!
---------------------------------------------------------
This is a premium script, and access is granted on an invite-only basis.
To gain access, get a copy of the script overview, or for additional inquiries, send me a direct message.
I look forward to hearing from you!
---------------------------------------------------------
General Disclaimer:
Trading stocks, futures, Forex, options, ETFs, cryptocurrencies or any other financial instrument has large potential rewards, but also large potential risk.
You must be aware of the risks and be willing to accept them in order to invest in stocks, futures, Forex, options, ETFs or cryptocurrencies.
Don’t trade with money you can’t afford to lose.
This is neither a solicitation nor an offer to Buy/Sell stocks, futures, Forex, options, ETFs, cryptocurrencies or any other financial instrument.
No representation is being made that any account will or is likely to achieve profits or losses of any kind.
The past performance of any trading system or methodology is not necessarily indicative of future results.
---------------------------------------------------------
NOTE: Unlike standard tools of this nature in other applications, I scaled the signals in % rather than dB, mainly since it's proven so far to be more user-friendly to keep things linear on here.
In addition, no transitions to frequency domain are done in this script. This EQ is an experimental variant that processes in the time domain and relies on a network of roofing filters.
When changing cutoff periods, make sure they are organized in descending order with low shelf as the highest period, and high shelf as the lowest period.
Using non-descending lengths may result in an undesired output.
Lastly, when changing cutoff periods, parts of the spectrum may leak slightly differently between bands, so the "Gain Match Adjustment Increment" may need to be changed as well if you want it to match as closely as possible at unity.
Despite these shortcomings, this tool functions surprisingly well, especially with the default periods, and it's quickly become one of my favorites. I hope you all enjoy it!

Oscillators EqualizerAn oscillator of the oscillators. This is one of my private indicators that implements a quantitative approach: it collects readings from internal oscillators and calculates scores for the selected metric.
Features
46 well-known oscillators
6 metrics ( Bands Breakouts , Overbought/Oversold , Above/Below Middle Line , Middle Line Crossovers , Above/Below Signal Line , Signal Line Crossovers )
Oscillators customization
Implemented oscillators
Relative Strength Index (by J. Welles Wilder)
Chande Momentum Oscillator (by Tushar S. Chande)
Intraday Momentum Index (by Tushar S. Chande)
Stochastic RSI (by Tushar S. Chande and Stanley Kroll)
Aroon Oscillator (by Tushar S. Chande)
R-Squared Index (by Tushar S. Chande and Stanley Kroll)
Forecast Oscillator (by Tushar S. Chande)
Relative Momentum Index (by Roger Altman)
Moving Average Convergence/Divergence (by Gerald Appel)
Connors RSI (by Larry Connors)
Rapid RSI (by Ian Copsey)
Relative Spread Strength (by Ian Copsey)
Vortex Indicator (by Etienne Botes and Douglas Siepman)
Random Walk Index (by Michael Poulos)
True Strength Index (by William Blau)
Stochastic Momentum Index (by William Blau)
Ergodic Oscillator (by William Blau)
Smoothed Rate Of Change (by Fred G. Schutzman)
TRIX (by Jack Hutson)
Pretty Good Oscillator (by Mark Johnson)
Choppiness Index (by Bill Dreiss)
Tick Line Momentum Oscillator (by Daniel E. Downing)
Price Momentum Oscillator
Relative Volatility Index (by Donald Dorsey)
Trend Trigger Factor (by M. H. Pee)
Trend Intensity Index (by M. H. Pee)
Trend Detection Index (by M. H. Pee)
Trend Continuation Factor (by M. H. Pee)
Relative Vigor Index (by John F. Ehlers)
Fisher Transform (by John F. Ehlers)
CG Oscillator (by John F. Ehlers)
Stochastic CG Oscillator (by John F. Ehlers)
Laguerre RSI (by John F. Ehlers)
Rocket RSI (by John F. Ehlers)
Recursive Median Oscillator (by John F. Ehlers)
Super Passband Filter (by John F. Ehlers)
Roofing Filter (by John F. Ehlers)
Ehlers Stochastic (by John F. Ehlers)
Fisherized Deviation-Scaled Oscillator (by John F. Ehlers)
Bollinger Bands %B (by John Bollinger)
Williams %R (by Larry Williams)
Ultimate Oscillator (by Larry Williams)
Money Flow Index (by Gene Quong and Avrum Soudack)
Commodity Channel Index (by Donald Lambert)
Ease of Movement (by Richard W. Arms)
Chaikin Money Flow (by Marc Chaikin)
