Ether (Ethereum) CME Gaps [NeoButane]Detects gaps in trading for CME's "Ether" cash-settled futures. This will show gaps as they happen on the 24/7 charts that crypto exchanges use. It is not usable on CME's tickers themselves, as gaps in trading are not displayed.
This indicator will only display if viewing an ETH chart.
More information on the CME ETH futures here:
www.cmegroup.com
Based on:
What's different: CME's BTC and ETH markets trade the same hours, but one may hit a limit breaker while there may be a case where the other does not.
Ethereum (Mata Wang Kripto)

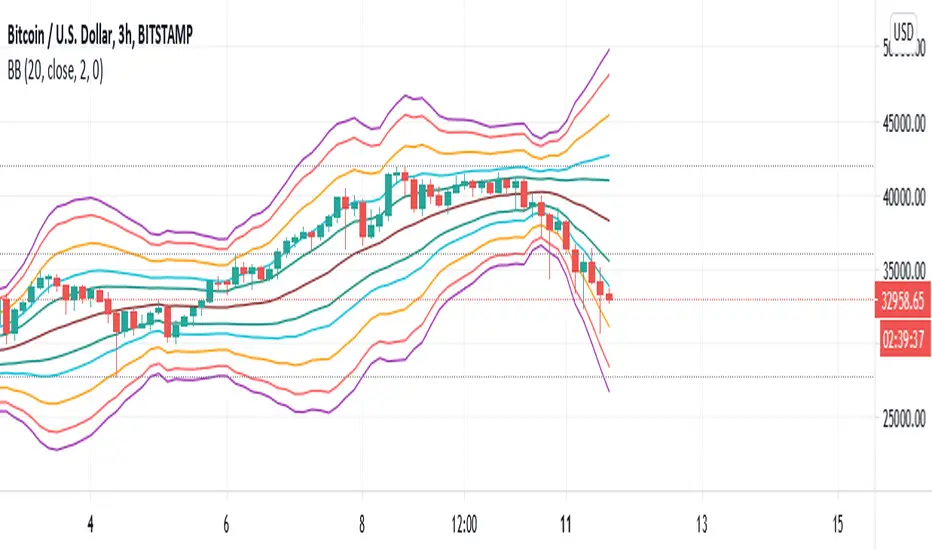
Bollinger Bands Fibonacci Ratio Standard Deviation LINESHello Traders.
in this script, Bollinger bands are made based on a standard deviation with respect to Fibonacci ratios. I hope you can be satisfied. If you are satisfied with this script, please like and feel free to share your comments with me.
Teal Upper and Lower B-Bands = 1.0 Standard Deviation
Aqua Upper and Lower B-Bands = 1.618 Standard Deviation
Orange Upper and Lower B-Bands = 2.618 Standard Deviation
Red Upper and Lower B-Bands = 3.618 Standard Deviation
Purple Upper and Lower B-Bands = 4.236 Standard Deviation
you can use this indicator by clicking the button (Add to Favorite Scripts) and then add it to your chart from (Fx) section.
BTC & ETH Alert SystemWith Tradingview's free plan, only one alert is allowed. The purpose of this indicator is to allow for two alerts--one for BTC and one for ETH.
How to use the alert system:
1. Set the desired value for BTC and ETH that you want to be alerted for
2. Set an alert on the indicator by clicking the three ellipses and then "Add Alert"
3. Set the alert to go off if the value of the indicator is greater than 0.
The example is of BTC using an alert of $10,000 and an alert of ETH at $2,000 (untriggered)
The script can be easily modified to be used for different assets

RSI + MFI - Crypto Bull and Bear market A fancy styled version of the RSI (Relative Stochastic Index) + MFI (Money Flow Index) oscillators in order to emphasize buy and sell opportunities.
The 80 and 20 Bands are meant to be used in Bull or Bear markets. Better performing in D timeframes.
The circles represent the cross between RSI and MFI .
Designed for Crypto Markets
Thanks @micheleprandina
Credits:

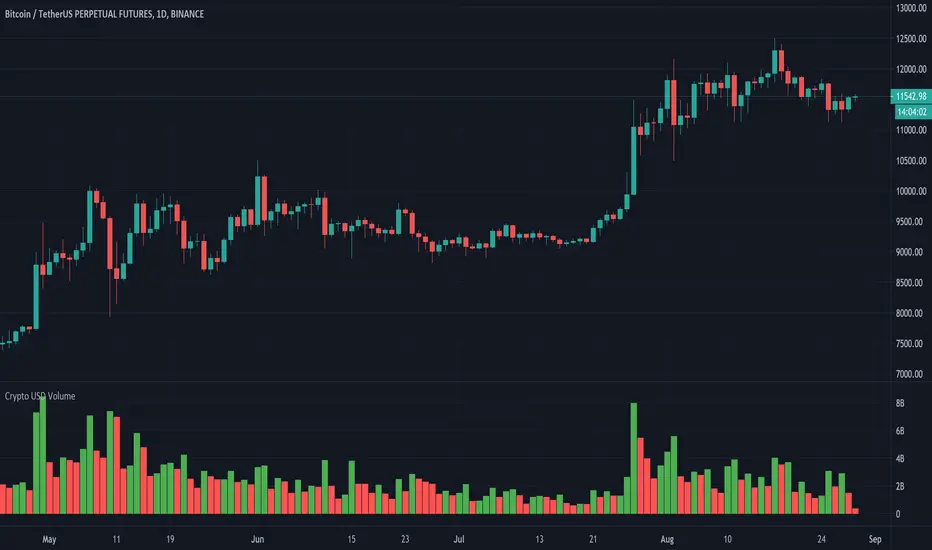
Crypto USD VolumeOften times I need to check the volume in cryptocurrency exchanges and I find myself checking which type of volume I am looking at, I need to manually make sense what the data is and converting it into USD volume which I end up going to CoinMarketCap website to verify whether my calculation is right.
Today I thought it was about time I created an automatic way to find the volume in USD Dollars. This is what this script does.
1 - It removes the base currency from the symbol (e.g., "BTCUSD", it would remove "BTC", leaving us with the "USD" part.). This is important because it helps us identify the currency the pair uses.
2 - It has different pair's variables, each is given a specific currency that the final volume is calculated from. (BTC, ETH, BNB and USD are the default currencies, for other ones, it must be added manually).
This works with all crypto symbols that include BTC, ETH, BNB and USD as currencies. If you modify it, please make sure to compare data with the exchange's one.
KINSKI RSI Short/LongExtends the display of the Relative Strength Index (RSI) by shorts and longs from Bitmex and shows them as a diagram.
How to interpret the display?
- blue line is the default Relative Strength Index
- red line means "oversold
- green line "overbought"
- grey dotted line up/down indicates the optimal range for up and down movements 30 to 70
- in general, the reaching or crossing of the thresholds in the direction of the mid-range is seen as a possible buy or sell signal
- RSI values (blue line) of over 70 percent are considered "overbought", values below 30 percent "oversold
Which settings can be made?
- Selection for the "Currency". Default value is "BTCUSD". Currently only the following currencies are supported "BTCUSD", "ETHUSD", "ETCUSD", "OMGUSD", "XLMUSD", "XTZUSD".
- Selection for calculation formula ("Calculation"). The default value is "hlc3".
- Field for the moving average value ("RSI Length"). The default value is 14, but values of 7, 9 or 25 are also common. The shorter the period under consideration, the more volatile the indicator is, but with longer periods, fewer signals are triggered.
- furthermore you can make layout adjustments via the "Style" menu

Simple EMA trend indicatorSimple EMA trend indicator , pretty straightforward green equates to bullish and usually a retest/wick is often seen , same for the flipside viceversa


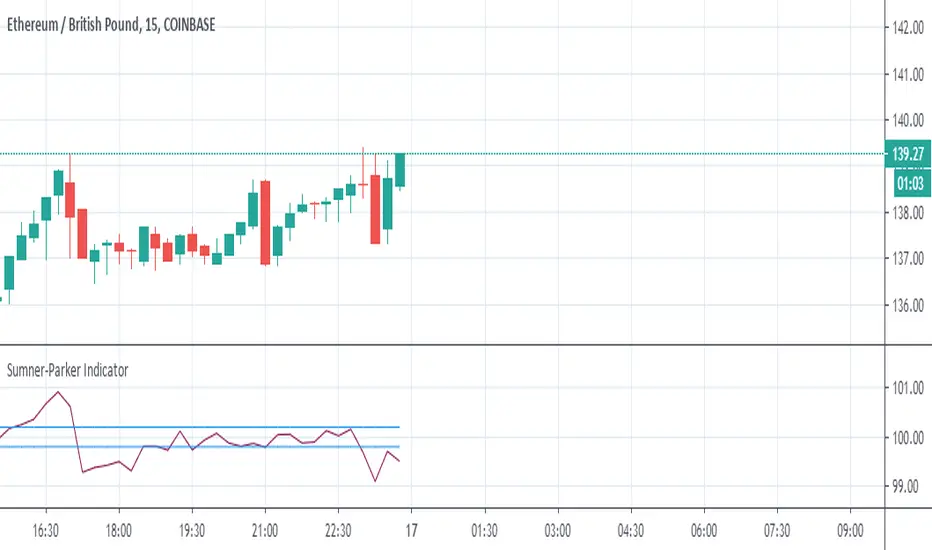
Sumner-Parker Indicator (Over/Under Priced BTC or ETH)This is to be used when trading between ETH/GBP, BTC/GBP and ETH/BTC .
It compares ETH/GBP and BTC/GBP with each other to determine if the ETH/BTC price matches.
From it you can predetermine whether the value of the asset you are watching is overpriced or underpriced and therefore predict the candle to follow.
When watching ETH:
If the value is high, the value of BTC is too high and ETH should raise to match in the next bar and vice versa.
When watching BTC:
If the value is high, the value of BTC is too high and should drop on the next bar and vice versa.
The Upper and Lowers are set at double the percentage fees on the exchange you use. This just helps in recognising beneficial trades.
Price CorrelationsThis indicator shows price correlations of your current chart to various well-known indices.
Values above 0 mean a positive correlation, below 0 a negative correlation (not correlated).
It works well with daily candle charts and above, but you may also try it on 1h candles.
The default indices:
- Gold
- S&p 500
- Mini Dow Jones
- Dow Jones
- Russel 2000
- Nasdaq 100
- Crude Oil
- Nikkei 225 (Japan)
- FTSE 100 (UK)
- Silver
- DAX Futures (DE)
You can change the defaults to compare prices with other indices or stocks.

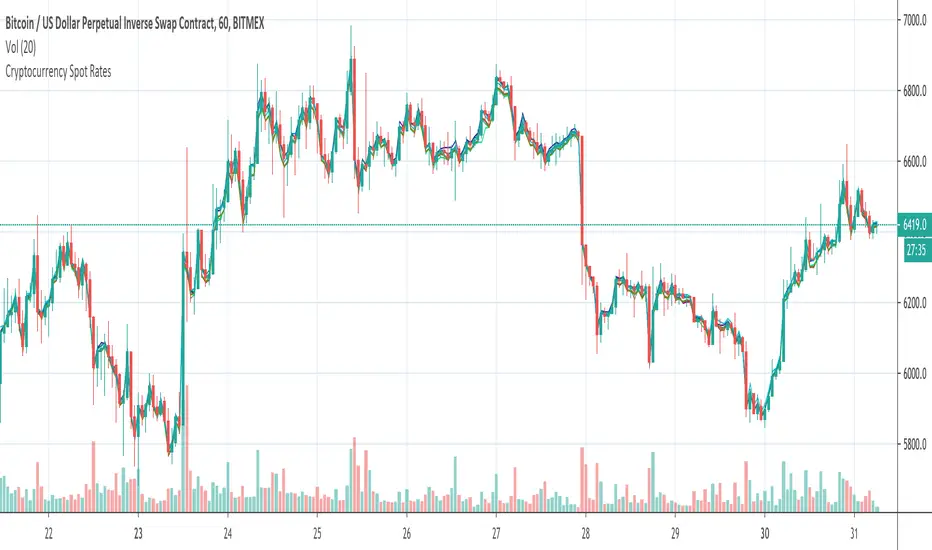
Cryptocurrency Spot RatesThis is an overlay indicator on the chart that will plot cryptocurrency spot prices of the following exchanges:
- Coinbase
- Poloniex
- OKCOIN
- Binance
- Huobi
- Bittrex
- HitBTC
- Kraken
- Bitfinex
Additionally it plots the price average of all those exchanges.
This overlay is intended to be used on charts with derivatives/futures such as BitMEX/Deribit/...
It works with all USD and Tether pairs on the main chart (for example BTCUSD, ETHUSD, BCHUSD,...)
USDT SupplyThis script shows the USDT (Tether) supply, total USDT market capitalization and USDT supply on various Cryptocurrency exchanges.
It is based on this script:
Changes:
- added HiTBTC and Huobi exchange
- updated to Pine Script v4
- improved default style and line width to highlight global USDT plots against exchange-specific plot lines

Price Streak Is Another Way to Spot TrendsPrice is never wrong, but sometimes reading it can be tricky.
Movements in the broader market or a sector can distract from a symbol that's been steadily trending in one direction or another. Sometimes the beginning of a move can also be so subtle that it flies under most people's radar.
Price Streak can help overcome these limitations by tracking consecutive up/down periods. It plots an easy-to-read color-coded histogram.
Because it simply counts the candles in a trend, Price Streak can give a clearer picture than magnitude-biased indicators like relative strength or MACD.
Applying Price Streak to the daily chart of Bitcoin Dominance , we find something very interesting right now: the longest drop since March 2017.
That moment in history, almost three years ago, marked the beginning of the last Altcoin bull market. Ethereum , for example, went from roughly $60 to over $1,300 in the following nine months.
While past performance isn't a guarantee of future results, this illustrates how sustained price moves can reveal changes in character.
Based on Price Streak's current reading, it may support the idea of another Altcoin cycle beginning now.

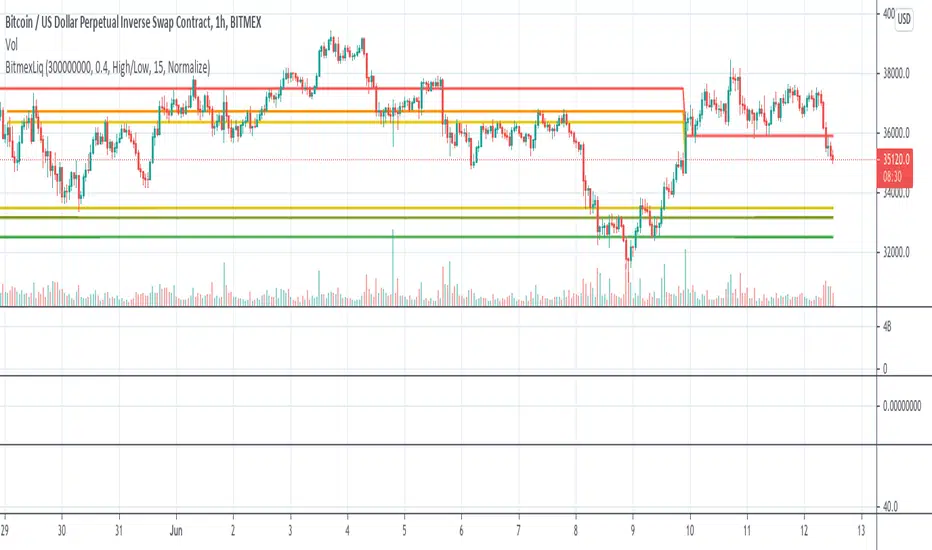
BitMEX Liquidation LevelsThis indicator plots BitMEX liquidation levels:
- 25x
- 50x
- 100x
The indicator works as following:
The underlying assumption (as with all liquidation calculations) obviously is that traders used fixed margin or go "all in" on their cross-margin account.
You then can configure a minimum trade volume and a minimum price change in percent for a candle to start computing liquidation levels from that candle
Additionally: configure the price base for the liqudation level: Candle high or low (default) works well, but you can also set "candle close" or "median high/low"
The indicator will then plot horizontal lines on the main chart showing price levels where many positions opened at the configured "start candle" will likely get liquidated.
It works for all BitMEX contracts and while it has been optimized for BitMEX, it will work on other exchanges with the same leverage levels (25x, 50x, 100x) and maintenance margin requirements too.
This indicator uses the Smart Volume indicator to compute the volume at the "start volume candle" setting where the liquidation level starts. This indicator can be found here: Smart Volume:
Market BuySell RatioA script using 1m small candle size (configurable) to compute the volume of buy (up) vs sell (down) candles (instead of actual market buy vs sell orders which are not available in pine script).
It then plots the buy vs sell ratio as an oscillator below the cart.
This gives traders an idea of current order flow in the market.
To compute the small candles this script uses the "Smart Volume" script which can be found here:

Keltner Channel Alerts [QuantNomad]This is a script with alerts for standard Keltner Channer Strategy you can find in TradingView.
Use "Once Per Bar" option when creating alerts.

Heiken Ashi Triangles at the Top and Bottom of ScreenHeiken Ashi Triangles at the Top and Bottom of Screen
The image below shows the comparison to actual Heiken Ashi candles
(Though changing from candles to Heiken Ashi tends to smooth the triangles a little)

Directional Movement Index + Average Directional IndexPersonal DMI and ADX script
ADX color change from positive vs negative momentum
DMI Color fill based on DMI+/- positive momentum
No fill color during lack of momentum

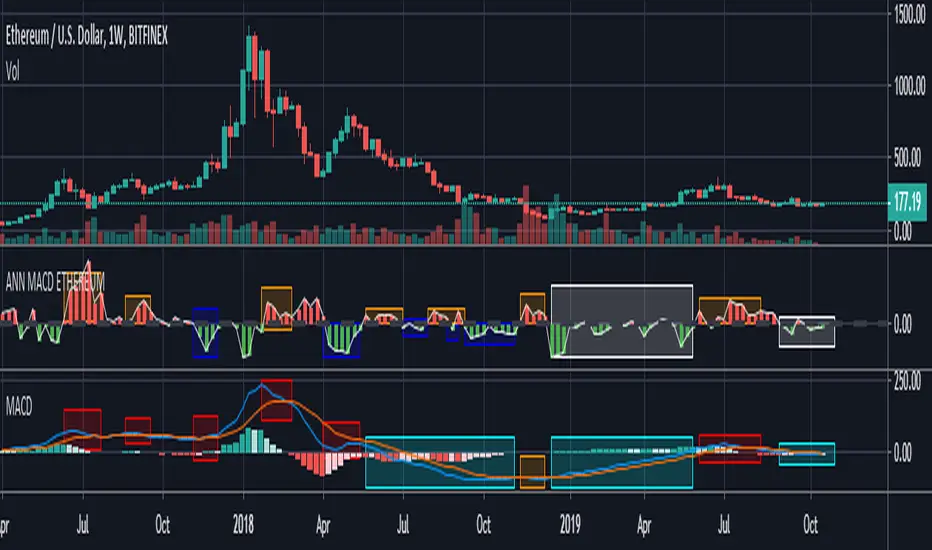
ANN MACD ETHEREUM
This script is trained with Ethereum (Timeframe : 4 hours ).
Details :
Input columns: 19
Output columns: 1
Excluded columns: 0
Training example rows: 300
Validating example rows: 0
Querying example rows: 0
Excluded example rows: 0
Duplicated example rows: 0
Input nodes connected: 19
Hidden layer 1 nodes: 8
Hidden layer 2 nodes: 1
Hidden layer 3 nodes: 0
Output nodes: 1
Learning rate: 0.7000
Momentum: 0.8000
Training error: 0.009378 ( That's a very good error coefficient. )
Many thanks to wroclai for help.
Deep learning series will continue!
Pivot Point Reversal + RSI AlertsThese are alerts for previously published strategy:
This strategy joins the Pivot Reversal strategy with the RSI indicator.
We check RSI level at the pivot point level and only if RSI condition is satisfied we update levels for stop orders.

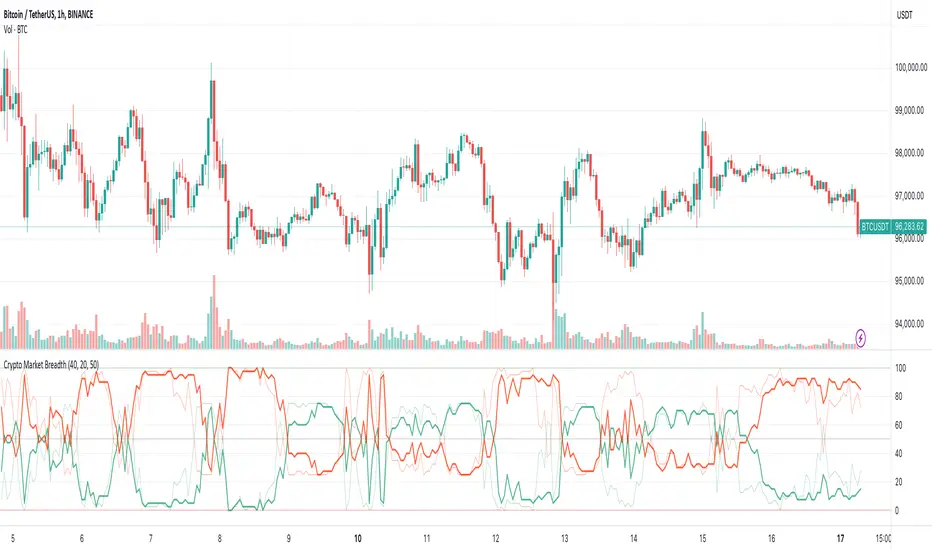
Crypto Market BreadthThis is the "Crypto Market Breadth" indicator from
I updated it to latest symbol so that it resolves again:
removed: BINANCE:NPXSUSD
added: BITFINEX:LEOUSD
Also helpful for automatic trading with WolfBot.org and TradingView Integration
Welles Wilder MAHow to trade:
Recommended for longer timeframes at least 4H.
Buy when the green dot appears.
Sell when the yellow dot appears.
Welles Wilder moving average by XOOOOOO

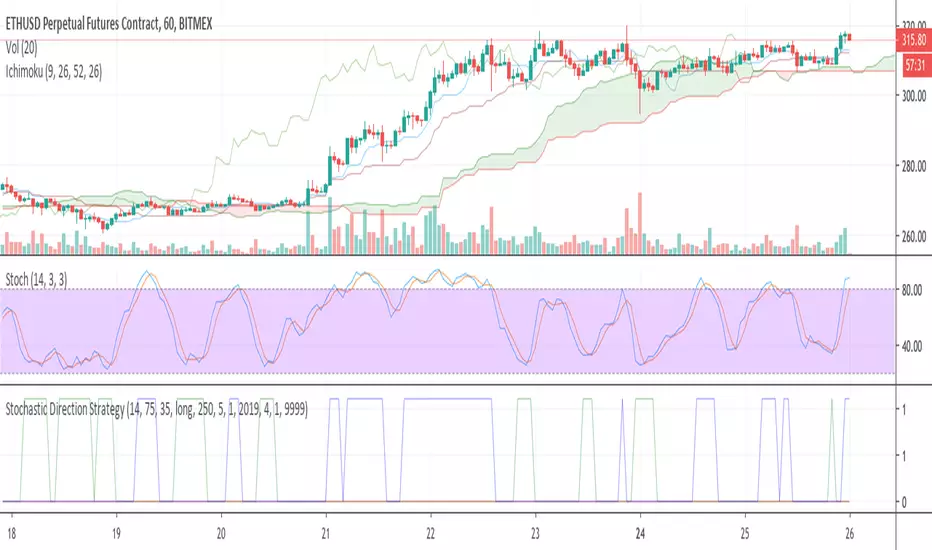
Stochastic Direction StrategyThis is a simple strategy based on the Stochastic Oscillator: stockcharts com/school/doku.php?id=chart_school:technical_indicators:stochastic_oscillator_fast_slow_and_full
Its purpose is to gradually build a position in a trending market (as of June 26th 2016 in most cryptocurrencies).
Inputs:
- direction (long/short)
- overbought/oversold
- close positions (yes/no to only increase positions)
Outputs:
- buy/sell/close signals plotted on a chart below
This script can easily be used as a TradingView study (for alerts) and a strategy (for backtesting). See the comments in the code.
I have added additional alert conditions to be used easily together with a trading bot reading the signals
Yet obviously you can also do manual trading on each alert.