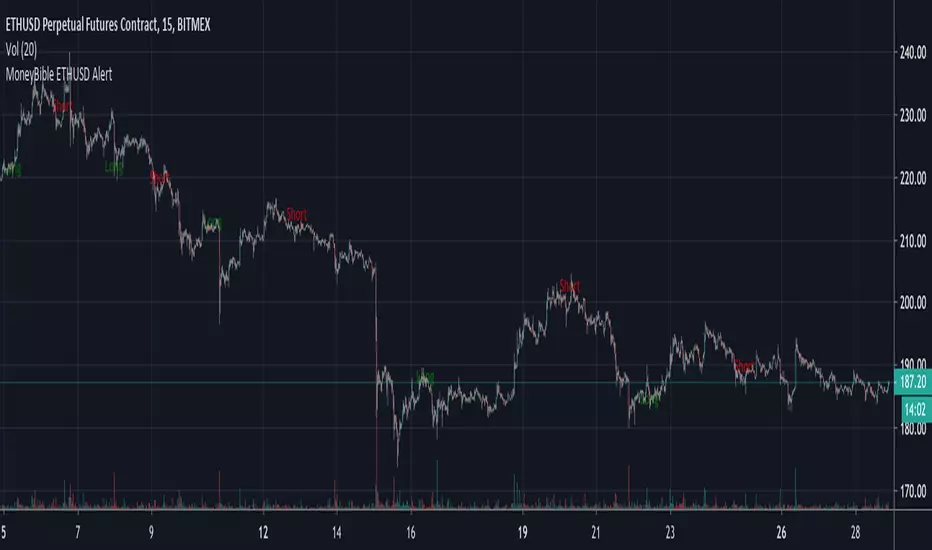
MoneyBible ETHUSD AlertMoneybible BITMEX:ETHUSD alert on 15m candlestick . It will be re-optimized monthly.
The script is written in PineScript V.3, makes no use of the security() function and does not use the Trailing Stop-Loss function from TradingView. No repainting issue.
Backtester here :
ETHUSD
OBV StochasticsThis indicator uses both a standard Stochastic Oscillator based on security prices and stochastically oscillated OBV values.
Explanation:
Stochastics measure momentum by comparing the current closing price to its lowest and highest price over a user-defined window of n periods. Without going too in depth, traders can view the K value as the current value for the stochastic indicator and the D value as a Simple Moving Average of K values. Users can adjust the length of that Simple Moving Average through modifying the smooth D parameter in the input option menu.
Traders can also define the upper and lower bounds for both sets of K and D values. These are plotted on the graph as the horizontal red (upper) line and horizontal green (lower) line. Generally, the upper line is viewed as the threshold at which a security can be considered overBought. Conversely, the lower green line is the threshold at which they can be viewed as overSold.
OBV, or On-Balance Volume, is a versatile momentum indicator that we discussed in our OBV Z-Scores open-source script. That is a good place to look if you're looking to gain a better understanding of the OBV indicator. By applying the stochastic formula to the OBV, it allows us to gain a better understanding of the current OBV value relative to its historical data and display the OBV in a {0.100} bounded range of values.
Plotting the standard price-based Stoch. K and D in combination with the Stoch. OBV K and D can help identify divergences and track the progression and direction of trends. For example, you can see that when the two move in opposite directions or when one significantly outpaces the other, it often hints towards an impending reversal.
The Graph:
As mentioned the upper and lower overbought and oversold thresholds can be adjusted by the trader and are plotted on the graph in red and green.
The green oscillating line represents the Stoch. K of OBV values, while the red line symbolizes the OBV D values.
The teal line is the standard Stoch. K and the orange line is the standard Stoch. D.
Users have two options for background highlights. The first option is to use green highlights to show entry signals and red highlights to show exit signals. These signals are based on the criteria we have set for identifying optimal entry and exit points. This is shown in the second pane.
The second option is to plot red highlights whenever Stoch. OBV K crosses the upper bound and green highlights whenever it crosses the lower bound. This is shown in the bottom pane. NOTE: Choosing this option means that signals will not be displayed in sequential entry-exit order (instead this is a good option if traders only want to identify when the security is overbought or oversold).
Input Options:
Traders can adjust the respective smooth K and smooth D values for both the standard stoch. and OBV stoch. Additionally, the lookback window length can be adjusted as well as the upper and lower bounds(in addition to the display options shown above).
Alerts:
Indicator sends alerts when entry and exit conditions are met, as well as alerts to inform traders when overbought/oversold conditions are met. Alerts can be tailored for GunBot / other automated trading platforms upon request.
~Happy Trading~

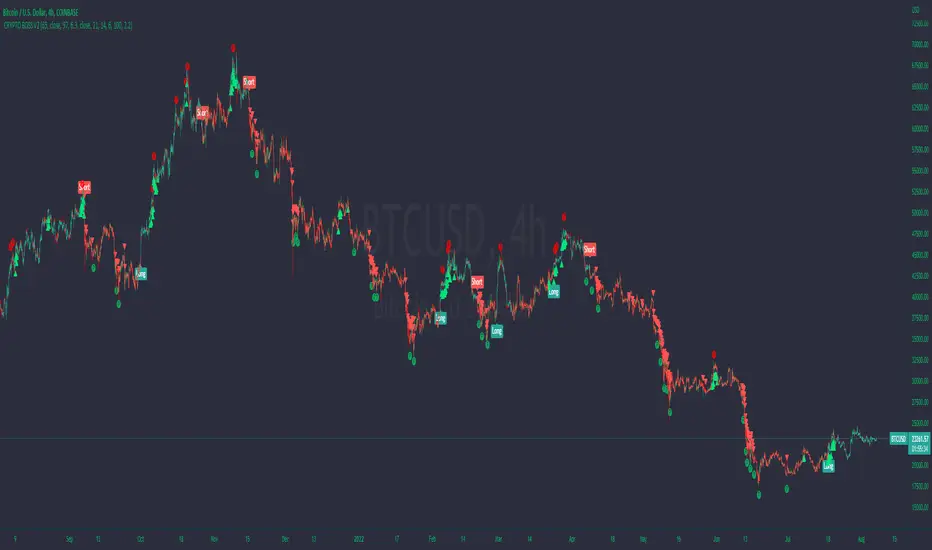
BOSS| Trade Like A Bitcoin and Ethereum WhaleTHE BEST BITCOIN AND ETHEREUM INDICATOR FOR TRADINGVIEW.COM
Quantum Technology – You won’t find any other indicator out there that predicts the probability of the next candle being bullish or bearish .
No Lag, No delay, No repaint!
Quality of Signals – The new Boss Quantum allows you to be in control of the outcome probability. Higher accuracy!
Buy/Long on Long Signal
Sell/Short on Short Signal
SET ALERTS TO ONCE PER BAR CLOSE
//////////////////////////////////////////////////////////////////////
Breakouts, Profit Points, and ReEntry's
This indicator will alert you of when to take profits, when to reenter a trade, and when a breakout occurs.
TAKING PROFITS
When in a long position take long profits on teal circle which, will be above candle.
When in a short position take short profits on purple circle which, will be below candle.
I typically exit 25-50% of position and reenter 25-50% on next candle.
If a Long or Short signal on BOSS quantum is still present the long or short trade is still active.
ReENTRY's
Long ReEntry's
If in a long position and a purple circle appears below candle this indicates a great place to either reenter trade or add more to position.
If a green triangle appears below candle you can either reenter or add more to long position as this signifies a long breakout/ strong upward movement.
Short ReEntry's
If in a short position and a teal circle appears above candle this indicates a great place to either reenter trade or add more to position.
If a red triangle appears below candle you can either reenter short or add more to short position as this signifies a short breakout/ strong downward movement.
Breakout's
Green Triangle
If a green triangle appears below candle you can either reenter or add more to long position as this signifies a long breakout/ strong upward movement.
Red Triangle
If a red triangle appears above candle you can either reenter short or add more to short position as this signifies a short breakout/ strong downward movement.
SET ALERTS TO ONCE PER BAR
Available At: Bosscripts.com
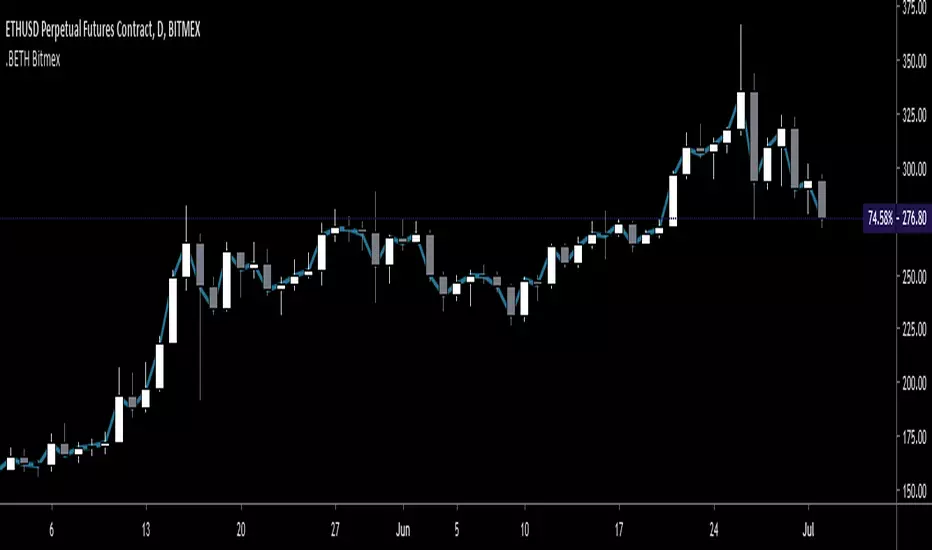
.BETH Ethereum Price Index - for BitMEX - Gyro.BETH script as seen on the BitMEX built-in chart.
This is not created by, authorized by or in any type of affiliation with BitMEX whatsoever.
This is not financial advice. Use at your own risk.
Tips are appreciated if you find this useful:
3BMEXty68scwEPfGGb4zkS23JdBCi3vtkh
See my other scripts for .BXBT!
Thanks
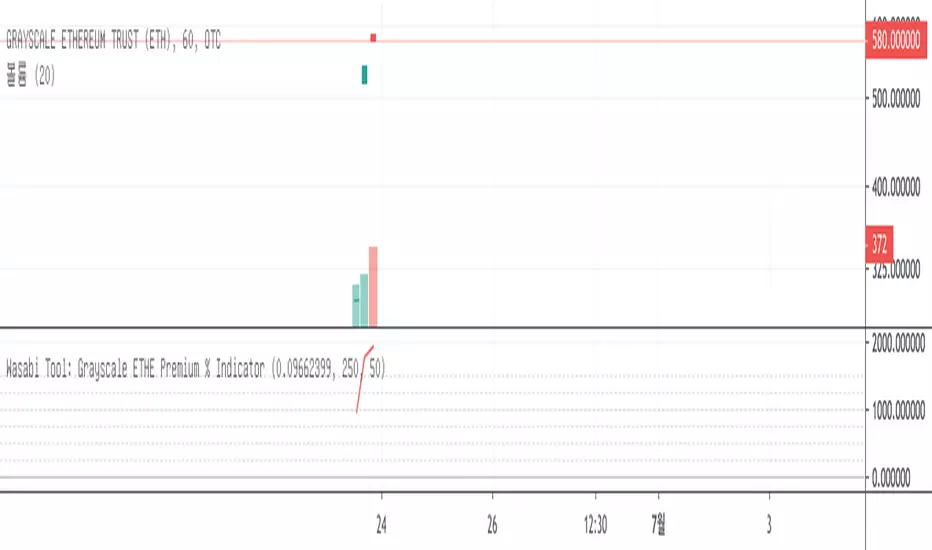
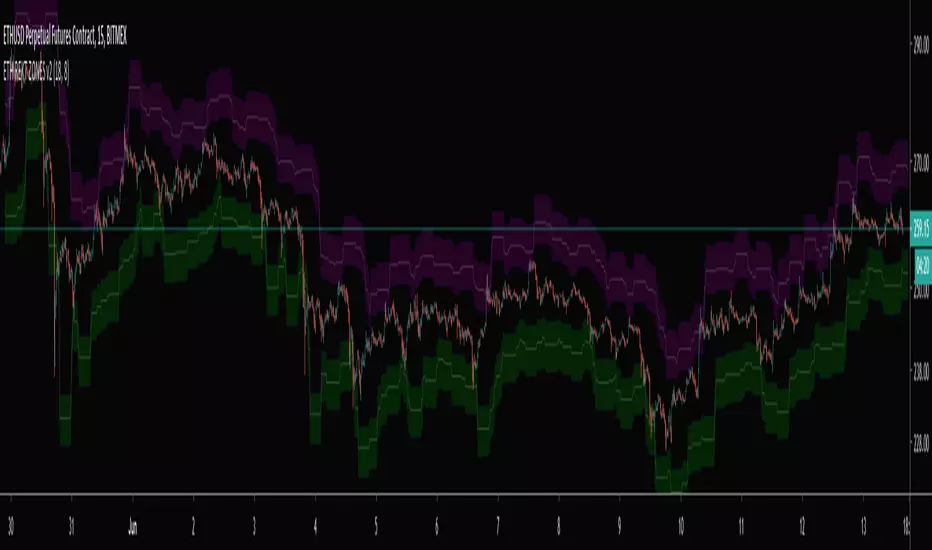
Wasabi Tool: Grayscale ETHE Premium % IndicatorThis indicator is to show the premium of the newly released Grayscale's Ethereum Trust, ETHE in percent(%).
With the volatile nature of Ethereum , the ETHE should also follow the exact price action, up or down, of Ethereum . However, some exuberant interest in the investors and the limited supply of ETHE make ETHE's price go much higher than its NAV (Net Asset Value) price per share, which is the amount of 0.09662399 ETH, also found at the Grayscale website, at the time of writing.
You may find it useful to compare this indicator along with the Ethereum trends found in Internet. The difference is that this indicator is to show the ACTUAL exuberance and eagerness by those of people who have restrictions in investing directly in Ethereum for whatever reasons.
At the time of writing, its NAV price is $28.3 based on today's ETH price of $293. However, the currently traded price is $580, which is ridiculous and is 1900%+ premium.
I hope you like the indicator.
Please subscribe and Like it.
Thanks,
Wasabi
---
안녕하세요. 와사비 입니다.
오늘 새로 만든 지표는 ' Wasabi Tool: Grayscale ETHE Premium Indicator ' 입니다.
이 지표는 그레이스케일 투자 회사의 트러스트 상품인 ETHE 가 실제 가치( NAV )대비 얼마나 프리미엄이 붙어 있는지를 표시하는 지표입니다.
비트코인의 심한 가격변동과 마찬가지로, ETHE도 이더의 가격을 쫓아갑니다. 하지만, 투자자들의 열광적인 투자관심과 ETHE의 부족한 공급물량으로 인해 ETHE의 가격이 NAV (글 쓰는 현재 기준 1 ETHE = 0.09662399 ETH )로 표현되는 실제 가치보다 훨씬 많은 프리미엄(때론, 100%이상)을 내고 거래되어 오고 있는 실정입니다.
2019년 6월 21일 현재 프리미엄이 1900%가 넘습니다.
글을 쓰고 있는 현재, 내재가치( NAV price)는 현재 이더의 가격인 $293에 대해 0.09662399 ETH이므로 약 $28.3에 불과하지만 오늘 시장에서 거래되는 가격은 $580 이고 프리미엄이 1900%+ 에 달합니다. 조심해야할 부분입니다.
어제 출시한 후, 혼탁한 시장의 분위기를 반영하고 있습니다.
와사비 드림.
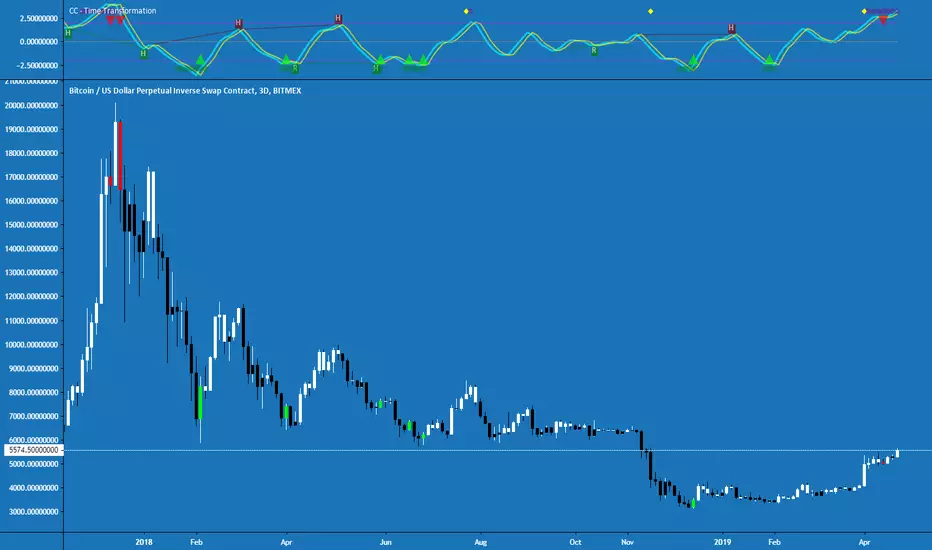
Cracking Cryptocurrency - Time TransformationTime Transformation is the creation of the Cracking Cryptocurrency Premium Trading Group . It's purpose is to provide volume , momentum, trend, and divergence at a glance. This limits the restrictions of a trader dramatically, by providing them with a powerful tool applicable on any asset, any time frame.
Momentum:
Time Transformation accurately interprets precise entry and exit positions in a ranging market via overbought and oversold conditions. When an asset is trending, these levels also indicate short-term exhaustion, and ideal profit taking levels.
These levels are completely customization, by adjusting the Cycle Length, and the boundaries of overbought and oversold itself. Also, with an advanced algorithm that calculates advanced price action, you can adjust this measurement for optimum results. One can even look at the momentum on a different time frame.
Trend:
Utilizing the power of Heikin Ashi to identify the dominant trend, this allows a trader to filter out the noise of Japanese candlesticks while still looking at their more accurate OHLC price information. Bars are colored pursuant to the dominant Heikin Ashi trend. One can also look at the Heikin Ashi trend of a higher or lower time frame to adjust the noise filtration.
Volume:
All traders know that we need volume for profitable movements. This indicator succinctly points out periods of unnatural volume , alerting a trader that a potential reversal or breakout may be occurring.
Divergence:
This Indicator understands fractal patterns of price action and oscillator movement. This allows for both Regular and Hidden divergence to be detected and displayed on the screen in real-time. One of the most powerful features of this indicator.
This Indicator boasts Multi-Time Frame features for both it's Momentum Oscillator and Trend Pattern Function, as well as fully adjustable settings for every function. Alerts are coded for every possible occurrence a trader could want.
Begin your journey towards market domination today. Allow this Indicator to Transform your Trading as it Transforms Time.
For access to this and all other Cracking Cryptocurrency Proprietary Indicators and Strategies, visit Cracking Cryptocurrency Premium Trading Group
Update Log:
-Adjusted default aesthetics to make Signal and Trigger Line more visible on a variety of backgrounds.
-Adjusted default aesthetics of zero line, overbought, oversold.
-Updated entire script to Pine Script Version 3.
-Updated Heikin Ashi Bar Recoloring Script - Will not re-paint, monitors the open and closing price and switches colors faster.
-Updated Input Setings for Multi-Time Frame feature. Much easier and more intuitive to select Time Frames from the drop-down menu.
-Simplified Input Settings, making them more intuitive.
-Updated Alert Messages to ease language barrier difficulties.
By Request: Added Alert Function for regular crosses.
Upcross = Fisher Crossing Over Signal Line.
Downcross = Fisher Crossing Under Signal Line.
Note that these are not buy/sell signals as per the Time Transformation strategy, as those crosses must occur in either overbought or oversold territory. :)

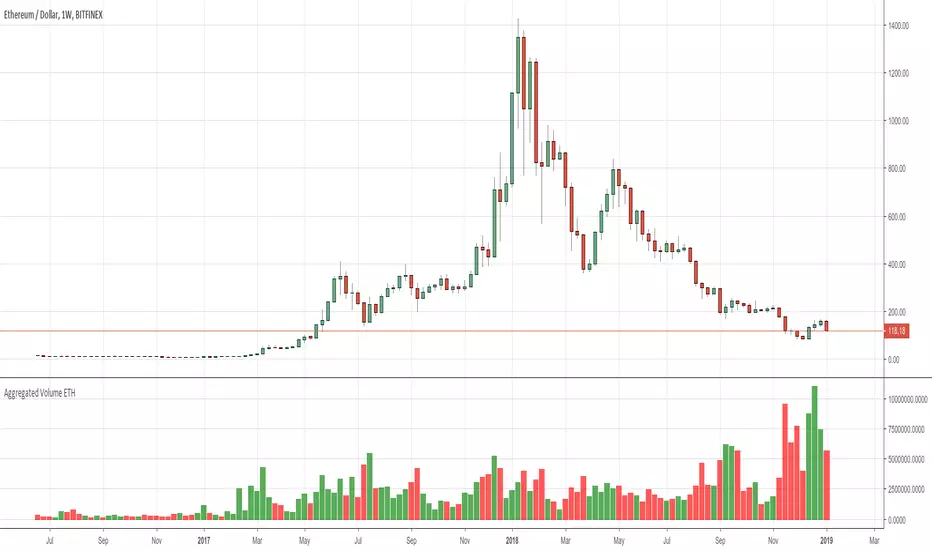
ETH HawkEye Aggregated Volume IndicatorThis is combined Aggregated ETH Exchange Volume by Neobutane with HawkEye volume clone indicator by LazyBear.
Indicator includes aggregated raw ETH volume from 7 user selectable fiat and tether exchanges on USD, USDT, BTC, EUR, GBP, JPY pairs + Exponential MA + hawkeye bar coloring where: green is bullish volume , red - bearish and white - volume neutral to the market:
Bitfinex
Coinbase
Bitstamp
Kraken
Binance
Poloniex
Bittrex
*There is a TV bug that doesn't display a whole volume history if some pair was added later than date intended to be analysed by operator eg, if you want to watch older data you should exclude all secondary pairs that were added later and switch off "newer" exchanges like Binance.

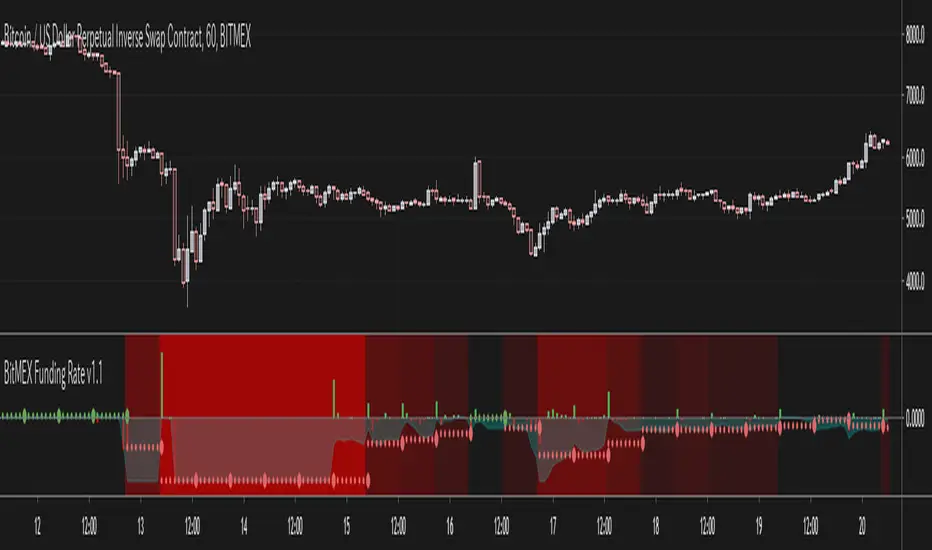
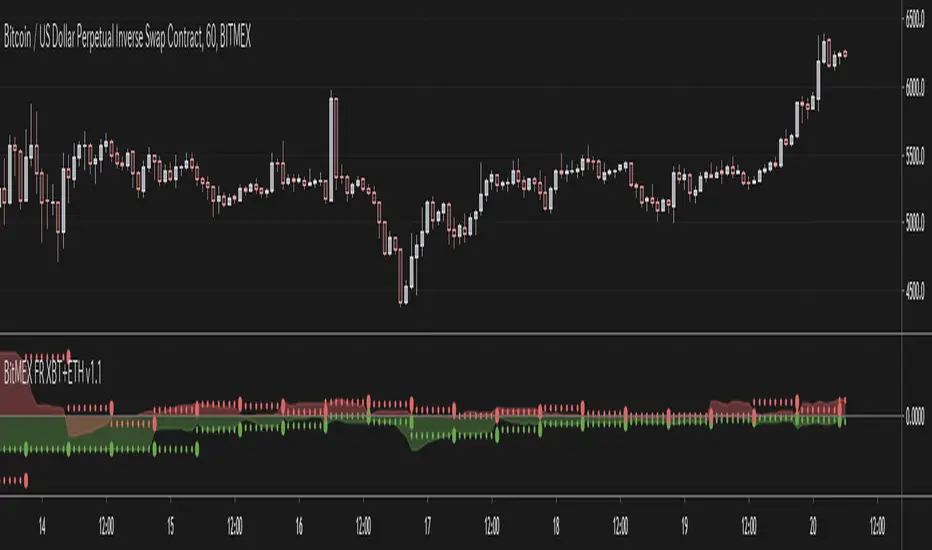
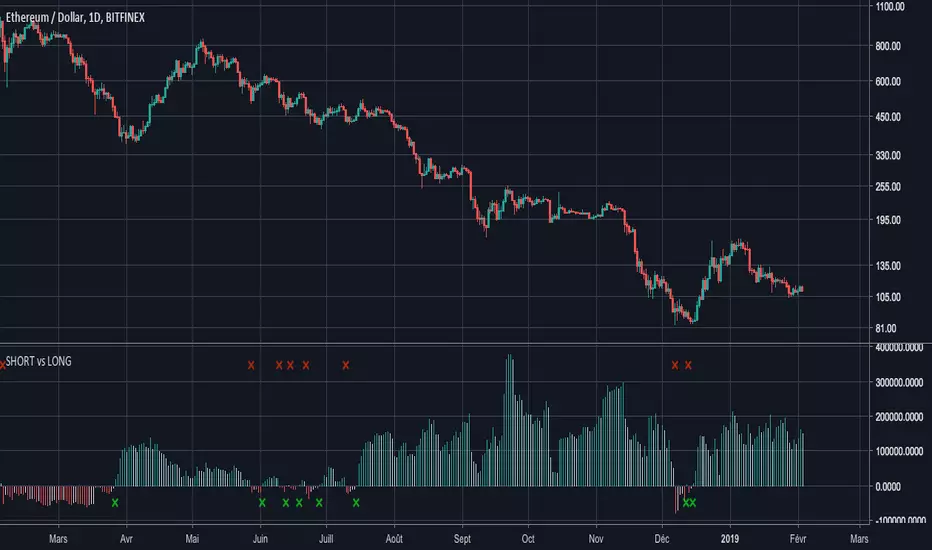
ETHUSDSHORTS - ETHUSDLONGS : balance of powerHello everyone,
I noticed that many people try to compare SHORTS and LONG positions (see:ETHUSDSHORTS and ETHUSDLONGS ), and the available indicators don't sufficiently highlight the balance of power .
That's why I programmed this indicator to answer this need ( which I also have ! ).
His ETHUSDSHORTS - ETHUSDLONGS crossover indicator e of power
I think you will understand quickly how it works, it's easy :
- If the histogram is negative, the color is red and that means that there are more BTCUSDSHORTS than ETHUSDLONGS
- If the histogram is positive, the color is green and that means that there are more ETHUSDLONGS than ETHUSDSHORTS
A small cross (red or green) appears when the power balance is reversed.
Have a good day.
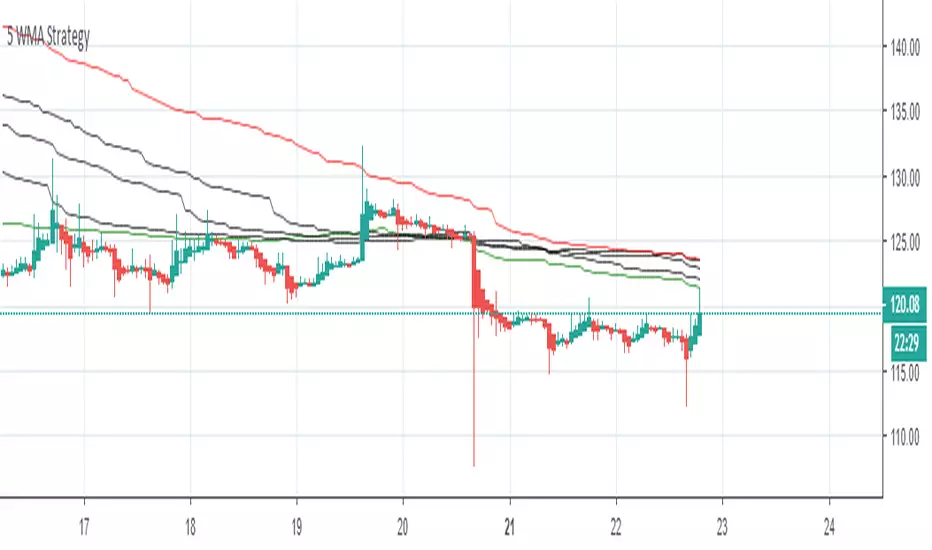
5 Weighted Moving Averages Strategy for Trend Analysis This indicator was made to allow Five WMA to be displayed without needing to use up 5 charting indicators individually
This is best Indicator for Support and Resistance, If GREEN line is on TOP market Bullish
If RED line is on Top Market is Bearish ,
Entry and Exit place Long and Short orders on Lines According to Trend
For more info contact : rohitworkss@gmail.com
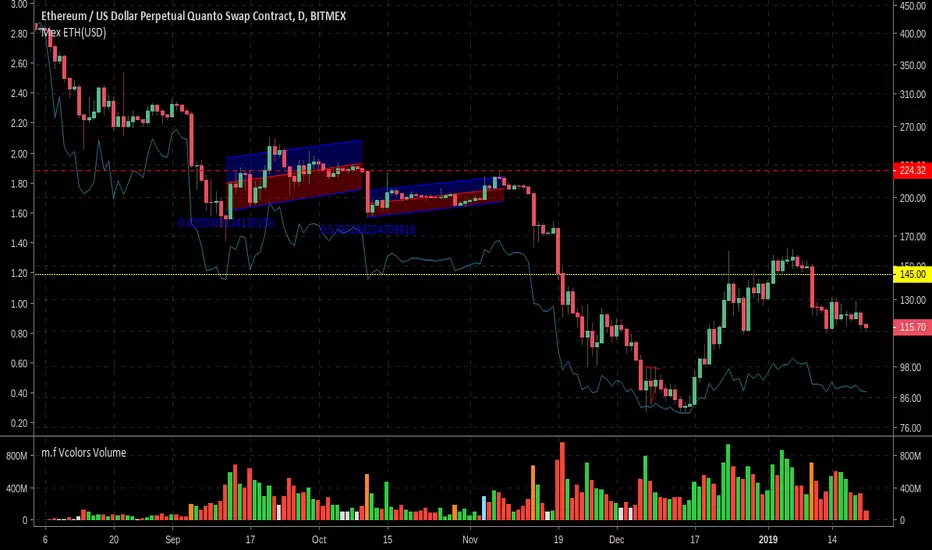
BitMEX ETHUSD contract value (USD)The ETHUSD Quanto Swap contract on BitMEX allows you to trade ETHUSD with Bitcoin put forward as collateral. However this means that 1 contract is not equal to 1 USD or 1 ETH, but instead varies according to the price of ETHUSD.
You can see the contract specs here www.bitmex.com and find more information here blog.bitmex.com
My advice is always to make sure you fully understand a derivative product before you trade it, however many of us may not have the acumen to actually understand how a quanto swap works. Nevertheless, we have to be aware that the value in USD of each contract depends on the price of Ethereum and also the price of Bitcoin at each point in time.
This tool will show you the value of a single ETHUSD contract in USD, but it solely for indicative purposes only. Your trade, your risk. I do not ask for any donations from your gains and I am not liable for any of your losses.
Source code is provided.
Note in the example image that the price of ETHUSD is plotted on a logarithmic scale but the indicative contract value is linear.
BTC ETH RatioBTCUSD / ETHUSD Ratio.
You might find patterns when to move from BTC to ETH and vice versa.
# Open Source
The code is open source @ github.com and uses the commonpine library github.com

Aggregated Volume ETHAggregates the ETH/fiat volume from multiple exchanges into a single indicator.
# Exchanges and Pairs
Included are only exchanges supported by TradingView:
* Binance
* Bitstamp
* Bittrex
* Coinbase
* Gemini
* itBit
* Bitfinex
* Kraken
* Poloniex
* BitMEX
Excluded low volume exchanges (not in CMC Top):
* CEX . IO
* Coinfloor
Excluded exchange due to volume calculation by TV:
* HitBTC
Many other top exchanges are not included, because they are not supported by TradingView.
# Inputs
By default the spot exchanges are selected. You can select also the other margin trading and derivatives exchanges.
# Contribute
Feel free to share any ideas and issues you have.
# Open Source
The code is open source @ github.com and uses the commonpine library github.com
ETHUSD Total VolumesHello traders!
This tool shows you ETHUSD total trade volumes from the all (well, almost) cryptocurrency exchanges on different timeframes.
Supported timeframes
"1"
"3"
"5"
"10"
"15"
"30"
"45"
"60" - 1 hour
"120" - 2 hours
"180" - 3 hours
"240" - 4 hours
"300" - 5 hours
"360" - 6 hours
"420" - 7 hours
"480" - 8 hours
"540" - 9 hours
"600" - 10 hours
"660" - 11 hours
"720" - 12 hours
"780" - 13 hours
"840" - 14 hours
"900" - 15 hours
"960" - 16 hours
"1020" - 17 hours
"1080" - 18 hours
"1140" - 19 hours
"1200" - 20 hours
"1260" - 21 hours
"1320" - 22 hours
"1380" - 23 hours
"D"
"2D"
"3D"
"W"
"M"
How to get access
Buy for only 25$ to get lifetime access to this indicator
Like and follow for more cool indicators!
Happy Trading!

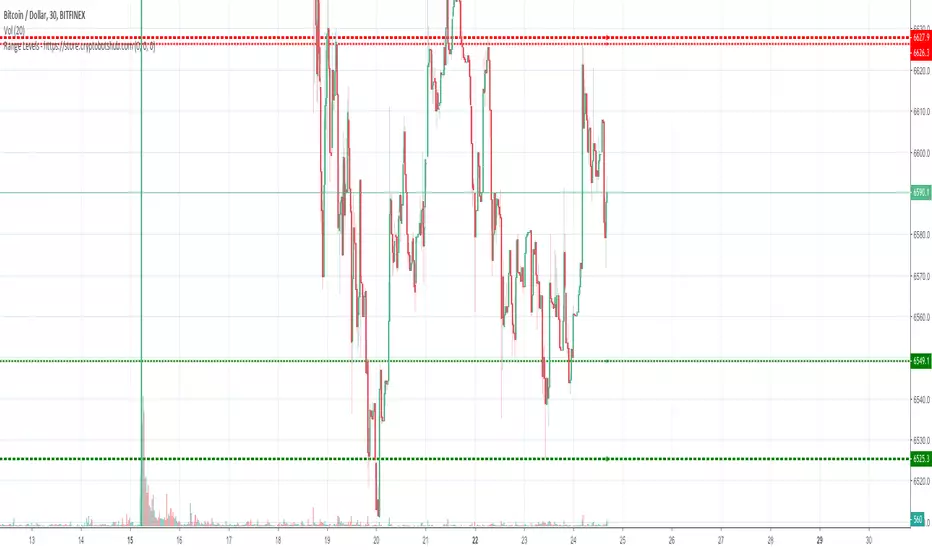
Range Levels - High and Low of Daily, Weekly, and Montly RangesThis is a great free script for the current ranging crypto markets.
You can see the daily, weekly, and monthly high and low of ranges. It also has alerts that you can enable in the settings and then setup in your TradingView alerts for when the price crosses these levels.
Customer Request: Trend Precognition - Mtrl_ScientistHi everyone,
This is a private build specifically requested by one user.
There are options to enable/disable 4 additional algorithms, whereas the current setting only shows the base algorithm ("BTC Precognition").
The "warning" text indicates a possible trend change, and is based on overbought/oversold conditions that can be adjusted in the settings.

Bitmex'd Trading Alerts /w TP and SLTrading Alerts for Bitmex, optimised for XBTUSD and ETHUSD
Added Stop-Loss and Take-Profit

Satoshi RSI
Custom RSI for Satoshi's friends 😎
Over Bought = 80+
High Line = 60+
Low Line = -40
Over Sold = -20
CHOP ZONE = 40-60
added horizontal points for common valley points
EMA and SMA crossover technique
EMA 5
SMA 21
variables can be changed but this is the standard
RSI crossover EMA5 is a signal and the crossover of the SMA21 is the confirmation vice versa.
although waiting for confirmation may draw from wins.
background is shaded white for bull trend and red for bear.
Colors can be changed
future variants will be released. 🚀

VJ_Holy_Grail_Scalper_Swing_Trader_v1// Added Scalper and Swing Trader in 1 indicator to help those who are using free version on TV
// Added Alerts for Scalp Buy/Sell, Swing Buy/Sell and TP alerts(for both scalper and swing trader) to work with Autoview
