MARSdx BTCUSD Strategy🔍 Strategy Overview
The MARSdx Strategy is a hybrid trend-following and momentum-based system designed specifically for Bitcoin trading(works also on other Crypto like ETHUSD). It combines four technical indicators—SMA, EMA, RSI, and ADX—to filter high-probability long entries during strong bullish phases.
✅ Entry Conditions
Price above SMA(50) → confirms long-term bullish trend
Price above EMA(7) → confirms short-term momentum
RSI(2) > ADX(2) → confirms strong bullish pressure
Only when all three conditions are met, a long position is opened.
❌ Exit Condition
RSI(2) < ADX(2) → momentum weakens, exit position
📊 Indicators Used
SMA (Simple Moving Average) – identifies overall trend
EMA (Exponential Moving Average) – captures short-term momentum
RSI (Relative Strength Index) – gauges strength of price movement
ADX (Average Directional Index) – filters based on trend strength
⚙️ Inputs
SMA Length: Default 50
EMA Length: Default 7
RSI Length: Default 2
ADX Length: Default 2
You can tweak these parameters to suit other timeframes or crypto assets.
⚠️ This strategy only takes long trades. It does not use any stop-loss or profit target logic and should be combined with sound risk management.
ETHUSD

Quatro SMA Strategy [4h]Hello, I would like to present to you The "Quatro SMA" strategy
Strategy is based on four simple moving averages of different lengths and monitoring trading volume. The key idea is to identify strong market trends by comparing short-term moving averages with the long-term SMA. The strategy generates buy signals when all short-term SMAs are above the SMA(200) and the volume confirms the strength of the move. Similarly, sell signals are generated when all short-term SMAs are below the SMA(200), and the volume is sufficiently high.
The strategy manages risk by applying a stop loss and three different Take Profit levels (TP1, TP2, TP3), with varying percentages of the position closed at each level.
Each Take Profit level is triggered at a specific percentage gain, with the position being closed gradually depending on the achieved targets. The percentage of the position closed at each TP level is also defined by the user.
Indicators and Parameters:
Simple Moving Averages (SMA):
The script utilizes four simple moving averages with different lengths (4, 16, 32, 200). The first three SMAs (SMA1, SMA2, SMA3) are used to determine the trend direction, while the fourth SMA (with a length of 200) serves as a support/resistance line.
Volume:
The script monitors trading volume and checks if the current volume exceeds 2.5 times the average volume of the last 40 candles. High volume is considered as confirmation of trend strength.
Entry Conditions:
- Long Position: Triggered when SMA1 > SMA2 > SMA3, the closing price is above SMA(200), and the volume condition is met.
- Short Position: Triggered when SMA1 < SMA2 < SMA3, the closing price is below SMA(200), and the volume condition is met.
Exit Conditions:
- Long Position: Closed when SMA1 < SMA2 < SMA3 and the closing price is above SMA(200).
- Short Position: Closed when SMA1 > SMA2 > SMA3 and the closing price is below SMA(200).
to determine the level of stop loss and target point I used a piece of code by RafaelZioni, here is the script from which a piece of code was taken
I hope the strategy will be helpful, as always, best regards and safe trades
;)

BTC outperform atrategy### Code Description
This Pine Script™ code implements a simple trading strategy based on the relative prices of Bitcoin (BTC) on a weekly and a three-month basis. The script plots the weekly and three-month closing prices of Bitcoin on the chart and generates trading signals based on the comparison of these prices. The code can also be applied to Ethereum (ETH) with similar effectiveness.
### Explanation
1. **Inputs and Variables**:
- The user selects the trading symbol (default is "BINANCE:BTCUSDT").
- `weeklyPrice` retrieves the closing price of the selected symbol on a weekly interval.
- `monthlyPrice` retrieves the closing price of the selected symbol on a three-month interval.
2. **Plotting Data**:
- The weekly price is plotted in blue.
- The three-month price is plotted in red.
3. **Trading Conditions**:
- A long position is suggested if the weekly price is greater than the three-month price.
- A short position is suggested if the three-month price is greater than the weekly price.
4. **Strategy Execution**:
- If the long condition is met, the strategy enters a long position.
- If the short condition is met, the strategy enters a short position.
This script works equally well for Ethereum (ETH) by changing the symbol input to "BINANCE:ETHUSDT" or any other desired Ethereum trading pair.

Aroon and ASH strategy - ETHERIUM [IkkeOmar]Intro:
This post introduces a Pine Script strategy, as an example if anyone needs a push to get started. This example is a strategy on ETH, obviously it isn't a good strategy, and I wouldn't share my own good strategies because of alpha decay. This strategy combines two technical indicators: Aroon and Absolute Strength Histogram (ASH).
Overview:
The strategy employs the Aroon indicator alongside the Absolute Strength Histogram (ASH) to determine market trends and potential trade setups. Aroon helps identify the strength and direction of a trend, while ASH provides insights into the strength of momentum. By combining these indicators, the strategy aims to capture profitable trading opportunities in Ethereum markets. Normally when developing strats using indicators, you want to find some good indicators, but you NEED to understand their strengths and weaknesses, other indicators can be incorporated to minimize the downs of another indicator. Try to look for synergy in your indicators!
Indicator settings:
Aroon Indicator:
- Two sets of parameters are used for the Aroon indicator:
- For Long Positions: Aroon periods are set to 56 (upper) and 20 (lower).
- For Short Positions: Aroon periods are set to 17 (upper) and 55 (lower).
Absolute Strength Histogram (ASH):
ASH is calculated with a length of 9 bars using the closing price as the data source.
Trading Conditions:
The strategy incorporates specific conditions to initiate and exit trades:
Start Date:
Traders can specify the start date for backtesting purposes.
Trade Direction:
Traders can select the desired trade direction: Long, Short, or Both.
Entry and Exit Conditions:
1. Long Position Entry: A long position is initiated when the Aroon indicator crosses over (crossover) the lower Aroon threshold, indicating a potential uptrend.
2. Long Position Exit: A long position is closed when the Aroon indicator crosses under (crossunder) the lower Aroon threshold.
3. Short Position Entry: A short position is initiated when the Aroon indicator crosses under (crossunder) the upper Aroon threshold, signaling a potential downtrend.
4. Short Position Exit: A short position is closed when the Aroon indicator crosses over (crossover) the upper Aroon threshold.
Disclaimer:
THIS ISN'T AN OPTIMAL STRATEGY AT ALL! It was just an old project from when I started learning pine script!
The backtest doesn't promise the same results in the future, always do both in-sample and out-of-sample testing when backtesting a strategy. And make sure you forward test it as well before implementing it!

Comparison with BTC (RSI)显示当前品种与BTC汇率对的RSI值
以此判断强势或弱势品种以及超买超卖
——————————
Display the RSI value of the exchange rate between the current variety and BTC
Use this to determine strong or weak varieties, as well as overbought and oversold

Crypto Trend IndicatorThe Crypto Trend Indicator is a trend-following indicator specifically designed to identify bullish and bearish trends in the price of Bitcoin, and other cryptocurrencies. This indicator doesn't provide explicit instructions on when to buy or sell, but rather offers an understanding of whether the trend is bullish or bearish. It's important to note that this indicator is only useful for trend trading.
The band is a visual representation of the 30-day and 60-day Exponential Moving Average (EMA). When the 30-day EMA is above the 60-day EMA, the trend is bullish and the band is green. When the 30-day EMA is below the 60-day EMA, the trend is bearish and the band is red. When the 30-day EMA starts to converge with the 60-day EMA, the trend is neutral and the band is grey.
The line is a visual representation of the 20-week Simple Moving Average (SMA) in the daily timeframe. "Bull" and "Bear" signals are generated when the 20-day EMA is either above or below the 20-week SMA, in conjunction with a bullish or bearish trend. When the band is green and the 20-day EMA is above the 20-week SMA, a “Bull” signal emerges. When the band is red and the 20-day EMA is below the 20-week SMA, a “Bear” signal emerges. The 20-week SMA can potentially also function as a leading indicator, as substantial price deviations from the SMA typically indicate an overextended market.
While this indicator has traditionally identified bullish and bearish trends in various cryptocurrency assets, past performance does not guarantee future results. Therefore, it is advisable to supplement this indicator with other technical tools. For instance, range-bound indicators can greatly improve the decision-making process when planning for entries and exits points.

Cryptocurrency Market Sentiment v1.0Introduction:
Capable of observing the market sentiment of the cryptocurrency market
The relative status of BTC and altcoins
How it works:
1. The general uptrend process of the cryptocurrency market is BTC → ETH → high-cap altcoins → low-cap altcoins. When funds cannot push up BTC's market cap, funds gradually flow into smaller-cap altcoins until the upward trend ends.
2. Select ETH as the representative of altcoins, and understand the sentiment and current stage
3. Mathematical principle : divide the price of ETH by the price of BTC, and then apply it to the RSI formula .
How to use it:
1. Similar to the RSI indicator , when CMS enters the overbought zone, it represents an active altcoin market, a passionate market sentiment , and the end of the uptrend.
2. When CMS enters the oversold zone, it indicates the leading stage of BTC in the rising trend or the capital flow back to BTC in the declining process .
3. If CMS is at a low level, long positions should focus on altcoins, and short positions should focus on BTC, and vice versa.
----------------------------------------------------------------------------------------------------------
简单介绍:
能够观察加密市场市场情绪
BTC和寨币的相对状态
如何工作:
1、加密市场一般的上涨过程为 BTC → ETH → 大市值山寨 → 小市值山寨,当资金无法推动大市值的BTC上涨时,资金就会逐渐流向市值较小的山寨,直到一轮上涨结束。
2、选取ETH作为altcoins的代表,通过ETH与BTC的关系来了解加密市场的情绪和目前上涨的阶段。
3、数学原理:将ETH的价格/BTC的价格,随后将其带入RSI公式
如何使用:
1、与RSI指标类似,当cms进入超买时,代表寨币市场的活跃,市场情绪热烈,上涨进入尾声。
2、当cms进入超卖时,为上涨中BTC领涨的阶段或下降过程中资金回流BTC。
3、如果cms在低位,做多应关注altcoins,做空应关注btc,反之亦然。

Customizable Moving Average RibbonThis indicator is a highly customizable moving average ribbon with some unique features.
This script can utilize multiple unique sources, including a non-repainting renko closing price. Renko charts focus solely on price movement and minimize the impacts of time and the extra noise time creates. Employing the renko close helps smooth out the MA ribbon. Insignificant price movements will not cause a change in the plotted lines of the indicator unless a new threshold is breached or a "brick" is created. This is highly useful for quickly identifying consolidation areas or overall flat price movement.
There are two methods for selecting the box size when utilizing the renko source. Box size is critical for the overall function and efficacy of the plots you will visually see with this indicator. Box size is set automatically using the Average True Range "ATR" or manually using the "Traditional" setting. The simplest way to determine a manual box size is to take the ATR of the given instrument and round it to the nearest decimal place. As an example, if the ATR for the asset is 0.18, you would round that number to 0.2 and utilize this as your traditional box size.
The MA ribbon contains eleven adjustable moving average lines. Users can choose to turn off as many as they would like. Users can also adjust the length of the individual moving averages and the source for all moving averages. There are nine types of moving averages to choose from for the ribbon. The MA options are:
Exponential Moving Average = 'EMA'
Double Exponential Moving Average= 'DEMA'
Triple Exponential Moving Average = 'TEMA'
Simple Moving Average = 'SMA'
Relative Moving Average = 'RMA'
Volume Weighted Moving Average = 'VWMA'
Weighted Moving Average = 'WMA'
Smoothed Simple Moving Average = 'SSMA'
Hull Moving Average = 'HULL'
We believe that the ribbons features, including the line color change, help quickly identify trends and give users optimum customization. Users can select from five different color schemes including:
Green/Red
Purple/White
White/Blue
Silver / Orange
Teal/ Orange

Price Distance RatioThis study plots the ratio between current price and the price N days ago.
With N input that is configurable, users can find optimal long/short entries when price is in an established trend and price has diverge far from a given local peak or all time high.
With many years of stock trading the analysis indicates a connection between the distance of price and subsequent returns.
Portfolios of stocks with lower price to local highes ratios generally underperformed portfolios of stocks with higher prices to peaks reached similar N days ago.
The highest returns to previous peak are recorded when buying at the biggest dip.
For example, the purchase at 20% drawdown could generate 25% when price returns to the peak. The purchase at 50% drawdown could generate bigger, i.e. 100% return, when price returns to the peak. And the purchase at 90% drawdown could generate much bigger, i.e. 900% return, in a case the price returns to the peak.
However, buying very far below local peaks on almost all holding periods produces lower CAGR returns because of "timing adjustment". In simple words, typically the drawdown takes less time vs. further recovery.
For example:
👉 The largest BTC drawdown in 2013-2015 took 410 days (Peak-to-Valley) . And the recovery of BTC to new highs took 771 days (Valley-to-Peak) after that.
👉 The 3rd longest drawdown in BTC took 363 days (observed from December 17, 2017 to December 15, 2018). And further recovery in BTC to its new high took almost two years - 716 days .
👉The 4th longest drawdown in BTC took 162 days (observed from June 08, 2011 to November 17, 2011). And further recovery in BTC to its new high took more than a year - 469 days .
The concept of this study could recognizes at least 4 different modes of action.
👉 In a clearly established upward trend traders should be buying (following the trend) when Ratio is above 100% and reducing the size when Ratio turns below 100%.
👉 Conversely, in a clearly established downward trend traders should be shorted when Ratio is below 100% and covering when the Ratio turns back to 100%.
👉 In a sideways movement traders are advised to wait carefully if the Ratio near 100% for a long time, and take a position the trend is clear.
👉 Chartists can analyze the dynamic of the indicator - both in terms of trends and overall level. For example as it shown at the chart.
The understading of the study and rules of "timing adjustments" could genarate the awesome opportunities for stock options traders also, with strategies of selling uncovered call options and vertical call spreads.
// Many thanks to @HPotter and @Wheeelman wizards for their continious support and assistance.

Trend Following based on Trend ConfidenceThis is a Trend Following strategy based on the Trend Confidence indicator.
The goal of this strategy is to be a simple Trend Following strategy, but also to be as precise as possible when it comes to the question 'how confident are we that a linear trend is ongoing?'. For this we calculate the 'confidence' of a linear trend in the past number of closing prices. The idea of this strategy is that past a certain confidence, the ongoing linear trend is more likely to continue than not.
Trend Confidence:
The Trend Confidence shows us how strong of a linear trend the price has made in the past number (given by Length parameter) of closing prices. The steepness of the price change makes the Trend Confidence more extreme (more positive for an uptrend or more negative for a downtrend), and the deviation from a straight line makes the Trend Confidence less extreme (brings the confidence closer to 0). This way we can filter out signals by wild/sudden price moves that don't follow a clear linear trend.
Math behind the Trend Confidence:
A linear fit is made on the past number of closing prices, using Ordinary Linear Regression. We have the steepness of the linear fit: b in y=a+bx . And we have the standard deviation of the distances from the closing prices to the linear fit: sd . The Trend Confidence is the ratio b/sd .
Entries and Exits:
For entry and exit points we look at how extreme the Trend Confidence is. The strategy is based on the assumption that past a certain confidence level, the ongoing linear trend is more likely to continue than not.
So when the Trend Confidence passes above the 'Long entry" threshold, we go Long. After that when the Trend Confidence passes under the 'Long exit' threshold, we exit. The Long entry should be a positive value so that we go Long once a linear uptrend with enough confidence has been detected.
When the Trend Confidence passes below the 'Short entry' threshold, we go Short. After that when the Trend Confidence passes above the 'Short exit' threshold, we exit. The Short entry should be a negative value so that we go Short once a linear downtrend with enough confidence has been detected.
Default Parameters:
The strategy is intended for BTC-USD market, 4 hour timeframe. The strategy also works on ETH-USD with similar parameters.
The Length is arbitrarily set at 30, this means we look at the past 30 closing prices to determine a linear trend. Note that changing the length will change the range of Trend Confidence values encountered.
The default entry and exit thresholds for Longs and Shorts do not mirror each other. This is because the BTC-USD market goes up more heavily and more often than it goes down. So the ideal parameters for Longs and Shorts are not the same.
The positive results of the strategy remain when the parameters are slightly changed (robustness check).
The strategy uses 100% equity per trade, but has a 10% stop loss so that a maximum of 10% is risked per trade.
Commission is set at 0.1% as is the highest commission for most crypto exchanges.
Slippage is set at 5 ticks, source for this is theblock.co.

Exponential Top and Bottom FinderThis is an indicator to identify possible tops and bottoms after exponential price surges and drops, it works best on ETH 1D, but you can also use it for bitcoin and altcoins.
It's based on stochastic first and second derivatives of a close moving average
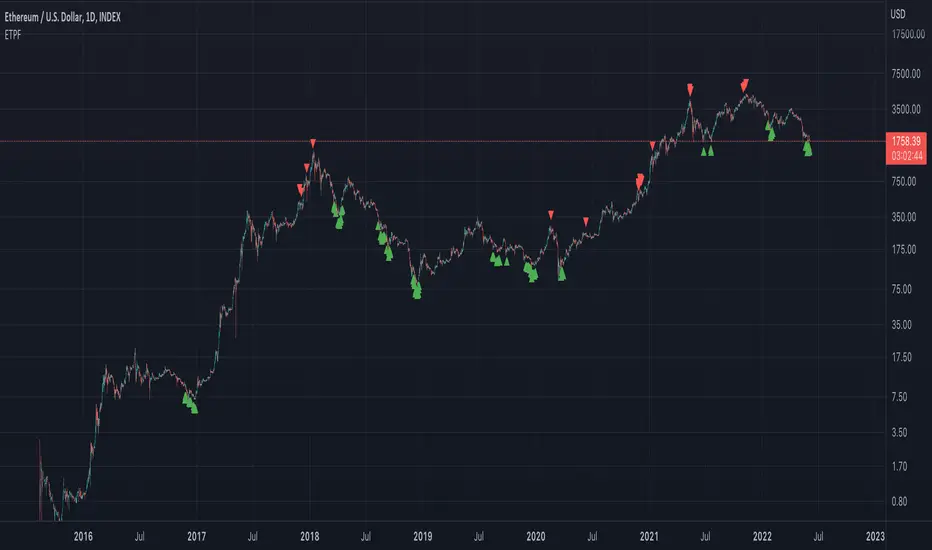

ETH Top Cap [jamesray]This script is modified from Top Cap , as published here.
Historically it matches market tops for ETH

Vix SpikeThis script calculates spikes Vix tops and bottoms. The Vix Market Bottom is calculated using CM_Williams_Vix_Fix Finds Market Bottoms (Chris Moody). The Vix Market Top is calculated as the inverse of CM Williams’ formula.
The highest Vix Bottom and the highest Vix Top are averaged (over the Highest Vix Lookback period).
Buys are signaled when the Vix Bottom line crosses below the Highest Vix Average.
Sells are signaled when the Vix Top line crosses below Highest Vix Average.
BINANCE:ETHUSDT 5 min
BYBIT:XRPUSD 5 min

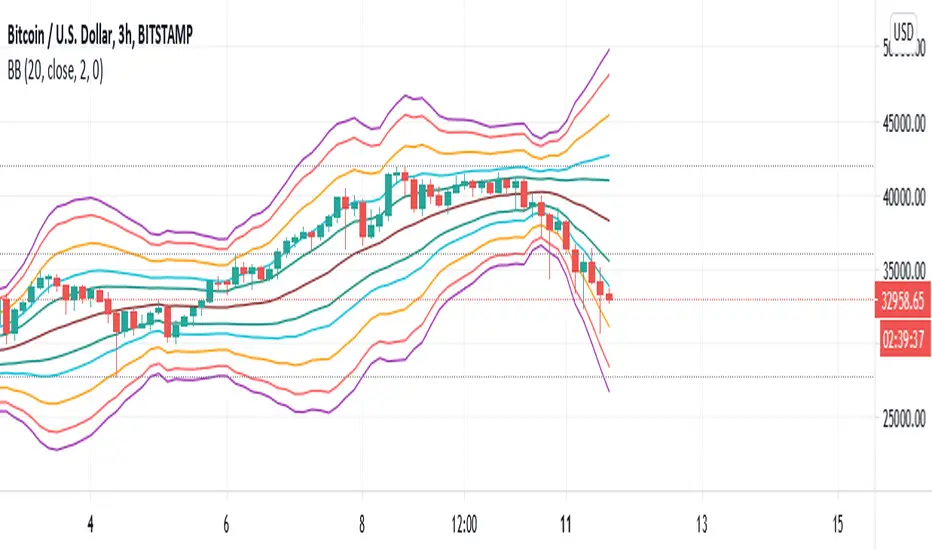
Bollinger Bands Fibonacci Ratio Standard Deviation LINESHello Traders.
in this script, Bollinger bands are made based on a standard deviation with respect to Fibonacci ratios. I hope you can be satisfied. If you are satisfied with this script, please like and feel free to share your comments with me.
Teal Upper and Lower B-Bands = 1.0 Standard Deviation
Aqua Upper and Lower B-Bands = 1.618 Standard Deviation
Orange Upper and Lower B-Bands = 2.618 Standard Deviation
Red Upper and Lower B-Bands = 3.618 Standard Deviation
Purple Upper and Lower B-Bands = 4.236 Standard Deviation
you can use this indicator by clicking the button (Add to Favorite Scripts) and then add it to your chart from (Fx) section.
Crypto ZigZag RSI strategy 15minThis strategy is designed for crypto markets like ETHUSD/T, BTCUSD/T and so on.
It works amazingly with 15 min time frames.
Its idea consists in :
We have the RSI indicator, and with it we check for the crossover with overbought and oversold levels. At the same time we have the zigzag which is made from the higher highs and the lower lows between a specific price movement in %.
For entries, they are going to be based on the crossover of rsi with overbought or oversold levels , combined together with cross over 0 line from the the zigzag.
At the same time the strategy has the posibility to go only long, only short or both.
Let me know if you have any questions.

KINSKI RSI Short/LongExtends the display of the Relative Strength Index (RSI) by shorts and longs from Bitmex and shows them as a diagram.
How to interpret the display?
- blue line is the default Relative Strength Index
- red line means "oversold
- green line "overbought"
- grey dotted line up/down indicates the optimal range for up and down movements 30 to 70
- in general, the reaching or crossing of the thresholds in the direction of the mid-range is seen as a possible buy or sell signal
- RSI values (blue line) of over 70 percent are considered "overbought", values below 30 percent "oversold
Which settings can be made?
- Selection for the "Currency". Default value is "BTCUSD". Currently only the following currencies are supported "BTCUSD", "ETHUSD", "ETCUSD", "OMGUSD", "XLMUSD", "XTZUSD".
- Selection for calculation formula ("Calculation"). The default value is "hlc3".
- Field for the moving average value ("RSI Length"). The default value is 14, but values of 7, 9 or 25 are also common. The shorter the period under consideration, the more volatile the indicator is, but with longer periods, fewer signals are triggered.
- furthermore you can make layout adjustments via the "Style" menu

Simple EMA trend indicatorSimple EMA trend indicator , pretty straightforward green equates to bullish and usually a retest/wick is often seen , same for the flipside viceversa


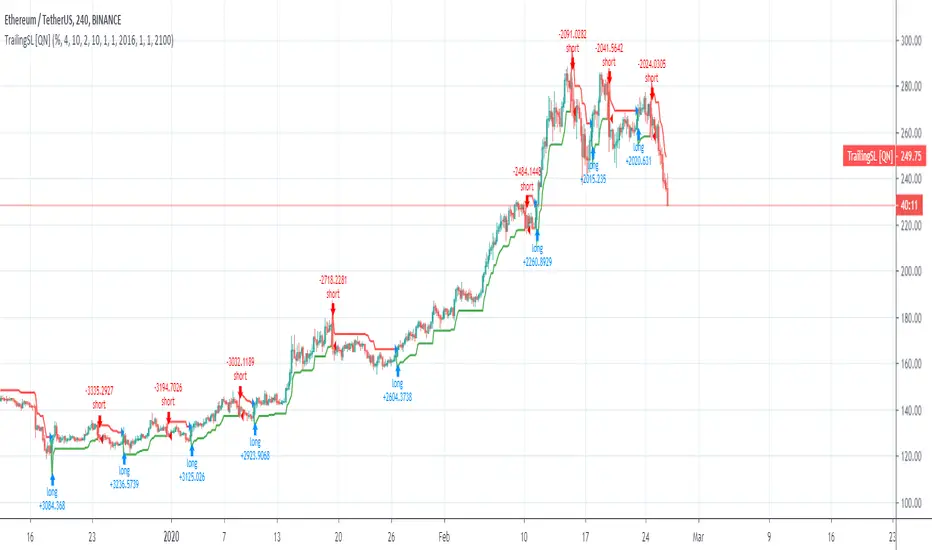
Trailing SL Strategy [QuantNomad]I'm a big fan of simple strategies.
This one is a very simple one. So it consists only from one Trailing SL. When SL is hit, the position is reversed and SL is tracked for a new position.
You can choose one of 3 types of SL:
% of your price
ATR - it is calculated as current ATR * multiplier
Absolute
As you can see even this simple strategy can show pretty good results.
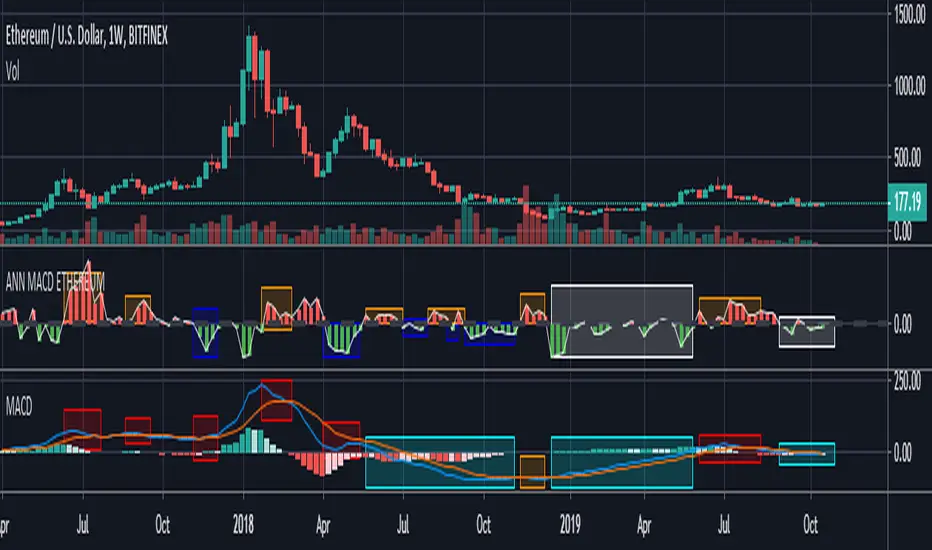
ANN MACD ETHEREUM
This script is trained with Ethereum (Timeframe : 4 hours ).
Details :
Input columns: 19
Output columns: 1
Excluded columns: 0
Training example rows: 300
Validating example rows: 0
Querying example rows: 0
Excluded example rows: 0
Duplicated example rows: 0
Input nodes connected: 19
Hidden layer 1 nodes: 8
Hidden layer 2 nodes: 1
Hidden layer 3 nodes: 0
Output nodes: 1
Learning rate: 0.7000
Momentum: 0.8000
Training error: 0.009378 ( That's a very good error coefficient. )
Many thanks to wroclai for help.
Deep learning series will continue!
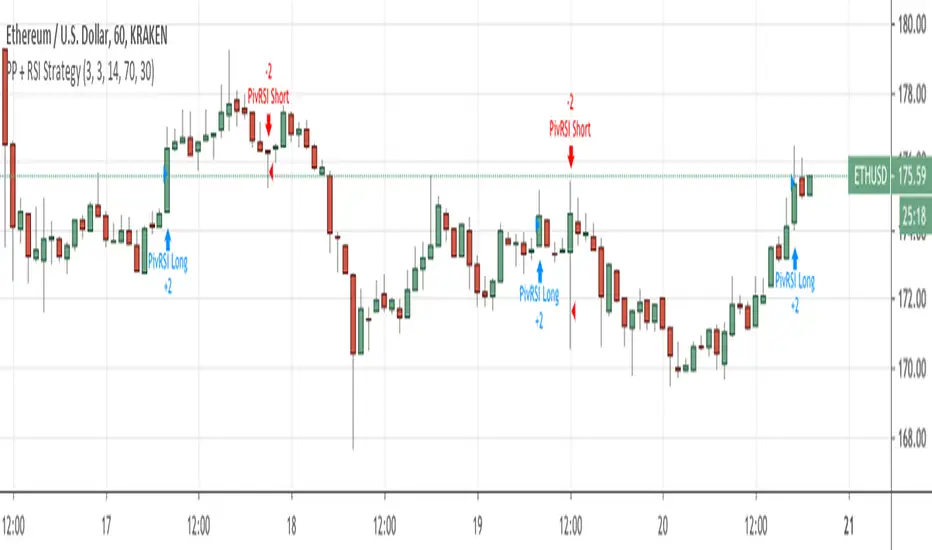
Pivot Point Reversal + RSI AlertsThese are alerts for previously published strategy:
This strategy joins the Pivot Reversal strategy with the RSI indicator.
We check RSI level at the pivot point level and only if RSI condition is satisfied we update levels for stop orders.

Pivot Point Reversal + RSI StrategyThis strategy joins the Pivot Reversal strategy with the RSI indicator.
We check RSI level at the pivot point level and only if RSI condition is satisfied we update levels for stop orders.
The strategy works pretty good for crypto, 30m, 1h, 2h timeframes.