RSI & MACD Exit IndicatorThis indicator is designed to assist traders in identifying potential exit points for long and short trades by combining the Relative Strength Index (RSI) and Moving Average Convergence Divergence (MACD).
Unlike traditional indicators that provide entry signals, this script is specifically optimized for exit strategies, helping traders manage their positions efficiently.
How It Works
The script identifies potential exit points based on the following conditions:
🔴 Exit Long:
- RSI crosses above the user-defined overbought threshold (default: 65).
- MACD crosses below the signal line (bearish crossover).
🟢 Exit Short:
- RSI crosses below the user-defined oversold threshold (default: 35).
- MACD crosses above the signal line (bullish crossover).
When these conditions align, a label appears on the price chart indicating an exit point.
Key Features
- Customizable RSI & MACD Settings – Adjust lengths and thresholds to suit your strategy.
- ATR-Based Adjustments – The script incorporates an ATR multiplier for dynamic signal adjustments based on market volatility.
- Clear Visual Labels – Exit points are clearly marked on price candles.
- Color-Coded Background – Highlights buy/sell zones for quick identification.
- Alerts for Exit Signals – Receive notifications when exit conditions are met.
- Clean Chart Design – The MACD plots are placed below the main chart to avoid clutter.
How to Use
⚠ This indicator is for exits only and does not generate buy/sell entry signals.
For long trades: When an Exit Long signal appears, traders may consider closing or reducing their long positions.
For short trades: When an Exit Short signal appears, traders may consider closing or reducing their short positions.
ATR Settings: Users can adjust the ATR multiplier to fine-tune the signal frequency based on market conditions.
Important Notes
- This indicator does not guarantee future performance—it should be used alongside other analysis methods.
- No financial advice – Always use proper risk management.
- TradingView users who do not read Pine Script can still fully utilize this script thanks to the detailed signal labels and alerts.
💡 Developed with advice from @CoffeeshopCrypto based on user feedback.
Exitindicator

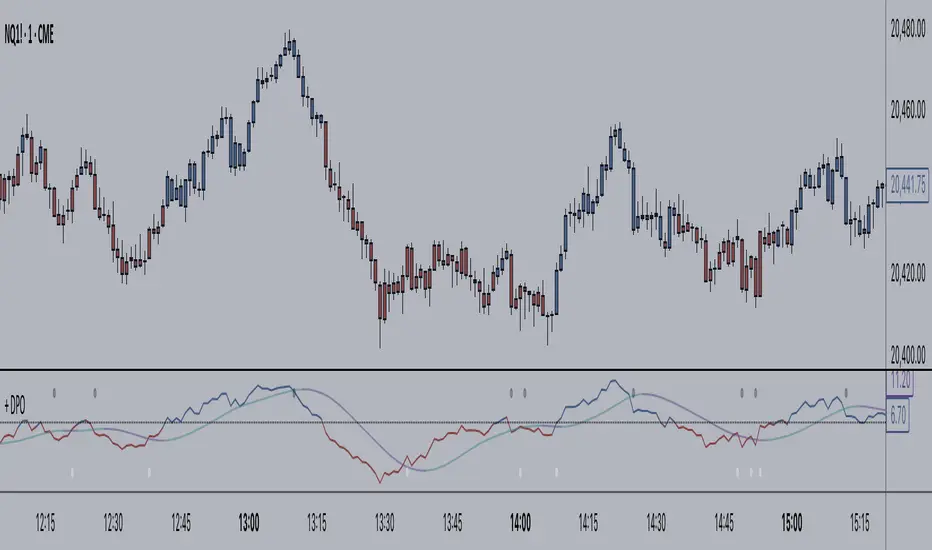
+ Detrended Price OscillatorAccording to TradingView the Detrended Price Oscillator is an oscillator that removes trend from price in order to more clearly show an instrument's cyclical
highs and lows so that an investor or trader may more easily time when to buy or sell the underlying instrument. Accordingly, it is not meant to be used as a way of gauging momentum, however, I find it perfectly suitable for the task (at least when used "un-centered" which is how it comes by default here). If you wish to read up more on the DPO just search for it under indicators. It's built in, so you'll find all the information you need on it there. Or check investopedia.
On to the good stuff. What have I done and how does this work?
As un-centered you can use it just like any other momentum oscillator. Price above the zero line is bullish and below is bearish, generally speaking.
I've added two moving averages that you can turn on or off, and choose amongst various types and lengths. Both of these are colored based on trend.
The DPO is also colored based on trend, with a neutral color based on where the DPO is relative to the primary MA and the zero line.
Candles are colored in the same way that the DPO is.
I've added Bollinger Bands because they could be useful on an indicator like this.
All the alert conditions you could dream of.
With this set to centered you will notice that the DPO is not inline with current price. That is intentional, as it's only designed to look at historical price
data to time highs and lows of price movement. As such, I don't recommend using this when set to centered, at least if you're trading crypto. The price volatility
perhaps makes for inconsistent timing of cyclical highs and lows, or perhaps it's the rather brief amount of time cryptocurrencies have been in existence.
I do not know. Just stick to using it un-centered.
The above image shows the indicator with Bollinger Bands turned on and the MA's turned off. Also, you should note that the candle color and DPO color is based on the primary moving average you are using. If you want consistency, and want to use the Bollinger Bands, then keep your primary moving average set as a 20 SMA, as that is the basis for Bollinger Bands.
Hope this is helpful to you. Definitely pair it with an additional indicator like an RSI, or my +ADP. I like to use something rangebound to compare its signals to.