Zero Phase Filtering [Repaint] - ExperimentalImportant !
The indicator is for experimental purpose only, it must not be used as a decisional tool but only as a visual one (like Zig-Zag, Fractal etc). The information this indicator display is uncertain and subject to drastic changes over time. If you have further question feel free to pm me.
Introduction
Most of the filters you will find are causal, this mean that they depend on present and past input values, this explain the lag they produce. Non causal filters however will use future input values. A well know way to get a zero-phase filter is by using the forward backward method, but this is not possible in pinescript as i recall. So we have to use some kind of function that will display future values, this is possible using the security function in version 2 or the one in version 3 using barmerge.lookahead_on .
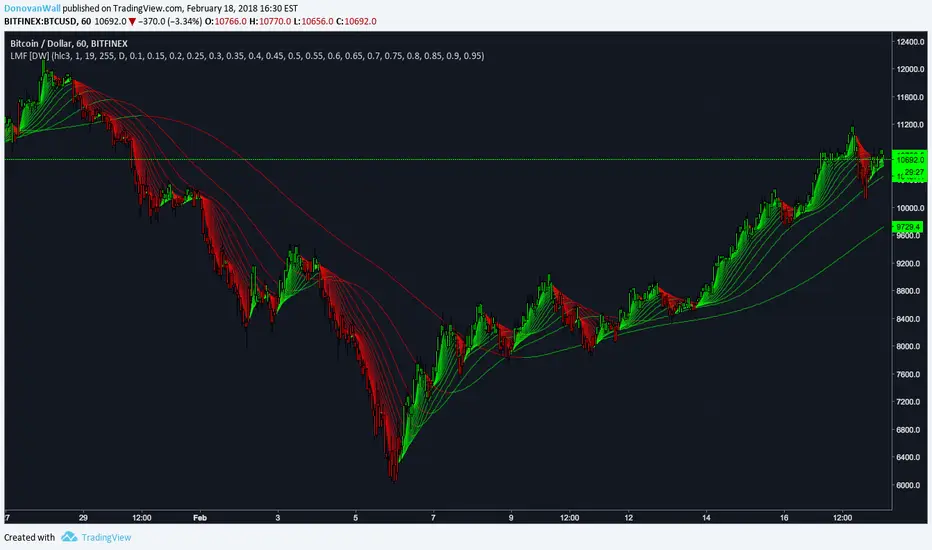
The Use Of A Repainting Indicator
Its always better to filter data in order to have a clearer view of what is happening, this can be useful when doing some forecasting or doing less formal kind of analysis. However since it repaint you cant use it as a signal provider or use signals of other indicators using this filter as source.
For example if you want to forecast a smooth indicator, the forecast of this indicator under normal circumstances could still have lag associated with it, so you would have to react before your forecast, this wont happen if you apply this filter as your indicator source.
The Filter
We smooth with a simple moving average the price provided by the security function twice, length control the smoothing level. Since security depend on the time frame you are in you must select your time frame in the indicator parameter selection window.
Filtering using 45 minutes time frame close price in a 5 minutes chart, we fix this by selecting our time frame.
Consider the fact that the input of the indicator is just periodic price, so sometimes the lag can sometimes be less or more than 0 and the estimation not centered.
The indicator can work on time frames up to 1h, after that the filter have some lag, i tried fixing this and i ended up having data errors.
Applying our filter as source for the rsi oscillator.
Conclusion
It is possible to have a kind of zero-phase filters, but it would be better if pinescript could support backward indexing thus making us able to do forward backward filtering.
Since noise can affect our analysis, applying smoothing without having to use offset in plot can be considered useful.
Experimental

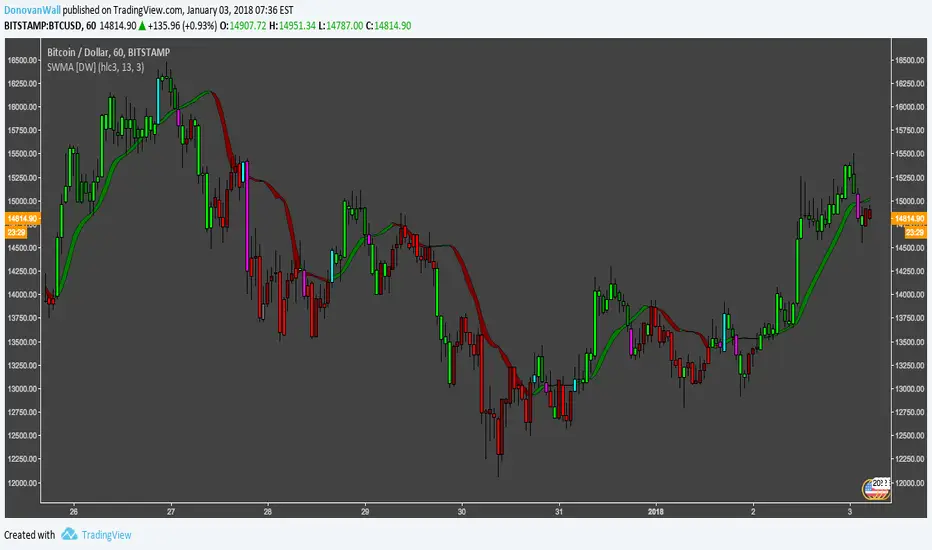
Self-Weighted Moving AverageThis type of moving average was originally developed by Alex Orekhov at his home. This WMA uses previous prices as weights for the new ones. At the moment, this is a highly experimental approach, so don't use it in real trading.
The weighting scheme is presented on the chart.

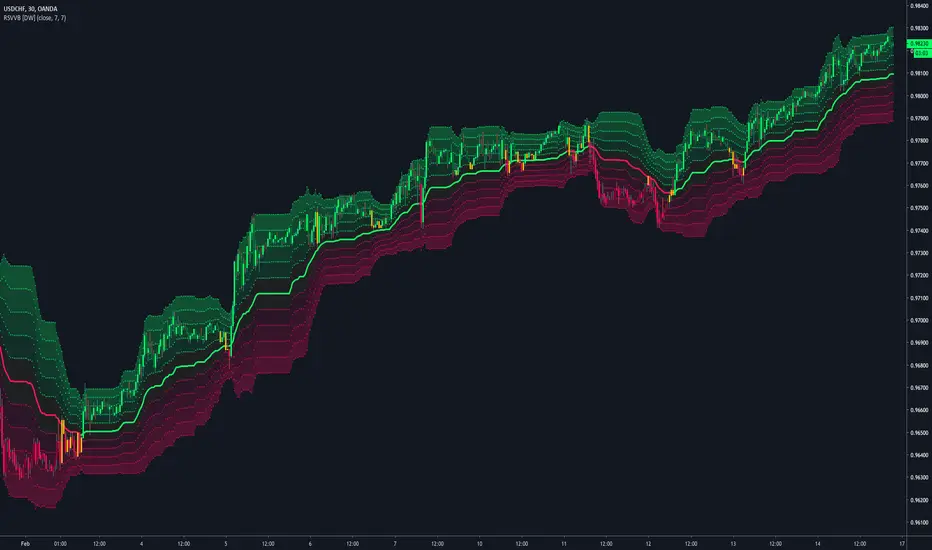
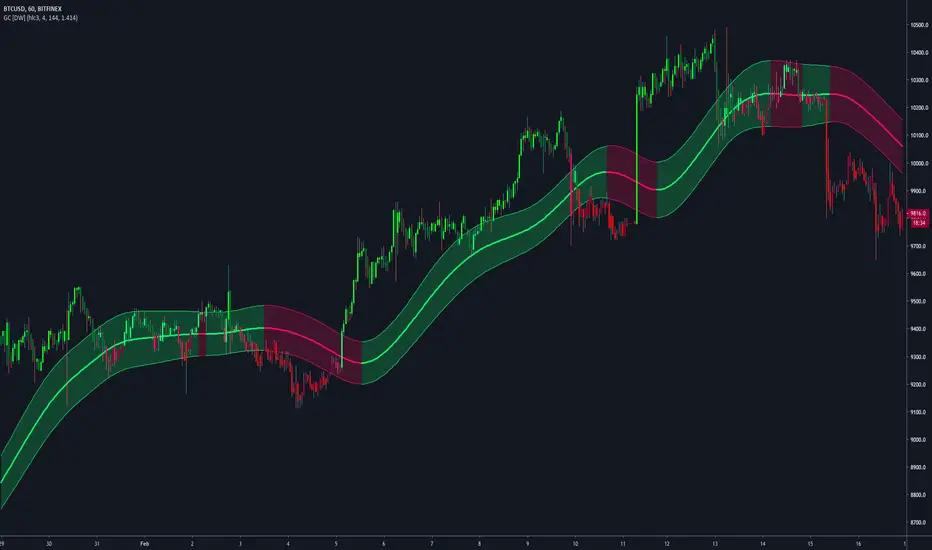
Relative Strength Volatility Variable Bands [DW]This is an experimental adaptive trend following study inspired by Giorgos Siligardos's Reverse Engineering RSI and Tushar S. Chande's Variable Moving Average.
In this study, reverse engineered RSI levels are calculated and used to generate a volatility index for VMA calculation.
First, price levels are calculated for when RSI will equal 70 and 30. The difference between the levels is taken and normalized to create the volatility index.
Next, an initial VMA is calculated using the created volatility index. The moving average is an exponential calculation that adjusts the sampling length as volatility changes.
Then, upper and lower VMAs are calculated by taking a VMA of prices above and below the initial VMA. The midline is produced by taking the median of the upper and lower VMAs.
Lastly, the band levels are calculated by multiplying the distance from the midline to the upper and lower VMAs by 1, 2, 3, 4, and 5.
Bar colors are included. They're based on the midline trend and price action relative to the upper and lower VMAs.
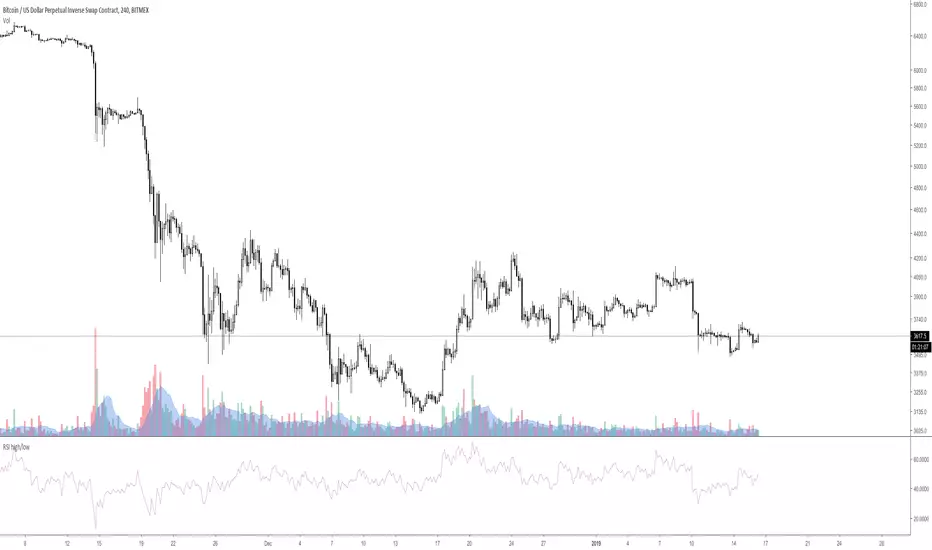
RSI high/low [experiment]This is an experiment.
This is a RSI based on candle high / low instead of close.
If the candle is up / green then the high is used.
If the candle is down / red then the low is used.
Feel free to ask if you have any question.
CVD RSI [experiment]This is not really a RSI not either a CVD. This is more like an experiment.
It's a RSI calculation applied on the CVD script i made () instead of a classic RSI based on candle close.
If you have any questions, feel free to ask.

Multi Z Score [DW]This is an experimental study using z scores of multiple sampling periods to analyze price trends.
Z score measures the number of standard deviations price is from its mean.
In this study, z scores are calculated over a Fibonacci sequence of sampling periods from 3 to 4181.
The scores are then averaged with equal weighting, resulting in a display of long term trend with short term sensitivity.
Custom bar colors are included. The color scheme is based on the perceived trend from the average z score.

Quadratic Regression Slope [DW]This is a study geared toward identifying price trends using Quadratic regression.
Quadratic regression is the process of finding the equation of a parabola that best fits the set of data being analyzed.
In this study, first a quadratic regression curve is calculated, then the slope of the curve is calculated and plotted.
Custom bar colors are included. The color scheme is based on whether the slope is positive or negative, and whether it is increasing or decreasing.

Range Filter [DW]This is an experimental study designed to filter out minor price action for a clearer view of trends.
Inspired by the QQE's volatility filter, this filter applies the process directly to price rather than to a smoothed RSI.
First, a smooth average price range is calculated for the basis of the filter and multiplied by a specified amount.
Next, the filter is calculated by gating price movements that do not exceed the specified range.
Lastly the target ranges are plotted to display the prices that will trigger filter movement.
Custom bar colors are included. The color scheme is based on the filtered price trend.


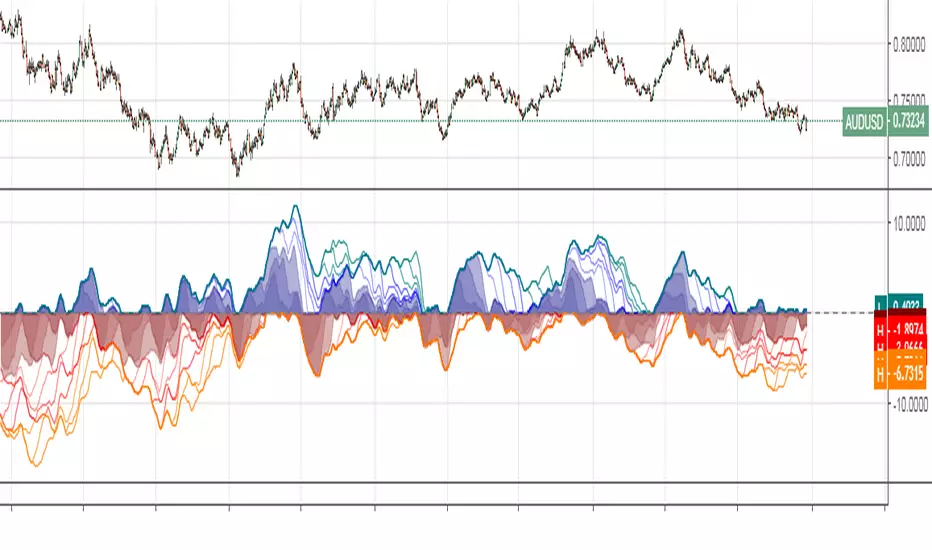
[RS]Extreme Diferential IndicatorMeasures price distance from extremes.
Ranging closer to 0 means topping/bottoming (this can stay in this state for a long time), (price near extreme).
Can be used to peak trend reversals(will need to keep doing tests with it)
EXPERIMENTAL --> Use at your own risk.
Gaussian Channel [DW]This study is an experiment utilizing the Ehlers Gaussian Filter technique combined with lag reduction techniques and true range to analyze trend activity.
Gaussian filters, as Ehlers explains it, are simply exponential moving averages applied multiple times.
First, beta and alpha are calculated based on the sampling period and number of poles specified. The maximum number of poles available in this script is 9.
Next, the data being analyzed is given a truncation option for reduced lag, which can be enabled with "Reduced Lag Mode".
Then the alpha and source values are used to calculate the filter and filtered true range of the dataset.
Filtered true range with a specified multiplier is then added to and subtracted from the filter, generating a channel.
Lastly, a one pole filter with a N pole alpha is averaged with the filter to generate a faster filter, which can be enabled with "Fast Response Mode".
Custom bar colors are included.
Note: Both the sampling period and number of poles directly affect how much lag the indicator has, and how smooth the output is.
Larger inputs will result in smoother outputs with increased lag, and smaller inputs will have noisier outputs with reduced lag.
For the best results, I recommend not setting the sampling period any lower than the number of poles + 1. Going lower truncates the equation.
Volume Weighted Average Range Bands [DW]This is an experimental study designed to identify the underlying trend bias and volatility of an instrument over any custom interval TradingView supports.
First, reset points are established at points where the opening price of the interval changes.
Next, Volume Weighted Average Price (VWAP) is calculated. It is the cumulative sum of typical price times volume divided by the cumulative volume. The cumulation starts over upon each reset point.
After that, Volume Weighted Average Range (VWAR) is calculated. The formula structure is the same as VWAP, except using range rather than typical price.
Lastly, the bands are calculated by multiplying the VWAR by the specified multiplier (approximate Golden Ratio by default) and by 1 through 5, then adding to and subtracting from the VWAP.
Custom Bar Colors are included.

Laguerre Multi-Filter [DW]This is an experimental study designed to identify underlying price activity using a series of Laguerre Filters.
Two different modes are included within this script:
-Ribbon Mode - A ribbon of 18 Laguerre Filters with separate Gamma values is calculated.
-Band Mode - An average of the 18 filters generates the basis line. Then, Golden Mean ATR over the specified sampling period multiplied by 1 and 2 are added and subtracted to the basis line to generate the bands.
Multi-Timeframe functionality is included. You can choose any timeframe that TradingView supports as the basis resolution for the script.
Custom bar colors are included. Bar colors are based on the direction of any of the 18 filters, or the average filter's direction in Ribbon Mode. In Band Mode, the colors are based solely on the average filter's direction.
Hurst Exponent Market Phases [DW]This study is an experiment designed to identify market phases using changes in an approximate Hurst Exponent.
The exponent in this script is approximated using a simplified Rescaled Range method.
First, deviations are calculated for the specified period, then the specified period divided by 2, 4, 8, and 16.
Next, sums are taken of the deviations of each period, and the difference between the maximum and minimum sum gives the widest spread.
The rescaled range is calculated by dividing the widest spread by the standard deviation of price over the specified period.
The Hurst Exponent is then approximated by dividing log(rescaled range) by log(n).
The theory is that a system is persistent when the Hurst Exponent value is above 0.5, and antipersistent when the value is below 0.5.
The color scheme indicates 4 different phases I found to be significant in this formula:
- Stabilization Phase
- Destabilization Phase
- Chaos Increase Phase
- Chaos Decrease Phase
This script includes two visualization types to choose from:
- Bar Counter Mode, which displays the number of bars the exponent is consecutively in each phase.
- Hurst Approximation Mode, which displays the approximated exponent value.
Custom bar colors are included.
Please note: This is a rough estimate of the Hurst Exponent. It is not the actual exponent. Numerous approximations exist, and their results all differ slightly.

Fractal Regression Bands [DW]This study is an experimental regression curve built around fractal and ATR calculations.
First, Williams Fractals are calculated, and used as anchoring points.
Next, high anchor points are connected to negative sloping lines, and low anchor points to positive sloping lines. The slope is a specified percentage of the current ATR over the sampling period.
The median between the positive and negative sloping lines is then calculated, then the best fit line (linear regression) of the median is calculated to generate the basis line.
Lastly, a Golden Mean ATR is taken of price over the sampling period and multiplied by 1/2, 1, 2, and 3. The results are added and subtracted from the basis line to generate the bands.
Williams Fractals are included in the plots. The color scheme indicated whether each fractal is engulfing or non-engulfing.
Custom bar color scheme is included.

Squeeze Box [DW]This is an experimental study designed using data from Bollinger Bands to determine price squeeze ranges and active levels of support and resistance.
First, a set of Bollinger Bands using a Coefficient of Variation weighted moving average as the basis is calculated.
Then, the relative percentage of current bandwidth to maximum bandwidth over the specified sampling period determines the relative squeeze.
The box is outlined by drawing the current highest and lowest source value over the sampling period whenever a squeeze is active.
I've included the COVWMA in the visualization for additional confirmation of price activity.
Custom Bar color scheme is included.

Hybrid Pivot Zones [DW]This is an experimental study designed to identify potential areas of support and resistance using a hybrid between Camarilla and Fibonacci pivot calculations.
The levels are calculated by taking 110% of the previous interval's range multiplied by 8.33%, 16.67%, 25%, 50%, 61.8%, 78.6%, 100%, 127.2%, 141.4%, and 161.8%, then adding them above and below the interval open.
Custom bar colors are included.

Donchian Channel Trend Intensity [DW]This is an experimental study designed to analyze trend intensity using two Donchian Channels.
The DCTI curve is calculated by comparing the differences between Donchian highs and lows over a major an minor period, and expressing them as a positive and negative percentage.
The curve is then smoothed with an exponential moving average to provide a signal line.
Custom bar colors included with two coloring methods to choose from.

Stratus [DW]This is an experimental study designed to identify trend activity, and potential support and resistance areas.
First, Coefficient of Variation Weighted Moving Average (COVWMA) is calculated, and its intersection points are used as anchor values.
Next, a fast period COVWMA calculated for a signal line.
For the cloud, its mid level is calculated first by taking the median of the range between price and the last anchor value.
The upper and lower cloud values are calculated by slicing the range in half two more times on each side. The result looks similar to stratus clouds, hence the name.
Finally, the result is offset by half of the specified period.
Custom bar colors are included.

Stochastic Weighted Moving Averages [DW]This is an experimental study derived from George Lane's Stochastic Oscillator.
The %KWMA is calculated by taking a moving average of source with a %K weighting factor over its specified period.
The %DWMA is calculated by taking a simple moving average of %KWMA over its specified period.
Custom bar color scheme included.
Moving Average Range Channels [DW]This study is an experiment based off the concept used in my Dynamic Range Channel indicator.
Rather than using a McGinley Dynamic, a moving average of your choice is used in this calculation.
There are eight different moving average types to choose from in this script:
- Kaufman's Adaptive Moving Average
- Geometric Moving Average
- Hull Moving Average
- Volume Weighted Moving Average
- Least Squares Moving Average
- Arnaud Legoux Moving Average
- Exponential Moving Average
- Simple Moving Average
For a more refined picture of volatility, I've added upper and lower extension channels. They are calculated by adding the upper half range to the channel high, and subtracting the lower half range from the channel low.
The new custom bar color scheme indicates trends, midline crosses, MA crosses, and overbought and oversold conditions.

Volume Weighted Average Divergence [DW]This is an experimental study inspired by the volume weighted moving average convergence divergence (VWMACD) concept.
In this formula, divergences between two volume weighted moving averages and two simple moving averages over their respective lookback periods are calculated.
The difference between the divergences is calculated, then the difference between the result and an exponential moving average of the result are calculated to provide a histogram.
Finally, the mean value between the two divergences is calculated to provide the VWAD line.
Custom bar colors are also included.

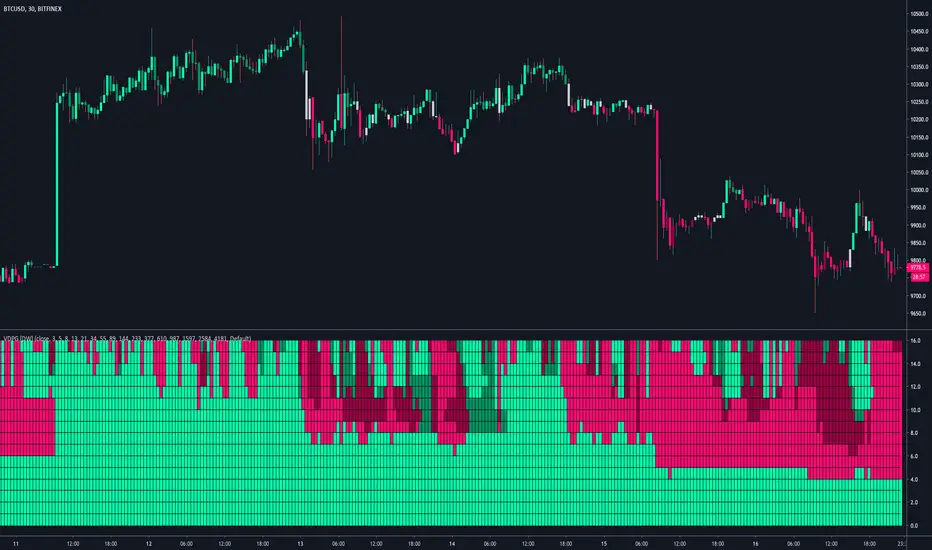
Volume Divergence Polarity Grid [DW]This study is an experiment built off the framework of my Dual Volume Divergence Index indicator.
It is designed to gauge polarity over multiple lookback periods of your choice by expressing the data as a two color grid.
Positive Volume Divergence and Negative Volume Divergence are calculated, and their relative values are used to gauge polarity.
The order of the grid is top to bottom - the top is the first lookback period, and the bottom is the last.