Distance from 50 SMA in ADR TermsIndicator produces a multiple of ADR% from the 50-day simple moving average to determine is a stock or etf is extended.
Extensions
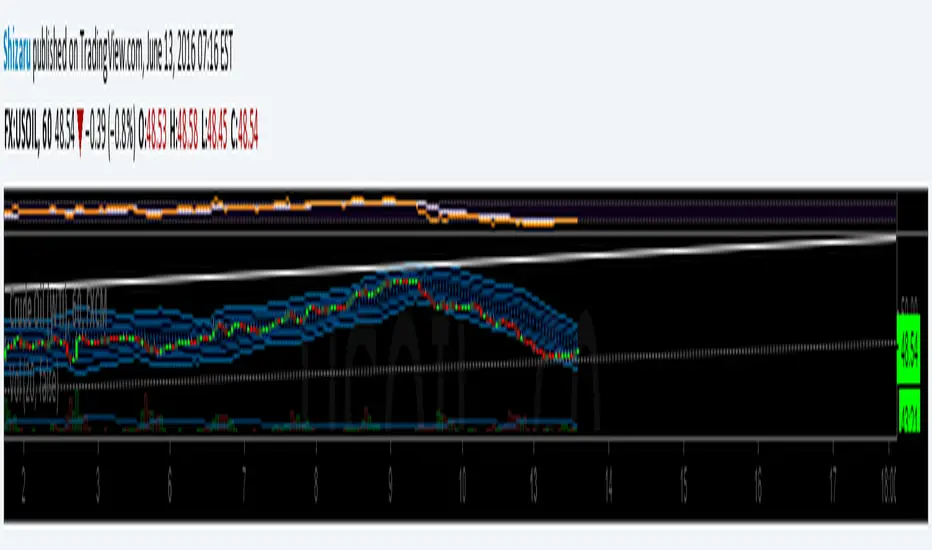
Support/Resistance Zones x3Support and Resistance Levels + Zones for 3 time frames, based on volume at fractal levels with Zones based on wick size which is a true reflection of a Zone when compared to other S/R Zone scripts which only use a thick line not based on anything.
Original script is thanks to synapticex I have just migrated to version 3, heavily modified it and added Support and Resistance Zones.

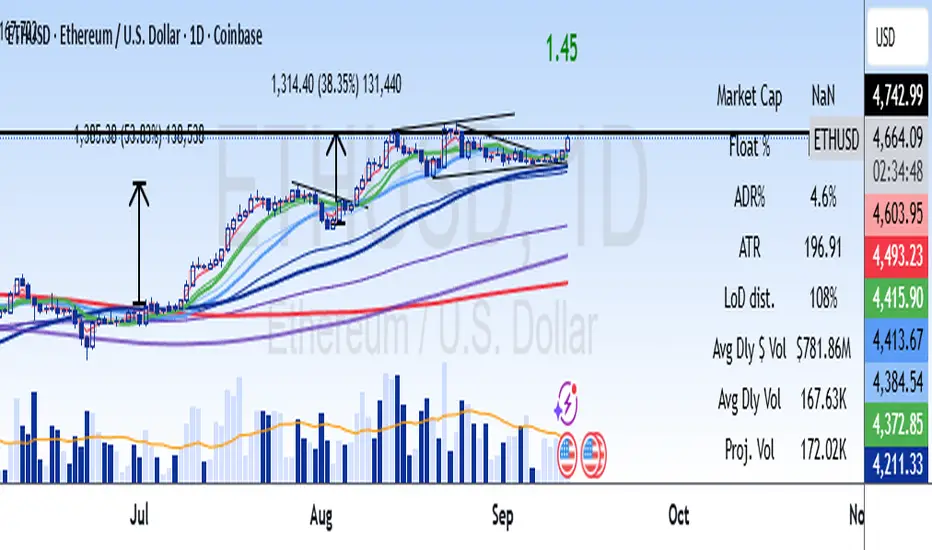
Bollinger Bands Fibonacci ratiosThe Fibonacci Bollinger Bands indicator is based on the same principles as the standard Bollinger Bands indicator developed by John Bollinger. The Fibonacci Bollinger Bands indicator bases its upper and lower bands on volatility just like the Bollinger Bands indicator does, but instead of using standard deviation as the measure of volatility, a Wilders Smoothed ATR is used in its place.
The middle band is a moving average used to establish the intermediate-term trend. The 3 upper bands are constructed by using the Wilders Smoothed ATR and multiplying it by each of the Fibonacci factors (1.618, 2.618, and 4.236) and then adding the results to the middle band. The 3 lower bands are constructed in the same manner as the upper bands except their results are subtracted from the middle band.