5 Layer Script FVG P3 Identifier Package True vs FalseThis script is a Fair Value Gap (FVG) identification framework designed to highlight price inefficiencies created by displacement, not to predict reversals or force entries. The script automatically detects and plots true three candle fair value gaps, allowing traders to objectively identify areas where price moved with imbalance and may later seek re-equilibration. Where you will see the FVG will update from a regular fvg to a True FVG.
How it works
-Identifies valid FVGs based on price displacement, not arbitrary candle size
-Plots FVG zones only after they are fully formed and confirmed
-Zones remain on the chart until price interacts with them
-No repainting once an FVG is printed
How to use it
-Use FVGs as areas of interest, not entry signals
-Best applied when price is returning after expansion
-Combine with: Higher-timeframe bias and Midpoint equilibrium levels
-Market structure shifts
-Liquidity sweeps or session timing
Entries should be taken only after confirmation (reaction, rejection, or shift)
This can be a good entry tool.
Fairvaluegaps

Smart Money Confluence Heatmap [PhenLabs]📊 Smart Money Confluence Heatmap
Version: Pine Script™ v6
📌 Description
The Smart Money Confluence Heatmap is a professional‑grade Smart Money Concepts indicator designed to identify high‑probability institutional trading zones. It merges multiple advanced market factors into a single confluence score, allowing traders to focus only on areas that matter. By synthesizing Fair Value Gaps, Order Blocks, Liquidity Sweeps, Volume Strength, and Market Structure, this script removes subjective bias and replaces it with data‑driven confirmation.
🚀 Points of Innovation
Unified confluence scoring system combining five institutional concepts
Adaptive ATR‑based zone sizing for volatility‑adjusted precision
Automatic trend and structure alignment scoring
Volume‑validated Order Blocks and Liquidity Sweeps
Probability‑ranked zones instead of static levels
🔧 Core Components
Fair Value Gap detection with imbalance strength scoring
Order Block identification confirmed by displacement and volume
Liquidity sweep analysis using wick depth and volume expansion
Volume strength modeling for accumulation and distribution phases
Market structure confirmation using BOS and directional bias
🔥 Key Features
Confluence heatmap zones graded by bullish and bearish probability
Minimum score filtering to remove low‑quality setups
Automatic risk‑to‑reward based TP and SL projections
Entry alerts when price taps validated institutional zones
🎨 Visualization
Color‑graded heatmap zones representing probability strength
Percentage score labels with component icons
On‑chart dashboard displaying market bias and structure state
✅ Best Use Cases
Liquidity sweep reversals at key structure levels
Trend‑aligned pullbacks into institutional zones
Intraday and swing trading using confluence confirmation
⚠️ Limitations
Not designed for low‑liquidity or extremely ranging markets
Confluence does not guarantee outcomes and requires risk management
💡 What Makes This Unique
Objective probability scoring instead of subjective SMC interpretation
Multi‑layer institutional confirmation in a single indicator
Built for traders who demand clarity, not chart clutter
💡 Note:
This indicator is for educational purposes only and should always be used alongside proper risk management and higher‑timeframe context.

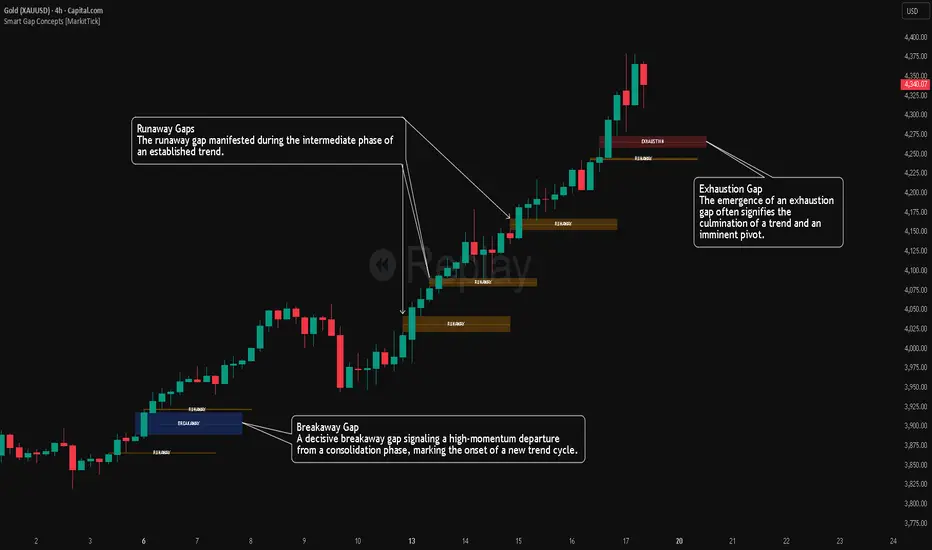
Smart Gap Concepts [MarkitTick]💡 This indicator automates the identification and classification of price gaps, commonly known as Fair Value Gaps (FVG) or Imbalances, by integrating market structure and volume analysis. Unlike standard gap detectors that simply highlight empty space on a chart, this script applies algorithmic filters to categorize gaps into three distinct phases of market movement: Breakaway, Runaway, and Exhaustion. This helps traders understand the potential context of a move rather than just seeing a support or resistance zone.
● Originality and Utility
The primary innovation of this tool is its dynamic classification system. It moves beyond visual detection by checking the "why" behind the gap. By referencing Swing Highs and Swing Lows (Market Structure) alongside Volume efficiency, it determines if a gap represents a breakout, a trend continuation, or a climatic end to a move. Additionally, the script features an automated mitigation tracking system that removes gaps from the chart once price has re-tested the midpoint, ensuring the visual workspace remains clean and relevant to current price action.
● Methodology
The script operates on a multi-stage logic engine:
• Gap Detection
It first identifies the core imbalance where the Low of the current bar does not overlap with the High of the bar two periods prior (for bullish gaps), ensuring the intervening candle represents a strong displacement.
• Structural Analysis (Breakaway Gaps)
The script monitors Pivot Highs and Lows. If a gap occurs simultaneously with a close beyond a key structural Pivot, it is classified as a "Breakaway Gap." This signals the potential start of a new trend.
• Volume and Time Analysis (Exhaustion Gaps)
To identify potential reversals, the script looks for "Trend Maturity." If a gap forms after a long duration since the last pivot and is accompanied by a volume spike (defined by the Volume Spike Multiplier), it is labeled as an "Exhaustion Gap."
• Continuation (Runaway Gaps)
If a gap is valid but meets neither the Breakaway nor Exhaustion criteria, it is considered a "Runaway Gap," typically found in the middle of an established trend.
• Dynamic Cleanup
The script tracks the midpoint of every active gap. If price creates a lower low (for bullish gaps) or higher high (for bearish gaps) beyond this midpoint, the gap is considered mitigated and is removed from the screen.
📖 How to Use
Traders can utilize the color-coded classifications to gauge market intent:
Breakaway (Default Blue): Watch these zones for potential trend initiations. These are often high-probability areas for a retest entry after a structure break.
Runaway (Default Orange): These indicate strong momentum. They can be used to trail stop-losses or add to winning positions, as price should ideally not close below these gaps in a healthy trend.
Exhaustion (Default Red): Be cautious when these appear. They suggest the current move is overextended and a reversal or complex pullback may be imminent.
• Exhaustion Gap : A Practical Case Study
• Breakaway Gap: A Practical Case Study
• Runaway Gap : A Practical Case Study
⚙️ Inputs and Settings
Min Gap Size (Points): Filters out insignificant gaps smaller than this threshold.
Structure Lookback: Defines the sensitivity of the Pivot detection (Swing High/Low).
Volume Avg Length & Multiplier: Determines what qualifies as a "Volume Spike" for exhaustion logic.
Trend Maturity: The minimum number of bars required to consider a trend "old" enough for an exhaustion signal.
Visual Settings: Custom colors for each gap type and box extension length.
● Disclaimer
All provided scripts and indicators are strictly for educational exploration and must not be interpreted as financial advice or a recommendation to execute trades. I expressly disclaim all liability for any financial losses or damages that may result, directly or indirectly, from the reliance on or application of these tools. Market participation carries inherent risk where past performance never guarantees future returns, leaving all investment decisions and due diligence solely at your own discretion.
Fair Value Gap [Tradeuminati]Fair Value Gap
Fair Value Gap is a clean and rule-based Fair Value Gap indicator for TradingView, designed to display only valid and confirmed Fair Value Gaps (FVGs) and Inverted Fair Value Gaps (iFVGs).
The indicator is built on a strict 3-candle FVG definition and operates exclusively on candle close, ensuring no repainting and no premature signals.
🔹 Key Features
Valid Fair Value Gaps (FVG)
- Detects bullish and bearish Fair Value Gaps using a precise 3-candle structure
- FVGs are only plotted after the confirming candle has closed
- A Fair Value Gap remains visible only as long as it is valid
- Once price closes beyond the FVG, it is removed or converted
Inverted Fair Value Gaps (iFVG)
- When a valid FVG is invalidated by a candle close, it can be converted into an iFVG
- iFVGs retain the original price range and structure
- Only valid iFVGs are displayed
- As soon as price closes through an iFVG, it is automatically removed
Clean & Controlled Visualization
- Only the last N active FVGs are displayed (bullish + bearish combined)
- Only the last N valid iFVGs are shown
- Boxes automatically extend to the current price + configurable bars
- Labels are dynamically positioned at the right edge of each zone
🔹 Technical Notes
- No repainting
- No intrabar signals
- Close-based validation only
- Works on all markets and timeframes
- Lightweight and performance-friendly
⚠️ Disclaimer
This indicator is for technical analysis purposes only and does not constitute trading or investment advice.

FairValueGap [Tradeuminati]Tradeuminati – (i)FVG is a free Fair Value Gap indicator for TradingView, built on a precise 3-candle structure and extended with Inverted Fair Value Gaps (iFVG) and an optional structure-based trend overview.
The indicator focuses exclusively on confirmed market structure, avoiding repainting and intrabar signals.
🔹 Features Overview
Fair Value Gaps (FVG)
- Detection of bullish and bearish Fair Value Gaps using a 3-candle formation
- FVGs are only displayed after the confirming candle has closed
- A Fair Value Gap remains valid until it is invalidated by a candle close
- Fully customizable colors, labels, and right-side extension
Trend Detection (Optional)
- Structure-based trend analysis on the 15-minute and 1-hour timeframes
- Trend is defined using Swing Highs and Swing Lows:
--> Higher Highs + Higher Lows → Uptrend
--> Lower Highs + Lower Lows → Downtrend
- Swing definition: center candle with X candles to the left and right (default: 1, fully adjustable)
- Trend is displayed in a compact trend table in the top-right corner
- Visual trend representation:
▲ Green = Uptrend
▼ Red = Downtrend
– Neutral / not yet confirmed
- Trend table can be enabled or disabled via settings
🔹 Technical Characteristics
- No repainting
- No intrabar signals
- Only confirmed candle closes are used
- Works on all markets and all timeframes
- Lightweight and performance-friendly
🔹 Use Case
This indicator is designed for traders who work with Price Action, Smart Money Concepts, market structure, or liquidity-based trading models, and who require a clear and reliable visualization of Fair Value Gaps and market trend.
⚠️ Disclaimer
This indicator does not provide trading or investment advice.
It is intended solely for technical chart analysis and decision support.

Mawhoob (OBs & FVGs) - v1.1Mawhoob (OBs & FVGs) - v1.1
Professional Market Structure Indicator
----------------------------------------------------
🎯 Overview
----------------------------------------------------
Mawhoob (OBs & FVGs) - v1.1 is a comprehensive technical analysis indicator designed to identify and track two of the most powerful concepts in modern price action trading: Order Blocks (OBs) and Fair Value Gaps (FVGs). This indicator provides traders with automated detection, visualization, and real-time alerts for these key market structure elements, helping you identify high-probability trading zones and potential reversal areas.
----------------------------------------------------
🔍 What Are Order Blocks and Fair Value Gaps?
----------------------------------------------------
✅ Order Blocks (OBs)
Order Blocks represent areas where institutional players have placed significant orders, creating imbalances in supply and demand. These zones often act as strong support or resistance levels where price tends to react when revisited.
* Bullish Order Block (OB+): Forms when a bearish candle is immediately followed by a strong bullish candle that closes above the previous candle's high, indicating institutional buying interest.
* Bearish Order Block (OB-): Forms when a bullish candle is immediately followed by a strong bearish candle that closes below the previous candle's low, indicating institutional selling pressure.
✅ Fair Value Gaps (FVGs)
Fair Value Gaps are price inefficiencies that occur when the market moves too quickly, leaving unfilled price ranges. These gaps often get "filled" or "mitigated" as price returns to seek liquidity and balance.
* Bullish Fair Value Gap (FVG+): Forms when there's a gap between the high of two candles ago and the low of the current candle in an upward move.
* Bearish Fair Value Gap (FVG-): Forms when there's a gap between the low of two candles ago and the high of the current candle in a downward move.
----------------------------------------------------
✨ Key Features ✨
----------------------------------------------------
✅ Order Blocks (OBs) Module:
Detection & Visualization
Automatic OB Detection: Identifies both bullish and bearish order blocks in real-time.
Customizable Display: Show up to 50 order blocks simultaneously.
Visual Distinction: Separate color schemes for bullish and bearish order blocks.
Smart Labeling: Optional OB+/OB- labels for easy identification.
Advanced Filtering Options
Strong OBs Filter: Option to display only "super/strong" order blocks.
FVG Confirmation Filter: Show only order blocks that are immediately followed by fair value gaps for higher confluence.
Flexible Filtering: Use filters independently or combine them for maximum selectivity
Mitigation Tracking
Real-time Monitoring: Automatically tracks when order blocks are "filled" or mitigated by price.
Display Control: Choose whether to show or hide filled order blocks.
Customization Options
Color Settings: Fully customizable colors for bullish/bearish order block zones.
Transparency Control: Adjustable box background transparency.
Border Styles: Choose between Solid, Dashed, or Dotted borders.
Extension Options: Extend boxes to the right or stop at mitigation point.
Label Size: Select from Auto, Tiny, Small, Normal, or Large label sizes.
✅ Fair Value Gaps (FVGs) Module:
Detection & Visualization
Automatic FVG Detection: Identifies both bullish and bearish fair value gaps.
Customizable Display: Show up to 50 FVGs simultaneously.
Visual Distinction: Separate color schemes for bullish and bearish gaps.
Smart Labeling: Optional FVG+/FVG- labels for clarity.
Advanced Filtering Options
Strong FVGs Filter: Display only significant gaps formed by strong candles.
OB Confirmation Filter: Show only FVGs that follow order blocks for enhanced reliability.
Independent Settings: Completely separate filtering from order block module.
Mitigation Tracking
Gap Fill Detection: Automatically detects when price fills the fair value gap.
Visual Updates: Filled gaps change appearance to indicate completion.
Display Options: Control visibility of filled versus unfilled gaps.
Customization Options
Full Color Control: Independent color settings for bullish/bearish FVGs.
Transparency Management: Adjustable transparency levels.
Border Customization: Multiple border style options.
Extension Control: Choose how gaps extend on the chart.
Label Customization: Adjustable label sizes and colors.
----------------------------------------------------
🔔 Alerts & Signals
----------------------------------------------------
Alerts System
Real-time Notifications: Receive instant alerts when new OBs or FVGs are detected.
Separate Alert Channels: Independent alerts for order blocks and fair value gaps.
Price Information: Each alert includes the current price level.
Frequency Control: Alerts trigger once per bar to avoid spam.
Visual Signals
On-Chart Markers: Optional visual signals (circles/diamonds) at detection points.
Color-Coded: Bullish signals below bars, bearish signals above bars.
Toggle Control: Enable/disable signals independently from alerts.
----------------------------------------------------
📋 How to Use This Indicator?
----------------------------------------------------
For Trend Following
Look for Bullish OBs and FVGs in uptrends as potential entry zones.
Look for Bearish OBs and FVGs in downtrends as potential entry zones.
Use unmitigated zones as key support/resistance levels.
For Reversal Trading
Watch for price reactions when approaching order blocks.
Combine multiple timeframe analysis for higher probability setups.
Use the "Strong" filters to focus on the most significant zones.
For Confluence Trading
Enable "Show Only (OBs) that Followed by (FVGs)" filter.
Enable "Show Only (FVGs) that Follow (OBs)" filter.
Trade only when both structures align for maximum confluence.
Risk Management
Monitor when zones become mitigated (filled).
Use multiple timeframes to identify nested zones.
Combine with your existing trading strategy for confirmation.
----------------------------------------------------
⚙️ Recommended Settings
----------------------------------------------------
For Scalping (1m - 5m timeframes)
Display: 15-20 boxes.
Enable: Strong filters.
Disable: Show mitigated zones.
For Day Trading (15m - 1H timeframes)
Display: 20-30 boxes.
Enable: Confluence filters when needed.
Enable: Show mitigated zones for context.
For Swing Trading (4H - Daily timeframes)
Display: 30-50 boxes.
Enable: All zones for comprehensive analysis.
Enable: Confluence filters when needed.
Enable: Show mitigated zones for context.
----------------------------------------------------
💡 Pro Tips
----------------------------------------------------
Multiple Timeframe Analysis: Use the indicator on multiple timeframes to identify nested order blocks and FVGs for stronger setups.
Confluence Zones: Areas where OBs and FVGs overlap often provide the highest probability trades.
Mitigation Matters: Pay attention to how quickly and cleanly zones are mitigated - clean mitigations often indicate institutional interest.
Filter Combinations: Experiment with different filter combinations to find what works best for your trading style.
Alert Management: Set up alerts for both OBs and FVGs to never miss potential setups.
----------------------------------------------------
⚠️ Important Notes
----------------------------------------------------
This indicator is for educational and informational purposes only.
Always confirm signals with your own analysis before trading.
Use proper risk management and position sizing.
The indicator works on all timeframes and instruments.
Past performance does not guarantee future results.
----------------------------------------------------
🔄 Updates & Support
----------------------------------------------------
Current Version: v1.1
This indicator is actively maintained and updated. Future versions may include additional features and improvements based on user feedback.
----------------------------------------------------
🙏 Acknowledgments
----------------------------------------------------
Created by @mawhoobx - Designed to help traders identify institutional footprints and market inefficiencies for better trading decisions.

SMC Academy [PhenLabs]📊 SMC Academy
Version: PineScript™ v6
📌 Description
The SMC Academy indicator is a comprehensive educational tool designed to demystify Smart Money Concepts (SMC) for traders of all levels. Unlike standard indicators that simply print signals, this script uses a “Learning Phase” system that allows users to toggle between individual concepts—such as Market Structure, Liquidity, Imbalances, and Order Blocks—or view them all simultaneously. It lets you focus on one piece of the puzzle at a time.
🚀 Points of Innovation
Progressive Learning Modes: Toggle between 5 distinct phases to master concepts individually before using the Full Strategy Mode.
Educational Tooltips: Hover over labels to read detailed explanations of why a BOS, MSS, or Liquidity zone was identified.
Smart Filtering: Uses ATR and Volume integration to filter out low-quality Fair Value Gaps and weak Order Blocks.
HTF Dashboard: A built-in panel analyzes Higher Timeframe (4H) data to ensure you are trading in alignment with the broader trend.
🔧 Core Components
Market Structure Engine: Automatically detects Swing Highs and Lows to map out market direction using configurable swing lengths.
Liquidity Manager: Identifies unmitigated swing points that serve as Buy-Side (BSL) and Sell-Side (SSL) liquidity magnets.
Imbalance Detector: Highlights Fair Value Gaps (FVG) where price inefficiencies exist, using ATR thresholds to ignore noise.
Order Block Identifier: Locates the specific candles responsible for structure breaks, validated by volume analysis.
🔥 Key Features
Break of Structure (BOS): Automatically marks trend continuation signals with solid lines and color-coded labels.
Market Structure Shift (MSS): Identifies potential trend reversals when significant swing points are breached.
Dashboard Context: Displays the current trend direction and the 4H context directly on your chart.
Custom Alerts: Built-in alert conditions for structure breaks and new Order Blocks allow for automated tracking.
🎨 Visualization
Structure Lines: Solid lines indicate confirmed breaks (Green for Bullish, Red for Bearish).
Liquidity Zones: Dotted lines extending rightward indicate resting liquidity levels that price may target.
FVG Boxes: Shaded boxes highlight imbalance zones, automatically extending for a user-defined number of bars.
Dashboard: A clean, non-intrusive table in the top-right corner displays trend status and active mode.
📖 Usage Guidelines
Setting Categories
Learning Mode: Select from ‘1. Market Structure’ through ‘5. Full Strategy Mode’ to filter what appears on the chart.
Swing Detection Length: Default (5). Determines the sensitivity of the swing high/low detection.
Structure Break Type: Options (Close/Wick). Choose whether a candle close or just a wick is required to confirm a break.
Min FVG Size: Default (0.5 ATR). Filters out gaps smaller than this multiplier to reduce noise.
Filter Weak OBs by Volume: Default (True). Only highlights Order Blocks where volume exceeds the 20-period average.
✅ Best Use Cases
Educational Study: Isolate “Phase 1: Market Structure” to practice identifying trend changes without distraction.
Trend Following: Use “Phase 3: Imbalances” to find entry points within an established trend.
Reversal Trading: Combine “Phase 2: Liquidity” and “Phase 4: Order Blocks” to catch reversals at key levels.
⚠️ Limitations
Subjectivity: Market structure can be interpreted differently depending on the swing length settings used.
Ranging Markets: Like all trend-following concepts, false BOS/MSS signals may generate during choppy, sideways price action.
Repainting: While the signals are non-repainting once confirmed, the live candle may flash a signal before the close if “Close” mode is selected.
💡 What Makes This Unique
Interactive Learning: The inclusion of tooltip explanations transforms this from a simple tool into an active mentor.
Phase-Based Workflow: The ability to strip the chart back to basics at the click of a button is unique to the PhenLabs ecosystem.
🔬 How It Works
Swing Analysis: The script calculates pivot highs and lows based on your length input to define the structural landscape.
Break Validation: It checks if price crosses these pivot points to trigger BOS (Continuation) or MSS (Reversal) logic.
Volume Confirmation: For Order Blocks, it looks back inside the swing leg to find the specific candle responsible for the move, verifying it has significant volume.
💡 Note:
For the best experience, start in Phase 1 to calibrate your Swing Detection Length to the specific volatility of the asset you are trading before enabling Full Strategy Mode.

SMC N-Gram Probability Matrix [PhenLabs]📊 SMC N-Gram Probability Matrix
Version: PineScript™ v6
📌 Description
The SMC N-Gram Probability Matrix applies computational linguistics methodology to Smart Money Concepts trading. By treating SMC patterns as a discrete “alphabet” and analyzing their sequential relationships through N-gram modeling, this indicator calculates the statistical probability of which pattern will appear next based on historical transitions.
Traditional SMC analysis is reactive—traders identify patterns after they form and then anticipate the next move. This indicator inverts that approach by building a transition probability matrix from up to 5,000 bars of pattern history, enabling traders to see which SMC formations most frequently follow their current market sequence.
The indicator detects and classifies 11 distinct SMC patterns including Fair Value Gaps, Order Blocks, Liquidity Sweeps, Break of Structure, and Change of Character in both bullish and bearish variants, then tracks how these patterns transition from one to another over time.
🚀 Points of Innovation
First indicator to apply N-gram sequence modeling from computational linguistics to SMC pattern analysis
Dynamic transition matrix rebuilds every 50 bars for adaptive probability calculations
Supports bigram (2), trigram (3), and quadgram (4) sequence lengths for varying analysis depth
Priority-based pattern classification ensures higher-significance patterns (CHoCH, BOS) take precedence
Configurable minimum occurrence threshold filters out statistically insignificant predictions
Real-time probability visualization with graphical confidence bars
🔧 Core Components
Pattern Alphabet System: 11 discrete SMC patterns encoded as integers for efficient matrix indexing and transition tracking
Swing Point Detection: Uses ta.pivothigh/pivotlow with configurable sensitivity for non-repainting structure identification
Transition Count Matrix: Flattened array storing occurrence counts for all possible pattern sequence transitions
Context Encoder: Converts N-gram pattern sequences into unique integer IDs for matrix lookup
Probability Calculator: Transforms raw transition counts into percentage probabilities for each possible next pattern
🔥 Key Features
Multi-Pattern SMC Detection: Simultaneously identifies FVGs, Order Blocks, Liquidity Sweeps, BOS, and CHoCH formations
Adjustable N-Gram Length: Choose between 2-4 pattern sequences to balance specificity against sample size
Flexible Lookback Range: Analyze anywhere from 100 to 5,000 historical bars for matrix construction
Pattern Toggle Controls: Enable or disable individual SMC pattern types to customize analysis focus
Probability Threshold Filtering: Set minimum occurrence requirements to ensure prediction reliability
Alert Integration: Built-in alert conditions trigger when high-probability predictions emerge
🎨 Visualization
Probability Table: Displays current pattern, recent sequence, sample count, and top N predicted patterns with percentage probabilities
Graphical Probability Bars: Visual bar representation (█░) showing relative probability strength at a glance
Chart Pattern Markers: Color-coded labels placed directly on price bars identifying detected SMC formations
Pattern Short Codes: Compact notation (F+, F-, O+, O-, L↑, L↓, B+, B-, C+, C-) for quick pattern identification
Customizable Table Position: Place probability display in any corner of your chart
📖 Usage Guidelines
N-Gram Configuration
N-Gram Length: Default 2, Range 2-4. Lower values provide more samples but less specificity. Higher values capture complex sequences but require more historical data.
Matrix Lookback Bars: Default 500, Range 100-5000. More bars increase statistical significance but may include outdated market behavior.
Min Occurrences for Prediction: Default 2, Range 1-10. Higher values filter noise but may reduce prediction availability.
SMC Detection Settings
Swing Detection Length: Default 5, Range 2-20. Controls pivot sensitivity for structure analysis.
FVG Minimum Size: Default 0.1%, Range 0.01-2.0%. Filters insignificant gaps.
Order Block Lookback: Default 10, Range 3-30. Bars to search for OB formations.
Liquidity Sweep Threshold: Default 0.3%, Range 0.05-1.0%. Minimum wick extension beyond swing points.
Display Settings
Show Probability Table: Toggle the probability matrix display on/off.
Show Top N Probabilities: Default 5, Range 3-10. Number of predicted patterns to display.
Show SMC Markers: Toggle on-chart pattern labels.
✅ Best Use Cases
Anticipating continuation or reversal patterns after liquidity sweeps
Identifying high-probability BOS/CHoCH sequences for trend trading
Filtering FVG and Order Block signals based on historical follow-through rates
Building confluence by comparing predicted patterns with other technical analysis
Studying how SMC patterns typically sequence on specific instruments or timeframes
⚠️ Limitations
Predictions are based solely on historical pattern frequency and do not account for fundamental factors
Low sample counts produce unreliable probabilities—always check the Samples display
Market regime changes can invalidate historical transition patterns
The indicator requires sufficient historical data to build meaningful probability matrices
Pattern detection uses standardized parameters that may not capture all institutional activity
💡 What Makes This Unique
Linguistic Modeling Applied to Markets: Treats SMC patterns like words in a language, analyzing how they “flow” together
Quantified Pattern Relationships: Transforms subjective SMC analysis into objective probability percentages
Adaptive Learning: Matrix rebuilds periodically to incorporate recent pattern behavior
Comprehensive SMC Coverage: Tracks all major Smart Money Concepts in a unified probability framework
🔬 How It Works
1. Pattern Detection Phase
Each bar is analyzed for SMC formations using configurable detection parameters
A priority hierarchy assigns the most significant pattern when multiple detections occur
2. Sequence Encoding Phase
Detected patterns are stored in a rolling history buffer of recent classifications
The current N-gram context is encoded into a unique integer identifier
3. Matrix Construction Phase
Historical pattern sequences are iterated to count transition occurrences
Each context-to-next-pattern transition increments the appropriate matrix cell
4. Probability Calculation Phase
Current context ID retrieves corresponding transition counts from the matrix
Raw counts are converted to percentages based on total context occurrences
5. Visualization Phase
Probabilities are sorted and the top N predictions are displayed in the table
Chart markers identify the current detected pattern for visual reference
💡 Note:
This indicator performs best when used as a confluence tool alongside traditional SMC analysis. The probability predictions highlight statistically common pattern sequences but should not be used as standalone trading signals. Always verify predictions against price action context, higher timeframe structure, and your overall trading plan. Monitor the sample count to ensure predictions are based on adequate historical data.

Fair Value Gaps (Custom)Fair Value Gaps (FVG) - Custom
A comprehensive Fair Value Gap indicator designed for futures traders, offering multi-timeframe analysis with full customization of colors, opacity, and visual elements per timeframe.
What are Fair Value Gaps?
Fair Value Gaps (FVGs) are three-candle patterns where a gap exists between the high of the first candle and the low of the third candle (bullish) or between the low of the first candle and the high of the third candle (bearish). These imbalances often act as support/resistance zones where price tends to return.
Key Features
Multi-Timeframe Support
5 independent timeframe slots
View higher timeframe FVGs on lower timeframe charts
Each timeframe has its own color, opacity, label, and midline settings
Flexible Fill Methods
Any Touch — FVG filled when price touches the zone
Midpoint Reached — FVG filled when price reaches 50% of the zone
Wick Sweep — FVG filled when wick passes through entire zone
Body Beyond — FVG filled when candle body closes beyond the zone
Visual Customization
Per-timeframe color AND opacity control via color picker
Optional midline display per timeframe
Customizable labels with fill percentage display
Optional borders with style/width settings
Boxes can extend to chart edge or fixed bar length
Dashboard & Alerts
Real-time FVG count dashboard (Bull/Bear above/below price)
Alert conditions: Price enters FVG, Midline cross, New FVG formed, FVG filled
Recommended Settings for ES/NQ Futures
Min Gap Size: 8 ticks (2 points)
Fill Method: Body Beyond (most conservative)
Default Opacity: 10% (adjust per timeframe as needed)
Usage Tips
Use higher timeframe FVGs as key support/resistance zones
Watch for confluence when multiple timeframe FVGs overlap
Midline often acts as the first target/reaction point
Combine with other confluence factors (order blocks, volume, etc.)

FVG Buy/Sell [Multi-TF] by akshaykiriti1443The FVG Buy/Sell indicator is a precision trading tool designed for traders who operate with a clear directional bias. It excels at identifying high-probability entry points by detecting when price interacts with Fair Value Gaps (FVGs).
This indicator is built on a core principle: instead of predicting the market's direction, it provides the timing for an entry after you, the trader, have established your market bias. By automatically pinpointing bullish and bearish imbalances on both the current and a higher timeframe, it allows you to wait for the market to pull back to a key level and then provides a clear signal for execution.
The Core Strategy: Bias First, Entry Second
This indicator is most powerful when used as part of a two-step trading process. It is not a standalone signal generator; it is an entry confirmation tool.
Step 1: Determine Your Directional Bias
Before looking for any signals from this indicator, you must first have an opinion on the market's most likely direction. This bias should be derived from your primary analysis method, such as:
The Golden Rule:
If your bias is BULLISH, you will ONLY look for BUY signals generated by bullish (green/blue) FVGs. You will ignore all SELL signals.
If your bias is BEARISH, you will ONLY look for SELL signals generated by bearish (pink/orange) FVGs. You will ignore all BUY signals.
Step 2: Execute with the FVG Tap-In Signal
Once your bias is set, the indicator does the rest of the work. You simply wait for the price to pull back into an FVG zone that aligns with your bias and then wait for the confirmation arrow to appear.
A green up arrow confirms that price has tapped a bullish FVG and closed above it, signaling that support has held and it's a valid moment to enter a long position.
A red down arrow confirms that price has tapped a bearish FVG and closed below it, signaling that resistance has held and it's a valid moment to enter a short position.
How to Take a Trade (Step-by-Step Examples)
Example of a Bullish (Long) Trade Setup:
Establish Bias: Your primary analysis shows the market is in a clear uptrend. Your bias is Bullish. You are now only looking for buying opportunities.
Identify Zone: The indicator draws a bullish FVG (a green or blue box) during an impulsive up-move.
Wait for Pullback: Be patient and let the price retrace down into this FVG zone. Do not chase the price.
Confirmation Signal: A green UP arrow appears below a candle. This is your signal. It confirms that buyers have stepped in at the FVG level and defended it.
Entry: Enter a long (buy) position at the open of the candle immediately following the signal candle.
Stop Loss: Place your stop loss below the low of the signal candle or, for a safer stop, below the bottom of the FVG zone itself.
Take Profit: Target a previous high, a higher-timeframe resistance level, or use a risk-to-reward ratio like 1:2 or 1:3.
Example of a Bearish (Short) Trade Setup:
Establish Bias: Your primary analysis shows the market is breaking down into a downtrend. Your bias is Bearish. You are now only looking for selling opportunities.
Identify Zone: The indicator draws a bearish FVG (a pink or orange box) during an impulsive down-move.
Wait for Pullback: Patiently wait for the price to rally back up into this FVG zone.
Confirmation Signal: A red DOWN arrow appears above a candle. This is your confirmation that sellers have rejected the price at this level.
Entry: Enter a short (sell) position at the open of the next candle.
Stop Loss: Place your stop loss above the high of the signal candle or above the top of the FVG zone.
Take Profit: Target a previous low, a key support level, or the next major FVG below.
Features Explained in Detail
Multi-Timeframe (MTF) Analysis: HTF zones (dotted lines) carry more weight. A signal from a 4-hour FVG while you are on a 15-minute chart is significantly more powerful than a signal from a 15-minute FVG alone. Use HTF zones as major points of interest.
Confirmed Tap-In Logic: The arrow only appears after price has touched the zone and then closed outside of it in the expected direction. This built-in confirmation filters out wicks that simply pass through a zone without a real market reaction.
Dual Alert System:
Entry Alert ("Price has entered..."): This is a heads-up alert. It tells you to pay attention because price is now in your pre-defined zone of interest.
Tap-In Alert ("Confirmed tap-in..."): This is the execution alert. It signals that the conditions for a trade have been met according to the indicator's logic.
Fade on Tapped: When enabled, a zone will become transparent after a confirmed signal. This visually cleans up your chart, showing you which zones have already been tested and "mitigated."
Minimum FVG Size (Ticks): In volatile or ranging markets, many tiny, insignificant FVGs can form. Use this setting to filter out the noise. Increase the value to only display larger, more significant imbalances.
Disclaimer: Trading involves substantial risk. This indicator is a tool for analysis and should not be used as a sole reason to enter a trade. Always practice robust risk management and use this tool in conjunction with your own trading plan. Past performance is not indicative of future results.

Volumatic Fair Value Gaps [BigBeluga]🔵 OVERVIEW
The Volumatic Fair Value Gaps indicator detects and plots size-filtered Fair Value Gaps (FVGs) and immediately analyzes the bullish vs. bearish volume composition inside each gap. When an FVG forms, the tool samples volume from a 10× lower timeframe , splits it into Buy and Sell components, and overlays two compact bars whose percentages always sum to 100%. Each gap also shows its total traded volume . A live dashboard (top-right) summarizes how many bullish and bearish FVGs are currently active and their cumulative volumes—offering a quick read on directional participation and trend pressure.
🔵 CONCEPTS
FVGs (Fair Value Gaps) : Imbalance zones between three consecutive candles where price “skips” trading. The script plots bullish and bearish gaps and extends them until mitigated.
Size Filtering : Only significant gaps (by relative size percentile) are drawn, reducing noise and emphasizing meaningful imbalances.
// Gap Filters
float diff = close > open ? (low - high ) / low * 100 : (low - high) / high *100
float sizeFVG = diff / ta.percentile_nearest_rank(diff, 1000, 100) * 100
bool filterFVG = sizeFVG > 15
Volume Decomposition : For each FVG, the indicator inspects a 10× lower timeframe and aggregates volume of bullish vs. bearish candles inside the gap’s span.
100% Split Bars : Two inline bars per FVG display the % Bull and % Bear shares; their total is always 100%.
Total Gap Volume : A numeric label at the right edge of the FVG shows the total traded volume associated with that gap.
Mitigation Logic : Gaps are removed when price closes through (or touches via high/low—user-selectable) the opposite boundary.
Dashboard Summary : Counts and sums the active bullish/bearish FVGs and their total volumes to gauge directional dominance.
🔵 FEATURES
Bullish & Bearish FVG plotting with independent color controls and visibility toggles.
Adaptive size filter (percentile-based) to keep only impactful gaps.
Lower-TF volume sampling at 10× faster resolution for more granular Buy/Sell breakdown.
Per-FVG volume bars : two horizontal bars showing Bull % and Bear % (sum = 100%).
Per-FVG total volume label displayed at the right end of the gap’s body.
Mitigation source option : choose close or high/low for removing/invalidating gaps.
Overlap control : older overlapped gaps are cleaned to avoid clutter.
Auto-extension : active gaps extend right until mitigated.
Dashboard : shows count of bullish/bearish gaps on chart and cumulative volume totals for each side.
Performance safeguards : caps the number of active FVG boxes to maintain responsiveness.
🔵 HOW TO USE
Turn on/off FVG types : Enable Bullish FVG and/or Bearish FVG depending on your focus.
Tune the filter : The script already filters by relative size; if you need fewer (stronger) signals, increase the percentile threshold in code or reduce the number of displayed boxes.
Choose mitigation source :
close — stricter; gap is removed when a closing price crosses the boundary.
high/low — more sensitive; a wick through the boundary mitigates the gap.
Read the per-FVG bars :
A higher Bull % inside a bullish gap suggests constructive demand backing the imbalance.
A higher Bear % inside a bearish gap suggests supply is enforcing the imbalance.
Use total gap volume : Larger totals imply more meaningful interest at that imbalance; confluence with structure/HTF levels increases relevance.
Watch the dashboard : If bullish counts and cumulative volume exceed bearish, market pressure is likely skewed upward (and vice versa). Combine with trend tools or market structure for entries/exits.
Optional: hide volume bars : Disable Volume Bars when you want a cleaner FVG map while keeping total volume labels and the dashboard.
🔵 CONCLUSION
Volumatic Fair Value Gaps blends precise FVG detection with lower-timeframe volume analytics to show not only where imbalances exist but also who powers them. The per-gap Bull/Bear % bars, total volume labels, and the cumulative dashboard together provide a fast, high-signal read on directional participation. Use the tool to prioritize higher-quality gaps, align with trend bias, and time mitigations or continuations with greater confidence.

ICT Confirmed FVG Indicator ICT FVG Indicator (Confirmed by Swings)
Summary
This indicator is designed to identify high-probability Fair Value Gaps (FVGs) by confirming them with market structure. It filters out random imbalances and only highlights the FVGs that are created at the same time as a confirmed ICT Swing High or Swing Low.
The core principle is to connect price imbalances directly to significant shifts in market structure, providing a cleaner and more powerful signal.
What It Does
Identifies Swing Points: Automatically detects and draws confirmed swing highs (resistance) and swing lows (support) on your chart based on the settings you choose.
Finds Fair Value Gaps: It scans the chart for the classic 3-candle FVG pattern (also known as a BISI or SIBI).
Confirms FVGs with Swings: This is the most important feature. The indicator will only draw an FVG box if one of the three candles that created the FVG is also a confirmed swing point. This ensures you are only seeing imbalances that are directly related to a break in market structure.
Invalidates Old FVGs: To keep the chart clean, the indicator will automatically remove an FVG box after the price has fully passed through it a certain number of times (customizable in the settings).
Settings Explained
ICT Swings Settings
Left/Right Strength: Controls the sensitivity of the swing detection. Higher numbers require a more significant, obvious swing point to be confirmed. Lower numbers will identify more minor swings.
Max Swing Lines: Sets the maximum number of swing high and swing low lines to display on the chart at one time.
Swing High/Low Color: Customize the color of the swing point lines.
FVG Settings
Show Bullish/Bearish FVG: Use these checkboxes to turn the bullish (green) or bearish (red) FVG boxes on or off.
Bullish/Bearish FVG Color: Customize the color of the FVG boxes.
FVG Invalidation Threshold: This sets how many times the price can fully close on the other side of an FVG before the box is automatically removed.
Max Active FVGs to Show: Sets the maximum number of FVG boxes to keep on the chart to prevent clutter.
Key Features
High-Probability Signals: Filters out noise by focusing only on FVGs that are confirmed by a shift in market structure.
Clean Visuals: Automatically draws and removes swing lines and FVG boxes to keep your chart uncluttered.
Fully Customizable: Adjust the sensitivity of the swing detection and the appearance of the FVGs to fit your trading style.
Pure ICT Concepts: Built strictly on the principles of Inner Circle Trader for a method-consistent analysis.

FVG + IFVG Gap (ULTRA) by Aditya NejeThis Indicator shows Fair Value Gap and Inverse Fair Value gaps

[MAD] FVG with LTF-POC/TPOOverview
The Fair Value Gap (FVG) Detector is a precision tool designed to automatically identify, draw, and track market inefficiencies. These gaps, also known as imbalances, often act as powerful magnets for future price action.
This indicator handles the entire lifecycle of an FVG: from its creation and extension, to the moment it is first touched, and through its entire mitigation process. To add an even deeper layer of analysis, it can now optionally plot two types of micro-analysis lines for the middle candle of the FVG pattern: a volume-based Point of Control (LTF-POC) and a time-based Time Price Opportunity (LTF-TPO). These high-precision lines pinpoint the most significant price levels within the imbalance itself.
By providing a clean and objective visualization of these critical price zones, the FVG Detector gives traders a clear framework for spotting high-probability setups and understanding how the market returns to areas of inefficiency to become balanced once again.
█ How It Works
The indicator’s logic is built on precise detection, dynamic visualization, and intelligent state tracking to provide a comprehensive view of market imbalances.
⚪ The FVG Detection Engine
At its core, the indicator uses a classic three-candle pattern to identify FVGs. This mechanical definition removes all subjectivity:
Bullish FVG: A gap is identified when the high of the first candle is lower than the low of the third candle. The space between these two prices creates the bullish FVG.
Bearish FVG: A gap is identified when the low of the first candle is higher than the high of the third candle. The space between these two prices creates the bearish FVG.
⚪ Dynamic Drawing and Mitigation
Once an FVG is detected, the indicator automatically draws a colored box to represent the gap. This box is then managed through its entire lifecycle:
Extension: If enabled, the FVG box extends forward in time with each new candle, acting as a visible, forward-looking zone of interest.
Partial Mitigation Trigger: The moment price first "touches" the gap, the box changes color to signal that it is no longer a fresh, unmitigated zone. The statistics table counts this as a "Partially Mitigated" event.
Shrinking FVG: As price moves further into the gap, the colored box dynamically shrinks, providing a real-time visual of how much of the imbalance has been filled.
Historical Outline: An optional secondary outline box is drawn to preserve the FVG's original size. This outline stops extending when the FVG is first touched, leaving a permanent historical marker.
⚪ Optional LTF Analysis for Added Precision
The indicator can look "inside" the FVG's middle candle to find its most significant price levels.
LTF-POC (Volume-Based): Using data from a lower timeframe, it analyzes the volume profile of the FVG-creating candle to find the single price level from the lower-timeframe bar with the highest trading volume.
LTF-TPO (Time-Based): It also identifies the Time Price Opportunity by dividing the candle's price range into distinct "bins." The script counts how many lower-timeframe price ticks occurred in each bin, and the TPO line is drawn at the center of the busiest bin.
Visual Confluence: These are drawn as distinct horizontal lines (defaulting to orange for POC and yellow for TPO) that extend and are managed alongside the FVG's historical outline, serving as precise levels of interest within the broader FVG zone.
█ Why This Indicator is Different
While many traders can spot FVGs manually, this indicator offers a significant edge through the possibility of the lowertimeframe analysis and showing the syntetic TPO or POCs for the relevant candles.
⚪ Automated and Objective
The market moves fast, and manually drawing FVGs is impractical and prone to error. This tool automates the entire process.
Never Miss a Gap: The detector impartially scans every three-candle sequence, ensuring no FVG is missed.
No Subjectivity: The rules for detection, mitigation, and LTF analysis are based on fixed mathematical models, removing subjective judgment.
Multi-Timeframe Clarity: The indicator works flawlessly on any timeframe, allowing you to maintain a consistent view of market structure.
⚪ Visualizing Market Memory
This tool does more than just draw boxes; it tells a story. Watching a box change color and shrink provides a visual of market dynamics in action. The optional historical outlines and LTF analysis lines build a "map" on your chart, showing where significant reactions and high-liquidity zones occurred in the past, which provides invaluable context for future price movements.
█ How to Use
⚪ Identifying High-Probability Zones
The primary use of the FVG Detector is to identify high-probability zones where price may react.
Entries: Unmitigated (fresh) FVGs can serve as powerful entry zones. Traders may look for price to return to a bullish FVG to take a long position, or to a bearish FVG to take a short position.
Targets: An FVG in your path can also act as a logical profit target. For example, if you are in a long position, you might take profit as price fills a nearby bearish FVG above you.
⚪ Confluence and Confirmation
FVGs are most powerful when they align with other forms of technical analysis. Look for FVGs that have "confluence" with:
Market Structure: A bullish FVG found at a key support level or after a bullish break of structure is a higher-probability setup.
Order Blocks: An FVG that overlaps with a bullish or bearish order block creates a very potent point of interest.
Premium/Discount Zones: FVGs found deep in a premium (for shorts) or discount (for longs) area of a trading range often yield strong reactions.
The LTF Lines (POC & TPO): Use these lines as a source of internal confluence. While the FVG gives you a zone, the POC and TPO give you precise levels within that zone. The POC shows where the highest volume was traded, while the TPO shows where price spent the most time. Confluence between these two lines can signal an extremely strong level.
█ Settings
Max Number of FVGs to Display: Controls how many active FVGs are kept on the chart to prevent clutter and maintain performance.
Extend Unmitigated FVGs: When enabled, FVG boxes will extend to the right until price touches them.
Show Bullish/Bearish FVGs: Toggles the visibility of bullish or bearish FVGs.
Show FVG Labels: Toggles the visibility of the "FVG" text labels.
Keep Mitigated Outlines: If checked, the historical outline box (and its associated POC/TPO lines) will remain on the chart even after the FVG is completely filled.
Show Statistics: Toggles the visibility of the statistics table, which tracks total, partly mitigated, and fully mitigated FVGs.
Show LTF-TPO (Time-Based): Toggles the calculation and display of the Time Price Opportunity line.
Show LTF-POC (Volume-Based): Toggles the calculation and display of the Point of Control line.
Use Custom LTF for Analysis: Check this to manually select a timeframe for the POC/TPO calculation. If unchecked, the script auto-selects a lower timeframe.
Lower Timeframe: The specific lower timeframe to use when the "Custom LTF" box is checked.
Magnifier (Bars per Slice): Controls how the script auto-selects a lower timeframe (higher number = lower timeframe). Only active when "Custom LTF" is unchecked.
█ The Logic Explained
This indicator uses a clear, rules-based system based on mathematical and conditional principles.
The 3-Candle FVG Pattern
The detection engine precisely identifies FVGs by comparing the price extremes of a three-candle sequence. For a bullish FVG, it confirms that the high of the first candle is strictly below the low of the third candle. For a bearish FVG, the low of the first candle must be strictly above the high of the third. This leaves an objective, unfilled gap in the market.
The Mitigation and Shrinking Process
Once an FVG is created, the indicator monitors it on every subsequent bar. The moment a candle's price action enters the FVG's zone, it's flagged as "partially mitigated," and its color changes. The script then continues to track how far price pushes into the gap, dynamically shrinking the box to visually represent the remaining imbalance.
Lower-Timeframe (LTF) Analysis Explained
To add precision, the indicator performs a micro-analysis of the middle candle of the FVG pattern. This is achieved by mathematically deconstructing that single candle using data from a smaller timeframe.
The lower timeframe is determined either manually or automatically via the Magnifier. The Magnifier works by dividing the chart's current timeframe. For example, on a 60-minute chart, a Magnifier of 60 tells the indicator to perform its analysis using 1-minute data (60÷60=1).
Once the LTF data is obtained, two calculations are performed:
LTF Point of Control (Volume-Based): This method seeks the price of maximum commitment. The indicator analyzes the volume of every single lower-timeframe bar within the main candle and identifies the one bar with the highest trading volume. The closing price of that specific high-volume bar is designated as the POC.
LTF Time Price Opportunity (Time-Based): This method finds the price where the market spent the most time trading. The process is a form of price distribution analysis:
The total price range (high to low) of the main candle is measured.
This range is divided into 40 equal price zones, or "bins". For a candle with a $2 range, each bin would represent a price slice of 5 cents
The indicator then counts how many of the lower-timeframe closing prices fall within each of the 40 bins.
The TPO line is drawn at the midpoint of the single bin that contained the most prices, representing the "busiest" price level.
Time-Based Drawing for Accuracy
To ensure perfect alignment across all historical data and chart reloads, all drawings are anchored to the precise timestamp of the bar, not its sequential position on the chart. This robust method guarantees that all zones remain fixed and accurate regardless of how much historical data is loaded.
█ Disclaimer
Investors are fully responsible for any investment decisions they make.
Have fun trading :-)
Fair Value Gap MTF [by Oberlunar]Fair Value Gap MTF is a multi-timeframe indicator designed to detect and display Fair Value Gaps (FVGs) across up to five customizable timeframes. Fair Value Gaps are price inefficiencies—zones where the market moved too quickly, leaving unfilled areas between candles. These gaps are often used by traders as reference points for future price retracements, as they tend to be revisited or “mitigated” over time.
This indicator extends the traditional FVG concept by introducing dynamic multi-timeframe tracking. Each timeframe has its own visual layer, with distinct user-defined colors for bullish and bearish gaps. The script not only highlights newly formed FVGs but also updates them visually when they are touched by price. Mitigated FVGs are recolored in real time, and an optional setting allows the size of these zones to shrink progressively, reflecting only the remaining untested portion.
Labels at the center of each box display the originating timeframe, offering clear visual context. All calculations are properly aligned with the display chart, ensuring that each FVG is correctly projected into the current view, regardless of its timeframe of origin.
Fair Value Gaps often act as support or resistance levels. Bullish FVGs can serve as areas where price may find support, while bearish FVGs can signal potential resistance. When these zones are mitigated repeatedly, it typically reflects areas of institutional interest, liquidity pools, or zones of accumulation and distribution. Such behavior makes them particularly significant in breakout and reversal strategies.
— Oberlunar 👁️★
ICT Sensitive Key Levels [Mariinus]Indicator Overview – Inspired by ICT Concepts
This indicator is inspired by the teachings of Inner Circle Trader (ICT), whose philosophies and principles have greatly shaped the way I view price action. One of the most powerful lessons that stuck with me is his quote:
"All you need is OHLC."
Another fundamental concept that underpins this tool is the idea that:
"Price is constantly moving in cycles from Premium or Discount to Equilibrium, from Equilibrium to Discount to Premium."
With these core ideas in mind, this indicator was developed to help traders who are already using an ICT-based framework. In addition to plotting the standard OHLC levels, the ICT Sensitive Key Levels indicator also includes derived levels that provide deeper Market insight. These include the Equilibrium of the full candle range (High to Low) as well as the Equilibrium of the wicks – offering a more nuanced view of price balance and potential turning points, in line with ICT’s core concepts.
⚠️ Important Disclaimer:
This is not a standalone trading plan.
This is not a buy or sell signal generator.
Instead, this tool is designed to support traders who follow ICT principles by helping them identify higher-probability PD Arrays – the key zones where setups are more likely to occur. If your trading plan includes looking for specific PD Arrays and structural frameworks taught by ICT, then this indicator is a visual aid to refine and focus your attention on the areas where your framework has a higher probability of playing out.
🔁 Backtesting & Daily Preparation
In addition to improving your real-time analysis, this indicator is also a valuable tool for accelerated backtesting . Rather than manually drawing out levels, the indicator automatically provides them, allowing you to analyze past price action faster and more efficiently .
It’s also ideal for preparing your trading day . By loading the indicator before the session starts, you get a clear visual of key levels that may play a role in your strategy. And if you find the chart too cluttered with lines, simply copy the ones that matter to you, draw them manually, and then turn the indicator off to keep your chart clean while keeping your zones intact.
⚙️ Explanation of the Settings
You can combine up to 4 timeframes to monitor their respective levels while operating on a lower timeframe. For each timeframe, you can:
• Set a lookback period to control how far back you want to calculate levels.
• Choose to display or hide the levels of the current candle , which helps you monitor intra-candle ebbs and flows.
Each level (e.g., High, Low, Open, Close, Equilibrium) can be customized:
• Color
• Line style
• Line width
• To hide a level , simply set its opacity to zero.
You can also enable dividers to clearly mark the start and end of higher timeframe candles on your lower timeframe chart. These dividers are also fully customizable:
• Color
• Style
• Width
• And again, if you prefer a cleaner chart, you can set the opacity to zero to hide them completely.
This setup gives you full control over how much or how little visual data you want to see, aligning the tool with your personal trading workflow.
💡 Example Use Cases
These examples are for educational purposes only. This tool is not financial advice and should always be used in conjunction with your own trading plan—whether it involves Fair Value Gaps, Order Blocks, or a custom combination of ICT-based elements.
• Example 1: A 1H Bearish Fair Value Gap overlapping with the Equilibrium Key Level of the Previous Day's Range – a high-probability zone for reaction.
• Example 2: A 1H Bullish Fair Value Gap in Discount, overlapping with the Equilibrium of Two Days Ago, followed by a move into a 1H Bearish Order Block that coincides with the Previous Day’s Equilibrium.
• Example 3: The same 1H PD Arrays viewed from a 4H chart, alongside Weekly Price Levels – giving you a higher timeframe context that supports or invalidates lower timeframe setups.
• Example 4: A combination of two timeframes for added context. A 4H Bullish Fair Value Gap is nested inside the current Weekly Equilibrium Key Level . On the 15M chart , we observe a reaction that creates an Inversion Fair Value Gap , which aligns with the Equilibrium Key Level of the previous 4H candle .
This indicator doesn’t replace your trading plan—it enhances your ability to execute it. It’s a precision tool made for ICT traders who understand context, structure, and probability.

MTF FVG with Hit Counter HarmoniXTradeMain Purpose of the Indicator:
This indicator is designed to automatically identify Fair Value Gaps (FVG) across three different timeframes simultaneously. The primary goal is to display these key zones on the chart and provide detailed information about price interaction with these levels, enabling traders to make more informed decisions.
Key Features:
Multi-Timeframe FVG Identification:
By default, the indicator identifies and displays FVGs on the Weekly (W), Daily (D), and 4-Hour (240) timeframes.
Users can customize these timeframes in the settings to fit their preferences.
Detailed Hit Counter:
This indicator goes beyond simply showing FVGs; it accurately counts the number of times the price has touched each of the three key FVG levels:
Up: The top line of the FVG
Mid: The midline (equilibrium) of the FVG
Down: The bottom line of the FVG
This information is displayed in a clear label next to each FVG zone, helping traders assess the strength and validity of each level.
Extensive Customization:
Appearance: You can change the colors for bullish and bearish FVGs for each timeframe individually, modify the style of the main and mid lines, and adjust the label size.
Detection Logic: Users can define the minimum size of an FVG for detection based on a percentage or point value.
Mitigation Logic: Two methods are provided for FVG invalidation:
Percentage Mitigation: The FVG is considered mitigated after the price has penetrated it by a specific percentage (e.g., 50%).
Full Fill: The FVG remains valid until the price has completely filled the gap and closed beyond it.
Extend Lines Capability:
To prevent chart clutter and get a better view of future price action, you can extend the FVG lines and labels to the right by a specified number of bars, creating distance from the current candle.
How to Use This Indicator:
Identifying Support and Resistance Zones: FVG areas can act as strong support and resistance levels.
Confirming Entry Points: A price touch and reaction to one of the FVG levels (especially the midline) can be used as a confirmation for entering a trade.
Assessing Level Strength: The number of hits on each level (Up, Mid, Down) indicates which price point within the zone has been more attractive to the market. For example, repeated reactions to the top line of a bearish FVG might suggest strong selling pressure at that level.
Your Feedback for Improvement:
You are invited to use this indicator and share any suggestions, ideas for improvement, or reports of potential issues. Your feedback will be valuable for implementation in future versions.
FVG Detector by SZEMEK>>> DESCRIPTION IN ENGLISH
An advanced indicator for the TradingView platform designed to detect and visualize Fair Value Gaps (FVG) and Inversion Fair Value Gaps (iFVG) on charts.
Main Features:
1. FVG Detection:
- The script identifies both bullish and bearish Fair Value Gaps.
- Users can choose which types of FVG to display (Bullish, Bearish, both, or none).
2. FVG Visualization:
- Gaps are represented as rectangular boxes on the chart.
- The color and transparency of the boxes are configurable separately for bullish and bearish FVG.
- The option to add a frame to FVG boxes with separate color settings.
- FVG labels are available with configurable colors and sizes.
3. Dynamic Tracking of FVG Fill:
- The script monitors the extent to which each gap has been filled by subsequent price movements.
- The fill level is visualized using gray overlay on the original FVG box.
- The percentage fill is updated on the label.
4. Automatic Removal of FVG:
- The ability to set a percentage threshold (100%, 75%, 50%, or no removal) after which FVG is removed from the chart.
5. iFVG Detection:
- The script also identifies Inversion Fair Value Gaps (iFVG), which can be displayed as separate boxes.
- iFVG are available in bullish and bearish versions.
- Users can choose which types of iFVG to display (Bullish, Bearish, both, or none).
- iFVG can also have labels and frames.
6. Limitation of Checked Candles:
- Users can specify the maximum number of candles back that the script will analyze for FVG and iFVG.
- Alerts: The indicator allows setting alerts for detected iFVG, both bullish and bearish.
Advanced Features:
- Accurate calculation of FVG fill percentage, considering both wicks and candle bodies.
- Dynamic updating of FVG boxes and their labels in real-time.
- Flexible memory management through the removal of outdated or filled FVG.
- The ability to customize the appearance of iFVG, including colors, labels, and frames.
This script serves as an advanced tool for technical analysis, enabling traders to identify potential support and resistance areas based on the concept of Fair Value Gaps and their inverted versions.
>>> DESCRIPTION IN ENGLISH
Zaawansowany wskaźnik dla platformy TradingView, który służy do wykrywania i wizualizacji luk wartości godziwej (Fair Value Gaps, FVG) oraz odwróconych luk wartości godziwej (Inversion Fair Value Gaps, iFVG) na wykresie.
Główne cechy
1. Wykrywanie FVG:
- Skrypt identyfikuje zarówno bycze (Bullish), jak i niedźwiedzie (Bearish) luki wartości godziwej.
- Użytkownik może wybrać, które typy FVG mają być wyświetlane (Bullish, Bearish, oba lub żadne).
2. Wizualizacja FVG:
- Luki są przedstawiane jako prostokątne boxy na wykresie.
- Kolor i przezroczystość boxów są konfigurowalne osobno dla FVG byczych i niedźwiedzich.
- Możliwość dodania ramki do boxów FVG z osobnymi ustawieniami kolorów.
- Etykiety FVG są dostępne z konfigurowalnymi kolorami i rozmiarami.
3. Dynamiczne śledzenie wypełnienia FVG:
- Skrypt monitoruje, w jakim stopniu każda luka została wypełniona przez późniejsze ruchy ceny.
- Stopień wypełnienia jest wizualizowany za pomocą szarego koloru nakładanego na oryginalny box FVG.
- Procent wypełnienia jest aktualizowany na etykiecie.
4. Automatyczne usuwanie FVG:
- Możliwość ustawienia progu procentowego (100%, 75%, 50% lub brak usuwania), po którego przekroczeniu FVG jest usuwany z wykresu.
5. Wykrywanie iFVG:
- Skrypt dodatkowo identyfikuje odwrócone luki wartości godziwej (iFVG), które mogą być wyświetlane jako osobne boxy.
- iFVG są dostępne w wersji byczej i niedźwiedziej.
- Użytkownik może wybrać, które typy iFVG mają być wyświetlane (Bullish, Bearish, oba lub żadne).
- iFVG również mogą mieć etykiety i ramki.
6. Ograniczenie sprawdzanych świec:
- Użytkownik może określić maksymalną liczbę świec wstecz, które skrypt będzie analizował w poszukiwaniu FVG i iFVG.
- Alerty: Wskaźnik umożliwia ustawienie alertów dla wykrytych luk iFVG, zarówno bullish, jak i bearish.
Zaawansowane funkcje
- Dokładne obliczanie procentu wypełnienia FVG, uwzględniające zarówno knoty, jak i ciała świec.
- Dynamiczne aktualizowanie boxów FVG i ich etykiet w czasie rzeczywistym.
- Elastyczne zarządzanie pamięcią poprzez usuwanie nieaktualnych lub wypełnionych FVG.
- Możliwość dostosowania wyglądu iFVG, w tym kolorów, etykiet i ramki.
Skrypt ten stanowi zaawansowane narzędzie do analizy technicznej, umożliwiające traderom identyfikację potencjalnych obszarów wsparcia i oporu bazujących na koncepcji luk wartości godziwej i ich odwróconych wersjach.

Fair Value Gap FinderFunctionality
Detection of Fair Value Gaps:
A bullish Fair Value Gap (FVG Up) is identified when the low of two candles before the current bar (low ) is greater than the high of the current bar (high ).
A bearish Fair Value Gap (FVG Down) is identified when the high of two candles before the current bar (high ) is lower than the low of the current bar (low ).
Color Coding:
Bullish Fair Value Gaps are highlighted in green to indicate potential areas of support.
Bearish Fair Value Gaps are highlighted in red to indicate potential areas of resistance.
Visualization Using Rectangles:
If an FVG is detected, the script creates a rectangle spanning a fixed number of bars (right=bar_index+5) to visualize the price inefficiency.
The rectangle extends from the upper to the lower boundary of the gap and has a semi-transparent fill (bgcolor=color.new(color, 90)) for better readability.
Implementation Details
Variable Initialization: The script defines floating-point variables (fvgUpTop, fvgUpBottom, fvgDownTop, fvgDownBottom) to store the price levels of identified gaps.
Conditional Assignments: When an FVG is detected, the corresponding top and bottom boundaries are assigned to the respective variables.
Box Creation: The box.new function is used to draw a rectangle on the chart, marking the FVG zones for better visualization.

FVG | iSolani
Unveiling Market Inefficiencies with Precision
In fast-moving markets, spotting hidden opportunities often hinges on identifying imbalances between price and value. The FVG | iSolani indicator revolutionises this process by detecting Fair Value Gaps (FVGs) —zones where price action skips over "fair" valuation levels, creating potential retracement targets. Combining advanced filtering, dynamic visualisation, and automated management, this tool empowers traders to pinpoint high-probability setups with unprecedented clarity.
Core Methodology
The indicator employs a multi-layered approach to identify FVGs:
Three-Bar Gap Analysis: Bullish FVGs form when the current low exceeds the high of two bars prior, while bearish FVGs occur when the current high stays below the low of two bars back.
Volatility-Adjusted Filtering: Gaps are measured against a 100-bar standard deviation to exclude insignificant price jumps.
Volume Confirmation: Only gaps accompanied by above-average volume (relative to a 1-bar SMA) are validated, filtering out low-conviction moves.
Auto-Invalidation System: Continuously monitors price action to remove FVG zones once price closes within their range, maintaining chart cleanliness.
Breaking New Ground
This tool introduces three paradigm-shifting innovations:
Volume-Weighted Significance: Unlike traditional FVG detectors, it ties gap validity to volume spikes, emphasising institutional activity.
Adaptive Zone Management: Boxes automatically extend rightward (when enabled) and self-destruct when invalidated, eliminating manual cleanup.
Smart Color Encoding: Offers both monochrome (for multi-timeframe analysis) and standard bull/bear color schemes, with customisable transparency.
Engine Under the Hood
The script operates through four key processes:
Gap Detection: Scans every new bar for three-candle patterns meeting FVG criteria.
Statistical Filtering: Applies user-defined threshold (default: 1σ) to separate meaningful gaps from market noise.
Box Rendering: Draws semi-transparent zones between gap boundaries using TradingView's box objects, styled according to user preferences.
Array-Based Memory: Stores all active FVGs in arrays, enabling real-time validation checks against current price action.
Standard Configuration
Optimised default settings balance visibility and functionality:
Filter: 1.0 (1 standard deviation threshold)
Colors: "Mono" mode (gray boxes) with 90% transparency
Text Labels: Enabled in medium gray
Extension: Gaps extend indefinitely rightward
Borders: Dotted lines with visible outlines
Through its fusion of quantitative rigor and visual adaptability, the FVG | iSolani transforms raw price data into actionable intelligence. By focusing on volume-confirmed gaps and automating zone management, it cuts through market chaos to reveal structurally significant levels—a must-have for traders navigating breakouts, reversals, or order-flow analysis.

Fair Value Gap Oscillator | Flux Charts💎 GENERAL OVERVIEW
Introducing the new Fair Value Gap Oscillator (FVG Oscillator) indicator! This unique indicator identifies and tracks Fair Value Gaps (FVGs) in price action, presenting them in an oscillator format to reveal market momentum based on FVG strength. It highlights bullish and bearish FVGs while enabling traders to adjust detection sensitivity and apply volume and ATR-based filters for more precise setups. For more information about the process, check the "📌 HOW DOES IT WORK" section.
Features of the new FVG Oscillator:
Fully Customizable FVG Detection
An Oscillator Approach To FVGs
Divergence Markers For Potential Reversals
Alerts For Divergence Labels
Customizable Styling
📌 HOW DOES IT WORK?
Fair Value Gaps are price gaps within bars that indicate inefficiencies, often filled as the market retraces. The FVG Oscillator scans historical bars to identify these gaps, then filters them based on ATR or volume. Each FVG is marked as bullish or bearish according to the trend direction that preceded its formation.
An oscillator is calculated using recent FVGs with this formula :
1. The Oscillator starts as 0.
2. When a new FVG Appears, it contributes (FVG Width / ATR) to the oscillator of the corresponding type.
3. Each confirmed bar, the oscillator is recalculated as OSC = OSC * (1 - Decay Coefficient)
The oscillator aggregates and decays past FVGs, allowing recent FVG activity to dominate the signal. This approach emphasizes current market momentum, with oscillations moving bullish or bearish based on FVG intensity. Divergences are marked where FVG oscillations suggest potential reversals. Bullish Divergence conditions are as follows :
1. The current candlestick low must be the lowest of last 25 bars.
2. Net Oscillator (Shown in gray line by default) must be > 0.
3. The current Bullish FVG Oscillator value should be no more than 0.1 below the highest value from the last 25 bars.
Traders can use divergence signals to get an idea of potential reversals, and use the Net FVG Oscillator as a trend following marker.
🚩 UNIQUENESS
The Fair Value Gap Oscillator stands out by converting FVG activity into an oscillator format, providing a momentum-based visualization of FVGs that reveals market sentiment dynamically. Unlike traditional indicators that statically mark FVG zones, the oscillator decays older FVGs over time, showing only the most recent, relevant activity. This approach allows for real-time insight into market conditions and potential reversals based on oscillating FVG strength, making it both intuitive and powerful for momentum trading.
Another unique feature is the combination of customizable ATR and volume filters, letting traders adapt the indicator to match their strategy and market type. You can also set-up alerts for bullish & bearish divergences.
⚙️ SETTINGS
1. General Configuration
Decay Coefficient -> The decay coefficient for oscillators. Increasing this setting will result in oscillators giving the weight to recent FVGs, while decreasing it will distribute the weight equally to the past and recent FVGs.
2. Fair Value Gaps
Zone Invalidation -> Select between Wick & Close price for FVG Zone Invalidation.
Zone Filtering -> With "Average Range" selected, algorithm will find FVG zones in comparison with average range of last bars in the chart. With the "Volume Threshold" option, you may select a Volume Threshold % to spot FVGs with a larger total volume than average.
FVG Detection -> With the "Same Type" option, all 3 bars that formed the FVG should be the same type. (Bullish / Bearish). If the "All" option is selected, bar types may vary between Bullish / Bearish.
Detection Sensitivity -> You may select between Low, Normal or High FVG detection sensitivity. This will essentially determine the size of the spotted FVGs, with lower sensitivies resulting in spotting bigger FVGs, and higher sensitivies resulting in spotting all sizes of FVGs.
3. Style
Divergence Labels On -> You can switch divergence labels to show up on the chart or the oscillator plot.

FVG Order Blocks [BigBeluga]This indicator is an advanced tool designed to detect and visualize market FVGs with order blocks, where the price action has created gaps due to strong buying or selling pressure. These FVG often act as critical support and resistance levels, giving traders strategic points for potential entries and exits. The indicator not only identifies these imbalances but also displays their relative strength by size %, helping traders prioritize order blocks that are more likely to hold or break.
The indicator works on various pairs and stocks, it also works on charts that do not provide volume data
Forex (JPY/USD):
Stocks (NVDA):
🔵 KEY FEATURES & USAGE
● FVGs Detection and Visualization:
The indicator detects bullish and bearish FVGs. Bullish FVG occur when there is significant buying, and order block is plotted below the FVG zone:
Conversely, bearish FVG are plotted with an order block above the zone, indicating potential resistance.
Traders can use these order blocks to anticipate price reactions when the market revisits these areas, making them ideal for setting up trades.
● FVG Filtering:
The indicator includes a FVG % filter that allows traders to only display strong order blocks. This ensures that only significant FVG order blocks are shown, reducing noise and focusing on the most impactful areas.
● Highlighting Broken Levels:
When an imbalance level is broken—either breached by price action or no longer relevant—the indicator can either delete the level or mark it with a gray color areas. This provides a clear visual cue that the level has been compromised, allowing traders to adjust their strategies accordingly.
● Order Blocks Signals:
When price retest the blocks, indicator display potential sell or buy signals. Which can be an opportunity for trades
🔵 CUSTOMIZATION
● FVG Filter:
Adjust the strength filter to control which FVGs are displayed based on their percentage size. This filter helps in focusing only on significant blocks that are likely to impact price action.
● Order Blocks Amount Displayed:
Set the maximum number of Order Blocks to be displayed on the chart. This customization helps keep the chart clean and ensures that only the most important blocks are in view.
● Broken Order Blocks Display:
Choose whether to display order blocks that have been broken by the price. This feature helps in maintaining a focus on blocks that are still valid while filtering out those that are no longer relevant.
● Color Customization:
You can customize the colors for bullish and bearish Order Blocks to match your chart's overall color scheme. Additionally, strength bars can be color-coded based on their percentage to quickly identify high-priority order blocks.
Traders who are confident in the settings of the indicator can confidently use it on various types of markets
Double FVG-BPR [QuantVue]The Double FVG BPR Indicator is a versatile tool that helps traders identify potential support and resistance levels through the concept of balanced price ranges.
A Balanced Price Range (BPR) is a zone on a price chart where the market has found equilibrium after a period of price imbalance.
It is identified by detecting a Fair Value Gap (FVG) in one direction, followed by an overlapping Fair Value Gap in the opposite direction.
Components of a Balanced Price Range
Fair Value Gap (FVG): A FVG occurs when there is a rapid price movement, creating a gap in the price chart where minimal trading occurs. This gap represents an imbalance between supply and demand.
Bullish FVG: A bullish FVG is identified when the low of a candle is higher than the high of a candle two periods ago, and the close of the previous candle is higher than the high of that same period.
Bearish FVG: A bearish FVG is identified when the high of a candle is lower than the low of a candle two periods ago, and the close of the previous candle is lower than the low of that same period.
Overlapping Fair Value Gap: For a BPR to be formed, an initial FVG must be followed by an overlapping FVG in the opposite direction. This creates a balanced zone where the price has moved up (or down) quickly and then moved down (or up) with similar intensity, suggesting a temporary equilibrium.
The area between the high and low points of these overlapping FVGs forms the BPR. This zone represents a temporary market equilibrium where supply and demand have balanced out after a period of significant price movement in both directions.
How to Use
Support and Resistance Levels: The upper and lower boundaries of the BPR act as dynamic support and resistance levels. Traders can use these levels to place buy and sell orders, anticipating that the price may find support or face resistance within these zones.
Trend Reversal and Continuation: The BPR can signal potential trend reversals or continuations.
If the price moves back into the BPR after a breakout, it may indicate a reversal. Conversely, if the price breaks out of the BPR with strong momentum, it may signal a trend continuation.
