Fibonacci Sequence Circles [BigBeluga]🔵 Overview
The Fibonacci Sequence Circles is a unique and visually intuitive indicator designed for the TradingView platform. It combines the principles of the Fibonacci sequence with geometric circles to help traders identify potential support and resistance levels, as well as price expansion zones. The indicator dynamically anchors to key price points, such as pivot highs, pivot lows, or timeframe changes (daily, weekly, monthly), and generates Fibonacci-based circles around these anchor points.
⚠️For proper indicators visualization use simple not logarithmic chart
🔵 Key Features
Customizable Anchor Points : The indicator can be anchored to Pivot Highs , Pivot Lows , or timeframe changes ( Daily, Weekly, Monthly ), making it adaptable to various trading strategies.
Fibonacci Sequence Logic : The circles are generated using the Fibonacci sequence, where the diameter of each circle is the sum of the diameters of the two preceding circles.
first = start_val
secon = start_val + int(start_val/2)
three = first + secon
four = secon + three
five = three + four
six = four + five
seven = five + six
eight = six + seven
nine = seven + eight
ten = eight + nine
Adjustable Start Value : Traders can modify the starting value of the sequence to scale the circles larger or smaller, ensuring they fit the current price action.
Color Customization : Each circle can be individually enabled or disabled, and its color can be customized for better visual clarity.
Visual Labels : The diameter of each circle (in bars) is displayed next to the circle, providing additional context for analysis.
🔵 Usage
Step 1: Set the Anchor Point - Choose the anchor type ( Pivot High, Pivot Low, Daily, Weekly, Monthly ) to define the center of the Fibonacci circles.
Step 2: Adjust the Start Value - Modify the starting value of the Fibonacci sequence to scale the circles according to the price action.
Step 3: Customize Circle Colors - Enable or disable specific circles and adjust their colors for better visualization.
Step 4: Analyze Price Action - Use the circles to identify potential support/resistance levels, price expansion zones, or trend continuation areas.
Step 5: Combine with Other Tools - Enhance your analysis by combining the indicator with other technical tools like trendlines, moving averages, or volume indicators.
The Fibonacci Sequence Circles is a powerful and flexible tool for traders who rely on Fibonacci principles and geometric patterns. Its ability to anchor to key price points and dynamically scale based on market conditions makes it suitable for various trading styles and timeframes. Whether you're a day trader or a long-term investor, this indicator can help you visualize and anticipate price movements with greater precision.
Fibonnacci

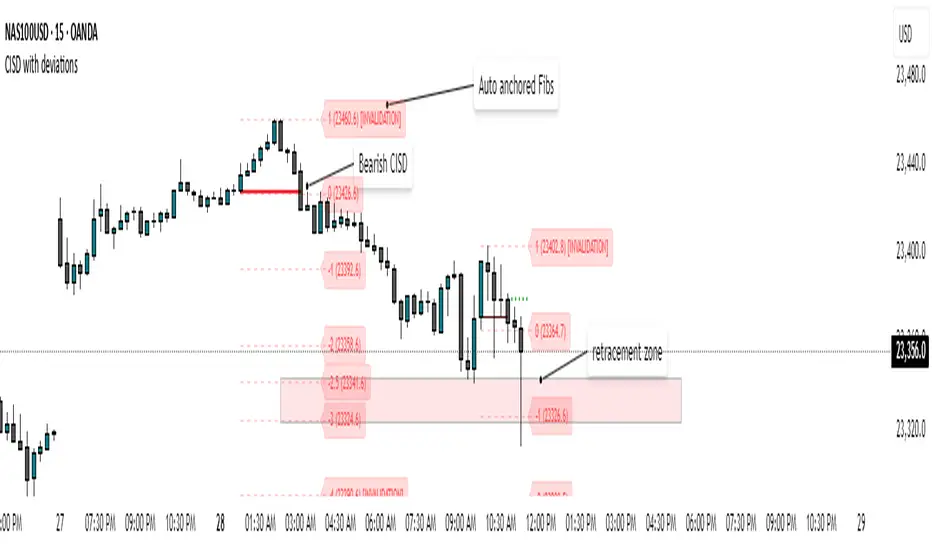
CISD with deviationsChange in State Delivery (CISD) is a well-recognized concept and serves as a key signal for identifying market direction through the behavior of CISD levels. In this approach, CISD is applied as the core measure of market structure, removing the variability that comes from user-defined interpretations.
How does it works :
Identifies CISD levels as the market delivers price.
Track whether price respects or violates these levels.
A confirmed shift (change in state) signals a potential transition in trend
Provides a clean structure map to guide execution
How to use it :
1)Align CISD shifts with your higher timeframe bias and the deviation levels marked by the indicator which often serve as the area for retracement or continuations.
2) Use CISD confirmation as a filter for trade entries.
3) Combine with liquidity pools, FVGs, or session timing for added confluence.
Features covered :
1) Automatic Bearish and Bullish CISD plotting.
2) Anchored Fibonacci levels are plotted based on the confirmed CISD. The Fibonacci levels are fixed and cannot be modified by the user because these levels serve a purpose.
3) Alerts can be set up by the users for whenever a bearish/bullish CISD is confirmed.
4) Automatic invalidations are set so that when price invalidates a CISD or hits the -4 level of a CISD as full target level, the CISD is automatically removed.
5) Currently , the maximum CISDs visible are limited to 3 each (bullish and bearish) to avoid cluttering on the chart.
AI Fib Strategy (Full Trade Plan)This indicator automatically plots Fibonacci retracements and a Golden Zone box (61.8%–65% retracement) based on the 4H candle body high/low.
Features:
Auto-detects session breaks or daily breaks (configurable).
Draws standard Fib retracement levels (0%, 23.6%, 38.2%, 50%, 61.8%, 78.6%, 100%).
Highlights the Golden Zone for high-probability trade entries.
Optional Take Profit extensions (TP1, TP2, TP3).
Fully compatible with Pine Script v6.
Usage:
Best applied on intraday charts (15m, 30m, 1H).
Use the Golden Zone for entry confirmations.
Combine with candlestick patterns, order blocks, or volume for stronger signals.

Fibonacci-Based Volume Flow (VFI)Fibonacci-based Volume Flow is an advanced next-generation evolution of LazyBear’s original VFI script that calculates and averages up to 21 Fibonacci-based VFI pairings to create a smoothed composite volume flow signal. This unique and powerful approach reduces noise, adapts to volatility, and provides a clearer view of trend strength and market structure across all timeframes. It also includes dynamic fibonacci guide levels, adaptive lookbacks, EMA crossovers, and structure-aware pivot labeling to help traders identify high-quality reversals, confirm directional bias, and detect divergences with greater precision. It's ideal for traders looking to enhance momentum analysis through volume-based confirmation.
🧠 Key Features🧠
🔹 Multi-VFI Fibonacci Fusion🔹
Blends up to 21 VFI signals (5, 13, 21, 34… up to 610) into smartly paired averages (e.g., 13/34, 55/144) — forming a smoothed composite VFI that’s more adaptive, less noisy, and highly responsive across market conditions.
🔸🔸 Dynamic Lookbacks🔸 🔸
Automatically adjusts histogram high/low tracking based on your chart’s timeframe — no more static tuning. Perfect for scalping fast charts or confirming long-term trends.
🟥🟩 Color-Coded Histogram🟥🟩
Visualizes VFI momentum with gradient coloring.
🧩🧩 Signal Crossovers 🧩🧩
Color-coded crossover lines persistently show bullish or bearish dominance.
Includes three powerful crossover systems:
➖5/13 VFI: Fast, early reversal detection
➖8/21 VFI: Swing-trading sweet spot
➖55/144 VFI: Trend confirmation across long cycles
🏷️ 🏷️Pivot Structure Labels🏷️🏷️
Labels oscillator swings with full structural logic:
➖HH, HL, LH, LL, EQ
➖Displays percent change, price at pivot, oscillator reading
➖Smart coloring detects divergence & trend continuation
📈 📈Dynamic Histogram Guides📈📈
Optional zero and ±50% bands anchor histogram levels based on real histogram extremes, not static thresholds — visually frame momentum shifts with context.
📍 📍Persistent High/Low Pivot Lines📍📍
Track the most significant histogram pivots (not price) across time, with smart labels:
➖Volume flow structure zones
➖Label shows price at pivot, oscillator level, and bars since event
➖Ideal for spotting divergence zones, momentum failures, and trend exhaustion.
🔍 🔍Volatility Table (ATR%)🔍🔍
💡Shows real-time volatility compression or expansion
💡Uses multiple ATR periods (e.g., 14 & 55) for short- and medium-term comparison
💡Helps traders understand whether momentum is likely to continue or stall
🔩🔩Volume-weighted VFI baselines🔩🔩
🟢A daily session-based VWAP of the VFI, which resets each day and highlights intraday volume flow context.
🟠A rolling VWA of VFI, which acts like a VWMA over a fixed window (e.g., 55 bars), smoothing short-term fluctuations and supporting trend/momentum confirmation.
These VWAP-style overlays help traders identify strength vs. weakness relative to volume-weighted baselines — useful for divergence spotting, mean reversion setups, or breakout confirmation.
🧰 🧰Under the Hood: How It Works🧰🧰
🔧 Core VFI Logic
Based on LazyBear’s foundational VFI:
➖Uses log returns of price (HLC3)
➖Filters insignificant moves using volatility-weighted thresholds
➖Normalizes volume via adaptive capping (e.g., 2.5× average)
🌀 Composite Blend System
Each VFI instance is smoothed and then fused via user-selectable pairs. This creates a customizable average VFI representing short, mid, and long-term pressure — one value, many time horizons.
📊 EMA Signal Layer
Crosses trigger persistent color shifts in signal lines, making trend strength clear at a glance.
VFI blend feeds into EMA crossovers. You can toggle visibility for:
➖Fast (5/13)
➖Medium (8/21)
➖Slow (55/144)
🧭 Pivot Framework
Structure logic only compares pivots on same-side polarity:
➖Highs compare to highs above zero
➖Lows compare to lows below zero
This avoids nonsensical comparisons and preserves logical sequences (HH → LH → HL).
🧱 Dynamic Labels
All pivots and persistent levels display:
➖Oscillator value
➖Price value
➖Structure tag (e.g., LH, HL)
➖% change from prior pivot
➖Lookback info
➖Bar age
Unlike traditional VFI:
✅ It blends timeframes with Fibonacci precision
✅ Uses dynamic, volatility-aware logic
✅ Embeds visual structure & divergence intelligence
✅ Enhances entry confidence and exit timing
🔧 This isn’t just an indicator — it’s a volume-informed decision engine.
Ideal For:
🔶Trend-followers wanting cleaner volume-based confirmation
🔶Reversal traders spotting structure + divergence
🔶Scalpers or investors needing adaptable signals
🔶Those who loved LazyBear's VFI
📌 Final Note:
As powerful as Fibonacci Blended Volume Flow is, no single indicator should be used in isolation. For best results, combine it with price action analysis, higher-timeframe context, and complementary tools like trendlines, moving averages, or support/resistance levels. Use it as part of a well-rounded trading approach to confirm setups — not to define them alone.

Silver BulletSilver Bullet is a trading tool built for finding cleaner, higher-probability setups. It focuses on key windows of market movement and adds helpful tools like daily range levels and candlestick patterns.
Whether you’re trading breakouts or reversals, Silver Bullet gives you a clearer view of the market and more confidence in your setups.
⸻
🔹 Trading Setup #1: Macro Time
The Macro Time setting offers two modes: Macro Bullet and Silver Bullet. Both help traders focus on specific times when the market tends to deliver clean moves.
• Macro Bullet is based on the high and low of a full macro session. It automatically detects the session’s range and bias, then offers optimal entries for either Long or Short setups. Once the session resolves, it provides Fibonacci-based levels for entry, target, and stop loss.
• Silver Bullet is based on ICT concepts and focuses on the hourly range for London, NY AM, and NY PM sessions. It’s designed for quick time blocks and highlights key levels as the session unfolds.
To use this setup, set Macro Time to “ICT Sessions” and select your preferred mode under Bullet Mode.
⸻
🔹 Trading Setup #2: Daily Range
Enable Daily Range to draw Fibonacci levels based on either the previous day’s candle or the current day’s developing range. These levels help you identify potential support, resistance, and midpoint zones throughout the day.
With the current day’s range, levels automatically update in real time as new highs or lows form — keeping your chart aligned with evolving price action.
⸻
🔹 Trading Setup #3: Candlestick Patterns
Turn on Candlestick Patterns to automatically highlight clean reversal signals such as Hammers, Hanging Men, Shooting Stars, and Tweezers. Each pattern is detected using specific criteria and trend filters to reduce noise and improve reliability. They work especially well as confirmation signals around key levels or session zones.
Silver Bullet brings structure, clarity, and precision to your intraday trading. By combining time-based bias, price action levels, and pattern recognition, it helps you trade with purpose — not guesswork. Use one setup or combine all three for a complete view of the market, tailored to your style and session of choice.

Combined Predictive Indicator### Combined Predictive Zones & Levels
This indicator is a powerful hybrid tool designed to provide a comprehensive map of potential future price action. It merges two distinct predictive models into a single, cohesive view, helping traders identify key levels of support, resistance, and areas of high confluence.
#### How It Works: Two Models in One
This script is built on two core components that you can use together or analyze separately:
**Part 1: Classic Range & Fibonacci Prediction**
This model uses classic technical analysis principles to project a potential range for the upcoming price action.
* **Highest High / Lowest Low:** It identifies the significant trading range over a user-defined lookback period.
* **Fibonacci Levels:** It automatically plots key Fibonacci retracement levels (e.g., 38.2% and 61.8%) within this range, which often act as critical support or resistance.
* **ATR & Average Range:** It calculates a "predicted" upper and lower boundary based on the average historical range and current volatility (ATR).
**Part 2: Advanced Predictive Ranges (Self-Adjusting Channels)**
This is a dynamic model that creates adaptive support and resistance zones based on a smoothed average price and volatility.
* **Dynamic Average:** It uses a unique moving average that only adjusts when the price moves significantly, creating a stable baseline.
* **ATR-Based Zones:** It projects multiple levels of support (S1, S2) and resistance (R1, R2) around this average, which widen and narrow based on market volatility. These zones often signal areas where price might stall or reverse.
#### Key Features:
* **Hybrid Model for Confluence:** The true power of this indicator lies in finding where the levels from both models overlap. A Fibonacci level aligning with a Predictive Range support zone is a much stronger signal.
* **Comprehensive Data Table:** A clean, on-chart table displays the precise values of all key predictive levels, allowing for quick reference and precise trade planning.
* **Multi-Timeframe (MTF) Capability:** The Advanced Predictive Ranges can be calculated on a higher timeframe, giving you a broader market context.
* **Fully Customizable:** All lengths, multipliers, and levels for both models are fully adjustable in the settings to fit any asset or trading style.
* **Clear Visuals:** All zones and levels are color-coded for intuitive and easy-to-read analysis.
#### How to Use:
1. Look for areas of **confluence** where multiple levels from both models cluster together. These are high-probability zones for price reactions.
2. Use the Predictive Range zones (S1/S2 and R1/R2) as potential targets for trades or as areas to watch for entries and exits.
3. Pay attention to the on-chart table for exact price levels to set limit orders or stop-losses.
**Disclaimer:** This script is an analytical tool for educational purposes and should not be considered financial advice. All trading involves risk. Past performance is not indicative of future results. Always use this indicator as part of a comprehensive trading strategy with proper risk management.
Feedback is welcome! If you find this tool useful, please leave a like.

🔁 A.X.I.S Fibonacci Engine V2 – Smart Projected Pathway🔁 A.X.I.S Fibonacci Engine V2 – Smart Projected Pathway indicator
The A.X.I.S Fibonacci Engine V2 is a next-generation Fibonacci projection tool designed for traders seeking advanced, adaptive levels that respond to true multi-timeframe market structure. Built from the ground up for active traders—scalpers, swing traders, and position players—it fuses traditional Fibonacci logic with dynamic price projection and smart anchor logic.
How It Works:
Multi-Timeframe Anchoring:
Anchors your Fibonacci levels to High Timeframe (HTF) pivots for powerful bias and “macro” market structure, while also utilizing Low Timeframe (LTF) swing detection for precise “micro” projection and pathway analysis.
Dynamic Pathway Projection:
Beyond static lines, this engine allows Fibonacci levels to be projected forward, following the price path between significant swings—giving you projected targets and active “pathways” instead of just fixed retracement bands.
Trend-Adaptive Logic:
Determines bullish/bearish bias based on where HTF price closes relative to a moving average (HTF EMA-20), meaning the plotted fibs automatically adjust to uptrends or downtrends. No need to guess direction.
Auto-Cleanup & Smart Management:
Old lines and labels are deleted automatically to keep your chart clean, and levels are recalculated with every new significant swing (“leg”)—no manual intervention needed.
Key Features:
Multi-Timeframe Input:
Choose both HTF (for “anchor” pivots) and LTF (for “projection” pivots) independently.
Fine-tune swing sensitivity for both anchors and pathway pivots.
Classic + Projected Mode:
Choose between standard horizontal Fibs or enable Dynamic Pathway Mode to project levels diagonally into future bars, creating “fib pathways.”
Color Customization:
Individualize bullish/bearish fib colors, line style (solid, dashed, dotted), thickness, label position, and transparency.
Special “golden zone” highlighting for the most critical levels (0.618/0.786).
Visual Anchors:
Optionally plot markers for HTF swing pivots for extra clarity.
Chart Cleanliness:
Script manages and deletes its own objects—no more chart clutter!
Real-Time Auto-Update:
All levels and pathways update in real time as market structure changes.
User-Friendly Labels:
Toggle on/off fib level labels, with position and background adjustments.
Practical Trading Applications:
Swing/Position Trading:
Use HTF pivots for macro context, then project LTF fibs into the future for potential reversal/extension targets.
Scalping:
Deploy on lower timeframes with micro pivots for intraday levels and short-term projected moves.
Dynamic Take-Profit & Entry Zones:
Identify evolving TP and re-entry zones as price carves out new swings, even in choppy or trending conditions.
Trend Confirmation:
Let the engine determine trend direction, so your fibs are always aligned with prevailing momentum.
How to Use:
Add to Chart:
Apply the indicator to any chart or timeframe.
Set Your Anchors:
Pick the HTF (anchor) and LTF (projection) timeframes.
Adjust swing sensitivity (lookback) as needed.
Enable/Disable Dynamic Pathway:
For regular fibs, leave off.
For projected “pathways,” turn it ON—lines will project forward along the likely path of the next move.
Adjust Colors, Labels, and Styles:
Fine-tune everything for clarity and your personal style.
Watch for Changes:
As new pivots form, the script will update levels in real time, keeping your roadmap fresh.
(Optional) Show Macro Swings:
Toggle on/off to plot markers for the most recent HTF pivots.
Who Is It For?
Day traders, scalpers, and swing traders wanting true projected price targets—not just static fibs.
Traders tired of redrawing fibs after every new swing.
Anyone who wants a clean, dynamic, and truly adaptive fib tool that blends macro and micro market structure into one engine.
What Makes It Different?
True multi-timeframe awareness:
Adapts to both macro (HTF) and micro (LTF) structure.
Automatic trend recognition:
Fibs align with price action—no manual flipping.
Projected, not just static:
See where fib levels could land, not just where they were.
Cleanest chart management:
Deletes its own lines and labels on every update—no mess, ever.
Note:
This tool is for educational and informational purposes only. Not financial advice. Always use proper risk management!
Any issues or feature requests? Drop a comment below or reach out!
Happy trading and welcome to the A.X.I.S revolution.
— I5X-Albatross

Fib Swing Counter [A@J]Fib Swing Counter — Trade the Rhythm of the Market
This indicator automatically marks swing highs and lows with Fibonacci numbers (1, 1, 2, 3, 5, 8, 13, …), helping you track market structure, count price legs, and identify hidden order behind price movement.
Core Features:
Auto-detects pivots and labels them with the Fibonacci sequence.
Alternates between highs and lows — no repeats, no noise.
Custom reset time — start your count at the New York session open, a major news event, or your own strategic point.
Clean and simple visual display, adaptable to your chart style.
How Traders Use It:
Liquidity cycles: Spot when price is expanding or contracting in Fibonacci-driven waves.
Entry timing: Wait for setups to align with a key Fib count.
Confluence with other tools: Combine with ICT concepts, SMT divergence, supply/demand blocks, or Fibonacci retracements.
Session-based analysis: Restart the sequence everyMarket Open, Midnight, New York or London open to study price behavior from a fresh anchor point.
Whether you're into smart money concepts, price action, or algorithmic patterns, this tool adds a rhythmic layer to your analysis — because markets move with sequence, not randomness.

Fibonacci Sequence Moving Average [BackQuant]Fibonacci Sequence Moving Average with Adaptive Oscillator
1. Overview
The Fibonacci Sequence Moving Average indicator is a two‑part trading framework that combines a custom moving average built from the famous Fibonacci number set with a fully featured oscillator, normalisation engine and divergence suite. The moving average half delivers an adaptive trend line that respects natural market rhythms, while the oscillator half translates that trend information into a bounded momentum stream that is easy to read, easy to compare across assets and rich in confluence signals. Everything from weighting logic to colour palettes can be customised, so the tool comfortably fits scalpers zooming into one‑minute candles as well as position traders running multi‑month trend following campaigns.
2. Core Calculation
Fibonacci periods – The default length array is 5, 8, 13, 21, 34. A single multiplier input lets you scale the whole family up or down without breaking the golden‑ratio spacing. For example a multiplier of 3 yields 15, 24, 39, 63, 102.
Component averages – Each period is passed through Simple Moving Average logic to produce five baseline curves (ma1 through ma5).
Weighting methods – You decide how those five values are blended:
• Equal weighting treats every curve the same.
• Linear weighting applies factors 1‑to‑5 so the slowest curve counts five times as much as the fastest.
• Exponential weighting doubles each step for a fast‑reacting yet still smooth line.
• Fibonacci weighting multiplies each curve by its own period value, honouring the spirit of ratio mathematics.
Smoothing engine – The blended average is then smoothed a second time with your choice of SMA, EMA, DEMA, TEMA, RMA, WMA or HMA. A short smoothing length keeps the result lively, while longer lengths create institution‑grade glide paths that act like dynamic support and resistance.
3. Oscillator Construction
Once the smoothed Fib MA is in place, the script generates a raw oscillator value in one of three flavours:
• Distance – Percentage distance between price and the average. Great for mean‑reversion.
• Momentum – Percentage change of the average itself. Ideal for trend acceleration studies.
• Relative – Distance divided by Average True Range for volatility‑aware scaling.
That raw series is pushed through a look‑back normaliser that rescales every reading into a fixed −100 to +100 window. The normalisation window defaults to 100 bars but can be tightened for fast markets or expanded to capture long regimes.
4. Visual Layer
The oscillator line is gradient‑coloured from deep red through sky blue into bright green, so you can spot subtle momentum shifts with peripheral vision alone. There are four horizontal guide lines: Extreme Bear at −50, Bear Threshold at −20, Bull Threshold at +20 and Extreme Bull at +50. Soft fills above and below the thresholds reinforce the zones without cluttering the chart.
The smoothed Fib MA can be plotted directly on price for immediate trend context, and each of the five component averages can be revealed for educational or research purposes. Optional bar‑painting mirrors oscillator polarity, tinting candles green when momentum is bullish and red when momentum is bearish.
5. Divergence Detection
The script automatically looks for four classes of divergences between price pivots and oscillator pivots:
Regular Bullish, signalling a possible bottom when price prints a lower low but the oscillator prints a higher low.
Hidden Bullish, often a trend‑continuation cue when price makes a higher low while the oscillator slips to a lower low.
Regular Bearish, marking potential tops when price carves a higher high yet the oscillator steps down.
Hidden Bearish, hinting at ongoing downside when price posts a lower high while the oscillator pushes to a higher high.
Each event is tagged with an ℝ or ℍ label at the oscillator pivot, colour‑coded for clarity. Look‑back distances for left and right pivots are fully adjustable so you can fine‑tune sensitivity.
6. Alerts
Five ready‑to‑use alert conditions are included:
• Bullish when the oscillator crosses above +20.
• Bearish when it crosses below −20.
• Extreme Bullish when it pops above +50.
• Extreme Bearish when it dives below −50.
• Zero Cross for momentum inflection.
Attach any of these to TradingView notifications and stay updated without staring at charts.
7. Practical Applications
Swing trading trend filter – Plot the smoothed Fib MA on daily candles and only trade in its direction. Enter on oscillator retracements to the 0 line.
Intraday reversal scouting – On short‑term charts let Distance mode highlight overshoots beyond ±40, then fade those moves back to mean.
Volatility breakout timing – Use Relative mode during earnings season or crypto news cycles to spot momentum surges that adjust for changing ATR.
Divergence confirmation – Layer the oscillator beneath price structure to validate double bottoms, double tops and head‑and‑shoulders patterns.
8. Input Summary
• Source, Fibonacci multiplier, weighting method, smoothing length and type
• Oscillator calculation mode and normalisation look‑back
• Divergence look‑back settings and signal length
• Show or hide options for every visual element
• Full colour and line width customisation
9. Best Practices
Avoid using tiny multipliers on illiquid assets where the shortest Fibonacci window may drop under three bars. In strong trends reduce divergence sensitivity or you may see false counter‑trend flags. For portfolio scanning set oscillator to Momentum mode, hide thresholds and colour bars only, which turns the indicator into a heat‑map that quickly highlights leaders and laggards.
10. Final Notes
The Fibonacci Sequence Moving Average indicator seeks to fuse the mathematical elegance of the golden ratio with modern signal‑processing techniques. It is not a standalone trading system, rather a multi‑purpose information layer that shines when combined with market structure, volume analysis and disciplined risk management. Always test parameters on historical data, be mindful of slippage and remember that past performance is never a guarantee of future results. Trade wisely and enjoy the harmony of Fibonacci mathematics in your technical toolkit.

52SIGNAL RECIPE Bollinger Bands & Fibonacci Spike Signal Matrix====== 52SIGNAL RECIPE Bollinger Bands & Fibonacci Spike Signal Matrix ======
◆ Overview
52SIGNAL RECIPE Bollinger Bands & Fibonacci Spike Signal Matrix is an advanced multi-band indicator that integrates Bollinger Bands, Fibonacci levels, and ATR-based Spike signals (for detecting bullish/bearish pressure and volatility surges).
Built on a VWMA (Volume-Weighted Moving Average) foundation, it displays standard deviation bands, Fibonacci extension zones, multi-level expansions, and real-time bullish/bearish spike alerts alongside price labeling and color gradation.
This tool is designed to help traders visually analyze and react to:
- Key support/resistance zones
- Overbought/oversold boundaries
- Sudden directional volatility shifts (spikes)
All parameters are customizable to suit a wide variety of trading strategies and styles.
====== ◆ Key Features ======
- Multi-structured Bollinger Bands: VWMA-based center line with ± standard deviation bands and multiple levels of outer extension (+10% to +50%)
- Integrated Fibonacci Bands: Levels at 23.6%, 38.2%, 50%, 61.8%, and 78.6% above and below the center line
- ATR-based Spike Signal Alerts: Automatically detects sudden bullish/bearish volatility surges and triggers directional warning labels (“Bullish Spike Warning” or “Bearish Spike Warning”)
- Real-Time Price Labels & Visual Gradation: Each important band and level includes live price labeling and color-coded zone visualization
- Fully Adjustable Parameters & Panel Display Options: All inputs and visual elements can be toggled or customized
====== ◆ Technical Basis ======
■ Bollinger Bands & Multi-Extension
- Center Line: VWMA (Volume-Weighted Moving Average)
- Bands: ± Standard deviation (default 2.5), with extensions in +10% increments up to +50%
- Extension Zones: Reveal reactions to high volatility or trend continuation
■ Fibonacci Bands
- Symmetrical expansion from center line using Fibonacci ratios
- Visually highlights layered historical retracement zones and price clustering
■ ATR-Based Spike Signal
- Adaptive to chart timeframe (ATR Length & Multiplier auto-adjusted)
- Spike alerts triggered when price exceeds upper/lower ATR bands
- One signal per X bars to filter noise (interval adjustable)
■ Live Visual Labeling & Color Gradients
- Intelligently labeled bands with dynamic color shading between levels
- Helps clarify price geometry and zone importance
====== ◆ Practical Applications ======
■ Spike Signal Interpretation
- Bullish Spike Warning — Market plunged below ATR range → Potential oversold rebound signal
- Bearish Spike Warning — Market surged above ATR range → Potential overbought reversal signal
■ Band & Level Interaction
- Ripple behavior between Fibonacci levels signals trend momentum/weakness
- Penetration through outer expansion bands flags possible trend strength or volatility spikes
■ Integrated Trading Strategies
- Reversal Trades: Bounces between extension and Fibonacci levels
- Breakout Confirmation: Spike signals backing breakout moves
- Directional Bias: Trend-following confirmation when price exceeds multiple zones
====== ◆ Advanced Setting Options ======
All parameters can be fine-tuned for your trading strategy, market, and timeframe.
■ Bollinger Band Period
_Default:_ 20
_Description:_ Number of bars for VWMA and standard deviation. Shorter (10–14): faster but noisier. Longer (30–50): smoother, better for trend analysis.
■ Standard Deviation Multiplier
_Default:_ 2.5
_Description:_ Controls main band width. Lower values (1.5–2.0): More signals, higher sensitivity. Higher values (2.5–3.0): Fewer signals, higher reliability.
■ Band Extension Ratios
_Default:_ +10%, +20%, +30%, +40%, +50%
_Description:_ Amount to expand beyond standard bands. Used for detecting extended zones or extreme price movement areas.
■ ATR Length
_Default:_ Auto depending on timeframe (typically 14–30)
_Description:_ Period for calculating ATR. Shorter: Reacts faster, more sensitive. Longer: Smoother, filters short noise.
■ ATR Multiplier
_Default:_ Auto (1.75 to 2.8)
_Description:_ Sets the threshold for Spike signals. Lower: More frequent but smaller spikes. Higher: Triggers fewer but stronger signals.
■ Fibonacci Levels
_Default:_ 0.236, 0.382, 0.5, 0.618, 0.786
_Description:_ Determines how far Fibonacci bands extend from the center. Aids in identifying key retracement and reaction points.
■ Spike Signal Interval
_Default:_ 7 bars
_Description:_ Minimum bar separation between consecutive spike signals. Prevents signal overflooding from consecutive candles.
■ Labels & Coloring Display
_Toggle ON/OFF_
Show/hide all price labels and visual zone shading. Useful for decluttering or focusing on strategy testing.
Try adjusting these inputs based on your strategy and market conditions. Optimize for scalping, swing trading, day trading, or investing by testing different lengths, bands, and spike sensitivities.
====== ◆ Indicator Synergies ======
- Combine with moving averages, RSI, or MACD for breakout filters
- Use with support/resistance lines or Fibonacci retracements to validate critical zones
- Pair with Keltner Channels, ATR Bands, or volume-based tools for enhanced volatility tracking
====== ◆ Conclusion ======
52SIGNAL RECIPE Bollinger Bands & Fibonacci Spike Signal Matrix offers a cohesive framework that connects price level analysis, trend structure, and volatility-driven directional signals—all in one indicator. It’s not just a visualization tool, but a decision-support system for both reactive trade entries and proactive risk management. With full parameter adjustability and a clear structural layout, it empowers traders to adapt across assets, timeframes, and strategies—efficiently and confidently.
====== ◆ Disclaimer ======
This indicator is for informational and educational purposes only.
Past performance does not guarantee future results. Always apply proper risk management.
====== 52SIGNAL RECIPE Bollinger Bands & Fibonacci Spike Signal Matrix ======
◆ 개요
52SIGNAL RECIPE Bollinger Bands & Fibonacci Spike Signal Matrix는 볼린저 밴드, 피보나치 레벨, ATR 기반 스파이크 신호(상방/하방 압력 감지)를 결합한 고급 멀티 밴드 인디케이터입니다.
VWMA(거래량 가중 이동평균) 기반 중심선 위에 표준편차 밴드, 피보나치 확장 레벨, 다중 확장 밴드, 실시간 상·하방 스파이크 경고(라벨)와 가격 레이블·컬러 그라데이션이 동시에 제공됩니다.
트레이더가 주요 지지/저항, 과매수·과매도, 급격한 변동성 스파이크(방향성 돌파)를 한눈에 시각적으로 분석할 수 있도록 디자인되었습니다.
모든 설정값은 트레이딩 스타일에 맞춰 자유롭게 조절 가능합니다.
====== ◆ 주요 특징 ======
- VWMA 기반 중심선과 표준편차 밴드(±), 10~50% 단계별 외곽 확장
- 피보나치 밴드: 중심선 기준 23.6%, 38.2%, 50%, 61.8%, 78.6% 상·하단 동시 표기
- ATR 기반 스파이크 신호: 강한 상·하방 변동성 구간 실시간 감지(‘Bullish Spike Warning’, ‘Bearish Spike Warning’ 라벨)
- 실시간 가격 레이블 & 컬러 구간 구분
- 밴드/변동성/피보나치/시각 옵션 등 설정 완전 자유화
====== ◆ 기술적 기반 ======
■ 볼린저 밴드/확장
- VWMA 중심선, ± 표준편차 밴드(기본 2.5), 단계별 외곽 확장(10~50%)
■ 피보나치 밴드
- 중심선 기준 대칭 배치(0.236, 0.382, 0.5, 0.618, 0.786)
■ ATR 기반 스파이크 신호
- 차트 주기에 자동 최적화(ATR 기간/배수), 상단·하단 ATR 밴드 돌파 시 스파이크 라벨
- 반복 신호 방지(신호 간격 조정 가능)
■ 실시간 레이블 & 컬러 그라데이션
- 주요 밴드, 피보나치, 확장 레벨별 가격 표시 및 구간 별도 색상
====== ◆ 실용적 응용 ======
■ 스파이크 신호 해석
- Bullish Spike Warning: 과매도 구간(강한 하락 후 단기 반등 가능성)
- Bearish Spike Warning: 과매수 구간(급등 이후 단기 되돌림 가능성)
■ 밴드 & 레벨 시그널
- 피보나치 레벨 간 파동/추세 강도 진단
- 외곽 확장 밴드 돌파 시 강한 추세 혹은 변동성 집중 구간 인식
■ 통합 트레이딩 전략
- 주요 밴드·피보나치 간 바운스, 전환 패턴 기반 반전매매
- 스파이크 신호와 결합한 돌파 추종·추세 확정 대응
- 다중 구간 통과 시 방향성 강화 신호 등급별 분할 대응
====== ◆ 고급 설정 옵션 ======
트레이딩 스타일, 차트 주기, 시장 환경에 따라 모든 항목을 직접 조정할 수 있습니다.
■ 볼린저 밴드 기간 (Bollinger Band Period)
기본값: 20
VWMA 및 표준편차 산출에 적용할 캔들 수
짧게(10~14): 신호 빠르며 노이즈 많음
길게(30~50): 깔끔한 추세 중시
■ 표준편차 계수 (Standard Deviation Multiplier)
기본값: 2.5
밴드 폭 조절
1.5~2.0: 민감, 많이 신호
2.5~3.0: 신뢰도 높고 드문 신호
■ 밴드 확장 비율 (Band Extension Ratios)
기본값: 10%, 20%, 30%, 40%, 50%
기본 밴드에서 외곽 확장 단계
극단 변동성, 피로구간 등 감지
■ ATR 기간 (ATR Length)
기본값: 자동(보통 14~30)
ATR 산출 캔들 수
짧을수록 민감, 길수록 부드러움
■ ATR 배수 (ATR Multiplier)
기본값: 자동(1.75~2.8)
스파이크 신호 감지 문턱값
낮게: 잦고 약한 신호
높게: 드문 강한 신호
■ 피보나치 레벨 (Fibonacci Levels)
기본값: 0.236, 0.382, 0.5, 0.618, 0.786
중심선으로부터 각 밴드 거리
주요 지지/저항, 파동구조 세분화
■ 스파이크 신호 간격 (Spike Signal Interval)
기본값: 7
연속적 신호 과다 방지용 최소 캔들 수
높을수록 과발생 차단
■ 레이블/채색 표시 (Labels & Coloring)
On/Off
가격 레이블·영역 컬러 표시 ON/OFF
시장/전략별로 세부 세팅을 바꿔가며 직접 테스트 해보세요!
====== ◆ 시너지 활용 ======
- 이동평균, RSI, MACD 등과 조합시 신호 필터링
- 기존 수평 지지/저항, 피보나치 리트레이스먼트 등과 병용
- ATR, 켈트너밴드, 거래량 등과 복합 분석 가능
====== ◆ 결론 ======
52SIGNAL RECIPE Bollinger Bands & Fibonacci Spike Signal Matrix는 가격 구조, 변동성 이벤트, 방향성 신호를 하나로 통합한 고급 매매 지원 시스템입니다.
스캘핑, 스윙, 포지션 트레이딩 등 다양한 전략에 맞게 모든 파라미터를 세밀하게 조율할 수 있습니다.
현대 트레이딩 환경에 최적화된 정밀 결정 지원 도구로 활용하세요.
====== ◆ 면책 조항 ======
본 지표는 정보 제공 및 교육 목적입니다.
과거 실적이 미래의 수익을 보장하지 않으므로 반드시 철저한 리스크 관리를 병행하세요.

52SIGNAL RECIPE VWAP Quantum Matrix Pro═══52SIGNAL RECIPE VWAP Quantum Matrix Pro ═══
◆ Overview
52SIGNAL RECIPE VWAP Quantum Matrix Pro is an advanced technical indicator based on Volume Weighted Average Price (VWAP), integrating volatility-adjusted bands and Fibonacci levels to provide multi-dimensional analysis of price movements.
It automatically applies optimized lookback periods for different timeframes, providing customized analysis for various trading styles, and helps traders effectively identify critical support/resistance zones through precise price level identification.
─────────────────────────────────────
◆ Key Features
• **Adaptive VWAP Bands**: Automatically adjusting upper and lower bands based on market volatility
• **Fibonacci Integration**: Fibonacci levels (23.6%, 38.2%, 50%, 61.8%, 78.6%) extended around VWAP center
• **Timeframe Optimization**: Automatic lookback period adjustment for each chart cycle
• **Pivot Point Analysis**: Core support/resistance levels based on volume-weighted highs and lows
• **Precision Labeling**: Accurate numerical display for all major price levels
• **Visual Gradation**: Intuitive visualization through color gradation for each Fibonacci level
─────────────────────────────────────
◆ Technical Foundation
■ VWAP Calculation Principles
• **Volume Weighting**: Calculation of real equilibrium price considering volume rather than simple price averaging
• **Standard Deviation Bands**: Statistical fluctuation range setting around VWAP center
• **Volatility Adjustment Mechanism**: Dynamic band width adjustment using current ATR to historical ATR ratio
• **Precise Price Range**: Identification of highest/lowest price range within specified lookback period
■ Fibonacci Band Implementation
• **VWAP-Centered Extension**: Division of distance from centerline (VWAP) to standard deviation bands by Fibonacci ratios
• **Symmetrical Upper/Lower Structure**: Application of identical Fibonacci ratios in both upward and downward directions
• **Color Gradation**: Progressive color changes for each Fibonacci level providing visual depth
─────────────────────────────────────
◆ Practical Applications
■ Price Movement Interpretation
• **Central Reference Point**:
▶ VWAP serves as intraday/period equilibrium price providing balance point of buying/selling pressure
▶ Movement above/below VWAP can be interpreted as short-term bullish/bearish signals
• **Band Reaction Patterns**:
▶ Reaching outer bands (100%) signals overbought/oversold conditions
▶ Reaction patterns between Fibonacci levels provide basis for trend strength and persistence judgment
■ Trading Strategy Utilization
• **Range-bound Trading**:
▶ Short-term trading utilizing bounce patterns between Fibonacci levels
▶ Oscillation trading between centerline (VWAP) and Fibonacci levels
• **Trend Following Strategy**:
▶ Breakout of Fibonacci levels aligned above/below VWAP signals trend strengthening
▶ Strong momentum confirmation when re-entering after outer band breakout
─────────────────────────────────────
◆ Advanced Configuration Options
■ Input Parameter Guide
• **Base Standard Deviation** (Default: 2.0)
▶ 1.0-1.5: Narrow bands, suitable for short-term trading
▶ 1.8-2.2: Balanced bands, optimal for general market conditions
▶ 2.5-3.0: Wide bands, suitable for long-term positions
• **Maximum/Minimum Standard Deviation** (Default: 3.0/1.0)
▶ Maximum: Cryptocurrency (4.0), Stocks/Forex (3.0), Low volatility (2.5)
▶ Minimum: Intraday trading (0.8), General (1.0), Long-term (1.5)
• **Volatility Measurement Period** (Default: 20)
▶ Short-term (10-14): Fast response, intraday trading
▶ Medium-term (15-25): Balanced response, swing trading
▶ Long-term (30-50): Noise filtering, long-term investment
• **Use Volatility Adjustment** (Default: On)
▶ On: Automatic band width adjustment based on current market volatility (recommended)
▶ Off: Fixed standard deviation bands usage
■ Timeframe-Specific Optimal Settings
• **Intraday Trading** (15min-1hr): Base standard deviation 1.8, volatility period 14
• **Swing Trading** (4hr-daily): Base standard deviation 2.0, volatility period 20
• **Position Trading** (daily-weekly): Base standard deviation 2.5, volatility period 30
■ Market-Specific Optimal Settings
• **Stock Market**: Base standard deviation 2.0, volatility period 20
• **Forex Market**: Base standard deviation 1.8, volatility period 25
• **Cryptocurrency Market**: Base standard deviation 2.5, volatility period 14, maximum standard deviation 4.0
─────────────────────────────────────
◆ Synergy with Other Indicators
• **Moving Averages**: VWAP and major moving average crossovers strengthen trend reversal signals
• **RSI/Stochastic**: Combination of VWAP band reactions in overbought/oversold zones improves reversal signal accuracy
• **Bollinger Bands**: VWAP Quantum Matrix and Bollinger Band convergence/divergence patterns are useful for volatility change prediction
• **Fibonacci Retracement**: Strong support/resistance formation when trend-direction Fibonacci retracement matches VWAP Fibonacci levels
• **Horizontal Support/Resistance**: Reaction probability significantly increases when past important price levels match VWAP Fibonacci levels
─────────────────────────────────────
◆ Conclusion
VWAP Quantum Matrix Pro provides deep insights into price action by integrating volatility-adjusted bands and Fibonacci theory into traditional VWAP analysis.
It dynamically responds to market environment changes through volume weighting and volatility adaptation mechanisms, and can be flexibly applied to various trading styles through timeframe-optimized lookback period settings.
Through appropriate input parameter configuration, the indicator can be optimized to match each trader's style and objectives, and through combination with other technical indicators, it strengthens confidence in trading decisions, ultimately enabling more precise and systematic market approaches.
─────────────────────────────────────
※ Disclaimer: Past performance does not guarantee future results. Always use appropriate risk management strategies.
═══52SIGNAL RECIPE VWAP Quantum Matrix Pro ═══
◆ 개요
52SIGNAL RECIPE VWAP Quantum Matrix Pro는 거래량 가중 평균 가격(VWAP)을 기반으로 하는 고급 기술적 지표로, 변동성 조정 밴드와 피보나치 레벨을 통합하여 가격 움직임을 다차원적으로 분석합니다.
타임프레임별로 최적화된 룩백 기간을 자동 적용하여 다양한 거래 스타일에 맞춤화된 분석을 제공하며, 정밀한 가격 레벨 식별을 통해 트레이더가 중요한 지지/저항 구간을 효과적으로 파악할 수 있도록 돕습니다.
─────────────────────────────────────
◆ 주요 특징
• **적응형 VWAP 밴드**: 시장 변동성에 따라 자동으로 조정되는 상하단 밴드 제공
• **피보나치 통합**: VWAP 중심으로 피보나치 레벨(23.6%, 38.2%, 50%, 61.8%, 78.6%) 확장
• **타임프레임 최적화**: 각 차트 주기에 맞춰 자동으로 룩백 기간 조정
• **피봇 포인트 분석**: 거래량 가중 고저가 기반의 핵심 지지/저항 레벨 표시
• **정밀 레이블링**: 모든 주요 가격 레벨에 정확한 수치 표시
• **시각적 그라데이션**: 피보나치 레벨별 컬러 그라데이션으로 직관적인 시각화
─────────────────────────────────────
◆ 기술적 기반
■ VWAP 계산 원리
• **거래량 가중치**: 단순 가격 평균이 아닌 거래량을 고려한 실질적 균형 가격 계산
• **표준편차 밴드**: VWAP 중심으로 통계적 변동 범위 설정
• **변동성 조정 메커니즘**: 현재 ATR과 과거 ATR 비율을 활용한 동적 밴드폭 조정
• **정밀 가격 범위**: 지정된 룩백 기간 내 최고/최저 가격 범위 식별
■ 피보나치 밴드 구현
• **VWAP 중심 확장**: 중심선(VWAP)에서 표준편차 밴드까지의 거리를 피보나치 비율로 분할
• **상하단 대칭 구조**: 상승과 하락 방향으로 동일한 피보나치 비율 적용
• **색상 그라데이션**: 피보나치 레벨별 점진적 색상 변화로 시각적 깊이감 제공
─────────────────────────────────────
◆ 실용적 응용
■ 가격 움직임 해석
• **중심 기준점**:
▶ VWAP은 일중/기간 내 균형가격으로 매수/매도 압력의 균형점 제공
▶ VWAP 위/아래 움직임은 단기 강세/약세 신호로 해석 가능
• **밴드 반응 패턴**:
▶ 외부 밴드(100%)에 도달 시 과매수/과매도 상태 시그널
▶ 피보나치 레벨 간 반응 패턴은 추세 강도와 지속성 판단 근거
■ 트레이딩 전략 활용
• **범위 내 거래**:
▶ 피보나치 레벨 간 바운스 패턴 활용한 단기 매매
▶ 중심선(VWAP)과 피보나치 레벨 간 오실레이션 거래
• **추세 추종 전략**:
▶ VWAP 위/아래 정렬된 피보나치 레벨 돌파는 추세 강화 신호
▶ 외부 밴드 돌파 후 다시 진입 시 강한 모멘텀 확인
─────────────────────────────────────
◆ 고급 설정 옵션
■ 인풋 파라미터 가이드
• **기본 표준 편차 (Base Standard Deviation)** (기본값: 2.0)
▶ 1.0-1.5: 좁은 밴드, 단기 거래에 적합
▶ 1.8-2.2: 균형 잡힌 밴드, 일반적 시장 환경에 최적
▶ 2.5-3.0: 넓은 밴드, 장기 포지션에 적합
• **최대/최소 표준 편차 (Maximum/Minimum Standard Deviation)** (기본값: 3.0/1.0)
▶ 최대: 암호화폐(4.0), 주식/외환(3.0), 저변동성(2.5)
▶ 최소: 일중 거래(0.8), 일반(1.0), 장기(1.5)
• **변동성 측정 기간 (Volatility Measurement Period)** (기본값: 20)
▶ 단기(10-14): 빠른 반응, 일중 거래
▶ 중기(15-25): 균형 잡힌 반응, 스윙 트레이딩
▶ 장기(30-50): 노이즈 필터링, 장기 투자
• **변동성 조정 사용 (Use Volatility Adjustment)** (기본값: 켜짐)
▶ 켜짐: 현재 시장 변동성에 따라 밴드 폭 자동 조정 (권장)
▶ 꺼짐: 고정된 표준편차 밴드 사용
■ 타임프레임별 최적 설정
• **일중 거래** (15분-1시간): 기본 표준편차 1.8, 변동성 기간 14
• **스윙 트레이딩** (4시간-일봉): 기본 표준편차 2.0, 변동성 기간 20
• **포지션 트레이딩** (일봉-주봉): 기본 표준편차 2.5, 변동성 기간 30
■ 시장별 최적 설정
• **주식 시장**: 기본 표준편차 2.0, 변동성 기간 20
• **외환 시장**: 기본 표준편차 1.8, 변동성 기간 25
• **암호화폐 시장**: 기본 표준편차 2.5, 변동성 기간 14, 최대 표준편차 4.0
─────────────────────────────────────
◆ 다른 지표와의 시너지
• **이동평균선**: VWAP과 주요 이동평균선 교차는 추세 전환 신호 강화
• **RSI/스토캐스틱**: 과매수/과매도 구간에서 VWAP 밴드 반응과 결합 시 반전 신호 정확도 향상
• **볼린저 밴드**: VWAP Quantum Matrix와 볼린저 밴드 수렴/발산 패턴은 변동성 변화 예측에 유용
• **피보나치 리트레이스먼트**: 추세 방향 피보나치 리트레이스먼트와 VWAP 피보나치 레벨 일치 시 강력한 지지/저항 형성
• **수평 지지/저항**: 과거 중요 가격대와 VWAP 피보나치 레벨 일치 시 반응 확률 대폭 증가
─────────────────────────────────────
◆ 결론
VWAP Quantum Matrix Pro는 전통적인 VWAP 분석에 변동성 조정 밴드와 피보나치 이론을 통합하여 가격 행동에 대한 깊이 있는 통찰력을 제공합니다.
거래량 가중치와 변동성 적응 메커니즘을 통해 시장 환경 변화에 동적으로 대응하며, 타임프레임별 최적화된 룩백 기간 설정으로 다양한 거래 스타일에 유연하게 적용할 수 있습니다.
적절한 인풋 파라미터 설정을 통해 각 트레이더의 스타일과 목표에 맞게 지표를 최적화할 수 있으며, 다른 기술적 지표들과의 조합을 통해 트레이딩 결정에 대한 확신을 강화하고, 궁극적으로 더 정밀하고 체계적인 시장 접근을 가능하게 합니다.
─────────────────────────────────────
※ 면책 조항: 과거 성과가 미래 결과를 보장하지 않습니다. 항상 적절한 리스크 관리 전략을 사용하세요.

Fibonacci retracementHi all!
This indicator will show you the most recent Fibonacci retracement in the current trend. So if the trend is bullish the Fibonacci retracement will be drawn from swing low to high and from swing high to low in a bearish trend.
The uniqueness in this script lies in the adaptation to trend. To only plot the Fibonacci retracements according to the current market trend.
The trend is determined through break of structures (BOS) and change of characters (CHoCH). A change of character can be of type change of character plus (with a failed swing) and will then be shown as CHoCH+. This is possible through my library 'MarketStructure' (). It only uses break of structures and change of characters to be able to determine the trend, if you want a more detailed picture of the market structure you can use my script 'Market structure' ().
History and what to look for
Fibonacci retracement levels are used by many traders and are levels that are not Fibonacci sequence numbers themselves but they deriver from them. Some examples are:
23,6% - Divide a number by one three places ahead (e.g. 13/55)
38,2% - Divide a number by the one two places ahead (e.g. 21/55)
50% - Not from the Fibonacci sequence, but it's a number that price has reacted from in the past. Markets tend to retrace half a move before continuing
61,8% - The "golden retracement level". It derives from the "golden ratio" and is a core component of the Fibonacci sequence. The further you go in the Fibonacci sequence the preceding number divided by the current number will get closer and closer to this "golden ratio". This level is considered the most important Fibonacci retracement level by many traders
78,6% - Square root of 61.8%. This is often considered a deep correction (but not a trend reversal) and are often used for late entries
These levels are considered "key" and most significant. You want to look for a retracement of the price (down in a bullish trend and up in a bearish trend) to give you good entries.
Settings
For the trend you can set the pivot/swing lengths (right and left) and use the checkbox if you want these pivots to have labels. This can be done in the 'Market strucure' section.
In the 'Fibonacci retracement' section there is settings for the actual Fibonacci retracement. You can enable the trendline, set the color and the style of it. You can select which levels that should be shown by the indicator. There are 11 levels enabled by default, they are; 0-4.236. All settings in this section tries to be as similar to the "Fib Retracement" tool in Tradingview. You can also select the style of these lines (solid, dashed or dotted) and if you want them to extend to the right or not.
After this you can select if the Fibonacci retracement should be reversed or not, if prices should be displayed, if levels should be displayed and if to show the decimal levels or percentages and lastly the font size of these labels.
All defaults are based on the "Fib Retracement" tool by Tradingview.
Visualization
This indicator aims to be as visually similar to the default ("Fib Retracement") tool here on Tradingview. It will plot the Fibonacci retracement (called Auto Fibonacci/Auto fib) according to the trend from the library 'MarketStrucure'. The big differences from the "Fib Retracement" tool by Tradingview is that it's automatic (that adapts to trend), the market structure is visualized through lines and labels (showing 'BOS' for break of structures and 'CHoCH'/'CHoCH+' for change of characters) and that the labels showing information about the levels are positioned to be highly visible (left if <50% otherwise right if in a bullish trend, vice versa in a bearish trend or if reversed).
Don't hesitate if you have any feedback or nice feature suggestions!
Best of trading luck!

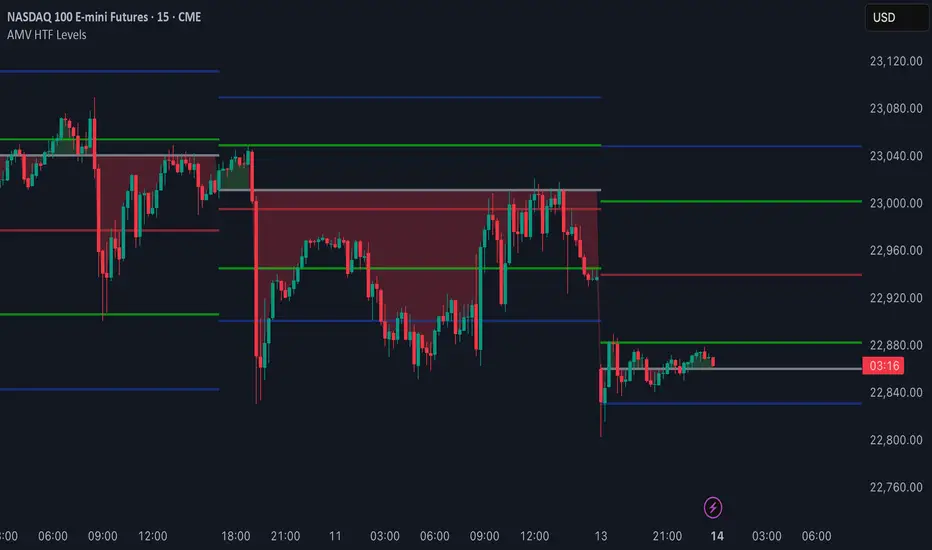
AMV HTF LevelsThe AMV HTF Levels indicator is a custom-built structure tool designed to help traders align with institutional-level zones across multiple timeframes. It auto-plots Fibonacci-based levels from the previous day and dynamically tracks the current session’s opens, highs, and lows across daily, weekly, and monthly timeframes.
What it does:
Uses previous day’s high and low to calculate Fibonacci retracement levels, drawing precise zone boxes that act as support/resistance or trend filters.
Tracks and updates the current high and low of the day/week/month in real time using floating boxes that extend through each respective session.
Plots static open levels at the beginning of each day, week, or month, with optional visual fills that indicate whether price is trading above (bullish) or below (bearish).
Lets you toggle on/off individual level groups or presets (e.g., 50%, key levels, power levels) to tailor what’s shown based on your trading style.
📈 Use case:
This tool is designed for traders who want to anchor their intraday or swing decisions around high-probability reference levels.
It can be used to:
Identify trend conditions
Trending above the upper green line (e.g. 78.6% or 100%) indicates strength.
Ranging between green lines often signals consolidation or balance.
Trending below the lower green line (e.g. 0% or 23.6%) shows bearish pressure.
Use opens as bias filters
Daily/Weekly/Monthly Opens act as key session pivot points.
Price holding above the open = bullish structure.
Price rejecting the open = potential reversal or shift.
React to dynamic highs/lows
Monitor where liquidity is building or being swept.
Use real-time high/low tracking for breakout/reversal triggers.
This is not a signal generator — it's a market context enhancer. Use it alongside your entry system to sharpen your timing, filter bad trades, and align with the bigger picture.
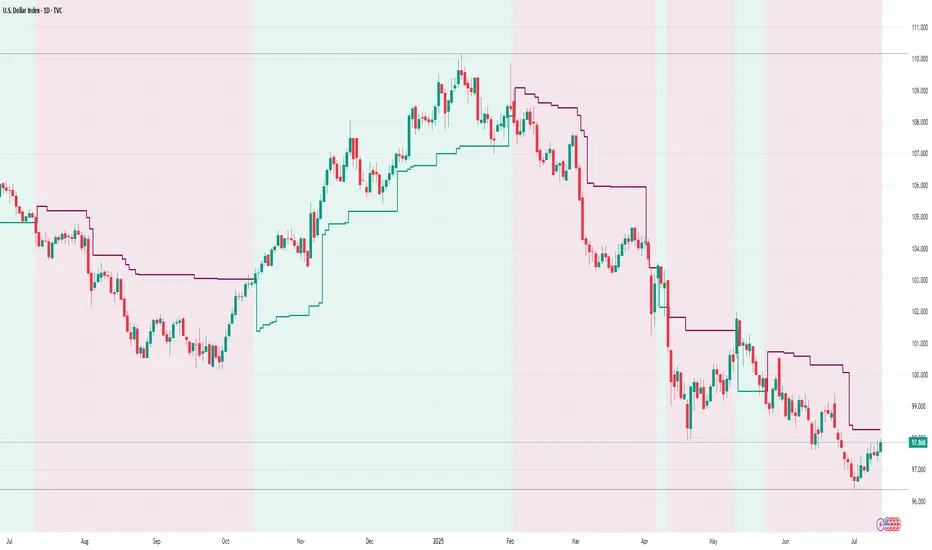
Golden Ratio Trend Persistence [EWT]Golden Ratio Trend Persistence
~~~~~~~~~~~~~~~~~~~~~~~~~~~~~~~~~~~~~~~~~~~~
Overview
The Golden Ratio Trend Persistence is a dynamic tool designed to identify the strength and persistence of market trends. It operates on a simple yet powerful premise: a trend is likely to continue as long as it doesn't retrace beyond the key Fibonacci golden ratio of 61.8%.
This indicator automatically identifies the most significant swing high or low and plots a single, dynamic line representing the 61.8% retracement level of the current move. This line acts as a "line in the sand" for the prevailing trend. The background color also changes to provide an immediate visual cue of the current market direction.
~~~~~~~~~~~~~~~~~~~~~~~~~~~~~~~~~~~~~~~~~~~~
The Power of the Golden Ratio (61.8%)
The golden ratio (ϕ≈1.618) and its inverse (0.618, or 61.8%) are fundamental mathematical constants that appear throughout nature, art, and science, often representing harmony and structure. In financial markets, this ratio is a cornerstone of Fibonacci analysis and is considered one of the most critical levels for price retracements.
Market movements are not linear; they progress in waves of impulse and correction. The 61.8% level often acts as the ultimate point of support or resistance. A trend that can hold this level demonstrates underlying strength and is likely to persist. A breach of this level, however, suggests a fundamental shift in market sentiment and a potential reversal.
~~~~~~~~~~~~~~~~~~~~~~~~~~~~~~~~~~~~~~~~~~~~
How to Use This Indicator
This indicator is designed for clarity and ease of use.
Identifying the Trend : The visual cues make the current trend instantly recognizable.
A teal line with a teal background signifies a bullish trend. The line acts as dynamic support.
A maroon line with a maroon background signifies a bearish trend. The line acts as dynamic resistance.
Confirming Trend Persistence : As long as the price respects the plotted level, the trend is considered intact.
In an uptrend, prices should remain above the teal line. The indicator will automatically adjust its anchor to new, higher lows, causing the support line to trail the price.
In a downtrend, prices should remain below the maroon line.
Spotting Trend Reversals : The primary signal is a trend reversal, which occurs when the price closes decisively beyond the plotted level.
Potential Sell Signal : When the price closes below the teal support line, it indicates that buying pressure has failed, and the uptrend is likely over.
Potential Buy Signal : When the price closes above the maroon resistance line, it indicates that selling pressure has subsided, and a new uptrend may be starting.
Think of this tool as an intelligent, adaptive trailing stop that is based on market structure and the time-tested principles of Fibonacci analysis.
~~~~~~~~~~~~~~~~~~~~~~~~~~~~~~~~~~~~~~~~~~~~
Input Parameters
You can customize the indicator's sensitivity through the following inputs in the settings menu:
Pivot Lookback Left : This number defines how many bars to the left of a candle must be lower (for a pivot high) or higher (for a pivot low) to identify a potential swing point. A higher value will result in fewer, but more significant, pivots being detected.
Pivot Lookback Right : This defines the number of bars that must close to the right before a swing point is confirmed. This parameter prevents the indicator from repainting. A higher value increases confirmation strength but also adds a slight lag.
Fibonacci Ratio : While the default is the golden ratio (0.618), you can adjust this to other key Fibonacci levels, such as 0.5 (50%) or 0.382 (38.2%), to test for different levels of trend persistence.
Adjusting these parameters allows you to fine-tune the indicator for different assets, timeframes, and trading styles, from short-term scalping to long-term trend following.
Golden Pocket Syndicate [GPS]Golden Pocket Syndicate is a multi-layered market analysis toolkit built for precision entries and sniper-style reversals in both trending and ranging conditions. The script fuses volume dynamics, golden pocket structures, market maker behavior, and liquidation cluster tracking into one high-confluence system.
Core Features:
• 📐 Golden Pocket Zones: Dynamic GP levels from daily, weekly, monthly, and yearly timeframes. These levels update in real-time and serve as confluence zones for entries and exits.
• 📊 WaveTrend Divergence Diamonds: Momentum shifts are detected using a custom filtered WaveTrend cross system to mark high-probability reversal conditions.
• 🧠 Market Maker Premium Divergence: Tracks price dislocation between CME and Binance to detect large player manipulation using a configurable premium threshold.
• 💎 MM Reversal Diamonds: Identifies potential market maker traps and large player pivots using historical candle behavior, EMA alignment, and price structure breaks.
• 📉 Stealth Liquidation Cluster Arrows: Volume-based liquidation pressure visualized as lightweight directional arrows based on calculated wick expansion and volume bursts. Highlights key zones where price is likely to bounce or reject.
• 🧭 Trend Validation: Uses volume-based trend conditions and short-term EMA positioning to further qualify signals and eliminate noise.
How to Use:
This indicator is designed to help traders visualize confluence between key institutional price levels, momentum shifts, and volume-based pressure points. Long/short opportunities can be explored at marked reversal diamonds or liquidation zones that align with key GP levels. Intended for use on higher timeframes (15m to 4H), though flexible across any pair or market.

Smart Directional Fib Zone (Selectable Session)🎯 Overview
This indicator plots a dynamic Fibonacci zone between the 0.5 and 0.618 levels , calculated from the previous day’s price action , and is designed specifically for intraday traders.
It visually highlights key retracement or reaction areas where the market often pauses or reverses.
🔍 How it works
At the start of each day, the script automatically captures:
the previous day’s open (pdo),
high (pdh),
low (pdl),
and close (pdc).
It then determines if the previous day was bullish (Close > Open) or bearish (Close < Open).
Based on that:
If the previous day was bullish, it projects the Fibonacci levels down from the high (typical for expecting retracements).
If bearish, it projects them up from the low.
The two key levels are:
0.5 (50%) retracement / projection
0.618 (61.8%) retracement / projection
A colored zone is plotted between these levels to act as a leading guide for intraday setups.
⏰ Time filtering & session customization
A unique feature is the dynamic session filtering:
By default, the zone is only plotted during active market hours, keeping your chart clean outside trading hours.
The script provides a dropdown selector so you can quickly switch between:
India session (9:15 to 15:30)
Europe session (9:00 to 17:30)
US session (9:30 to 16:00)
Or even define your own custom session times.
This makes it ideal for intraday traders in any region.
🎨 Visual features
The fill zone changes color based on the previous day’s sentiment:
Green zone if the previous day was bullish
Red zone if the previous day was bearish
🚨 Alerts
The script includes an alert condition, so you can easily set up TradingView alerts to notify you when:
Price enters the Fibonacci zone.
This is extremely helpful for catching retracements or reversals without staring at the screen all day.
⚙️ How to use
✅ Works on any intraday timeframe (1 min, 5 min, 15 min, etc.).
✅ Simply add it to your chart, pick your session in the dropdown, and watch the Fibonacci zone automatically adjust to your selected market hours.
Use it as a confluence tool alongside other indicators like VWAP, EMAs, Bollinger Bands, or price action patterns to time entries and exits.
💪 Why this is powerful
This is more than a simple Fib retracement tool:
It dynamically adapts to the previous day’s sentiment, helping you trade in alignment with recent market psychology.
The session filtering ensures your charts are focused only on the periods

IDKFAIDKFA - Advanced Order Blocks & Volume Profile with Market Structure Analysis
Why IDKFA?
Named after the legendary DOOM cheat code that gives players "all weapons and full ammo," IDKFA provides traders with a comprehensive arsenal of market analysis tools. Just as the cheat code arms players with everything needed for combat, this indicator equips traders with essential market structure tools: Order Blocks, Volume Profile, LVN/HVN areas, Fibonacci retracements, and intelligent buy/sell signals - all in one unified system.
Core Features
Order Blocks Detection
Automatically identifies institutional order blocks using pivot high/low analysis
Extends blocks dynamically until price interaction occurs
Bullish blocks (demand zones) and bearish blocks (supply zones)
Customizable opacity and extend functionality
Advanced Volume Profile
Real-time volume profile calculation for multiple session types
Point of Control (POC), Value Area High (VAH), and Value Area Low (VAL)
Mode 1: Side-by-side bull/bear volume display
Mode 2: Overlapped volume display with percentage analysis
Shows buying vs selling pressure at each price level
LVN/HVN Area Detection
Low Volume Nodes (LVN): Areas below VAL where price moves quickly
High Volume Nodes (HVN): Areas above VAH with strong resistance
NPOC (Naked Point of Control): Single print areas within Value Area
Volume-based gradient coloring shows relative activity levels
Smart Fibonacci Retracements
Auto-detects trend direction for proper fibonacci orientation
Dynamic color coding: Red levels in uptrends, Gold in downtrends
Special 88.6% level turns lime green in downtrends
Key levels: 23.6%, 38.2%, 50%, 61.8%, 65%, 78.6%, 88.6%
Intelligent Signal System
Works best on higher timeframes
Identifies high-probability reversal setups at key levels
Buy signals: Large bearish rejection followed by bullish reclaim
Sell signals: Large bullish rejection followed by bearish breakdown
Signals only trigger near significant support/resistance areas
Signal Analysis & Usage Guidelines
Buy Signal Mechanics
The buy signal triggers when:
Previous candle shows significant bearish movement (minimum ATR multiplier)
Current candle reclaims a configurable percentage of the previous candle's range
Price is near a key support level (order blocks, fibonacci, volume levels)
Sell Signal Mechanics
The sell signal triggers when:
Previous candle shows significant bullish movement (minimum ATR multiplier)
Current candle rejects below a configurable percentage of the previous candle's range
Price is near a key resistance level (order blocks, fibonacci, volume levels)
When to TAKE Signals
High Probability Buy Signals:
Signal appears AT or BELOW the VAL (Value Area Low)
Signal occurs at bullish order block confluence
Price is in LVN area below VAL (momentum acceleration zone)
Signal aligns with fibonacci 61.8% or 78.6% support
Multiple session POC levels provide support confluence
Previous session's VAL acting as current support
High Probability Sell Signals:
Signal appears AT or ABOVE the VAH (Value Area High)
Signal occurs at bearish order block confluence
Price is in HVN area above VAH (heavy resistance zone)
Signal aligns with fibonacci 61.8% or 78.6% resistance
Multiple session POC levels provide resistance confluence
Previous session's VAH acting as current resistance
When to AVOID Signals
Avoid Buy Signals When:
Signal appears ABOVE the VAH (buying into resistance)
Price is in HVN red zones (high volume resistance areas)
No clear support structure below current price
Volume profile shows heavy selling pressure (high bear percentages)
Signal occurs during low-volume periods between major sessions
Multiple bearish order blocks exist below current price
Avoid Sell Signals When:
Signal appears BELOW the VAL (selling into support)
Price is in LVN green zones (momentum could continue)
No clear resistance structure above current price
Volume profile shows heavy buying pressure (high bull percentages)
Signal occurs during Asian session ranges without clear direction
Multiple bullish order blocks exist above current price
Volume Profile Context for Signals
Understanding Bull/Bear Percentages:
70%+ Bull dominance at a level = Strong support expected
70%+ Bear dominance at a level = Strong resistance expected
50/50 Split = Neutral zone, less predictable
Use percentages to gauge conviction behind moves
POC (Point of Control) Interactions:
Signals above POC in uptrend = Higher probability
Signals below POC in downtrend = Higher probability
Signals against POC bias require extra confirmation
POC often acts as magnetic level for price return
Trading Strategies
Strategy 1: VAL/VAH Bounce Strategy
Wait for price to approach VAL (support) or VAH (resistance)
Look for signal confirmation at these critical levels
Enter with tight stops beyond the Value Area
Target opposite boundary or next session's levels
Strategy 2: Order Block + Volume Confluence
Identify order block alignment with VAL/VAH
Wait for signal within the confluence zone
Enter on signal with stop beyond order block
Use LVN areas as acceleration zones for targets
Strategy 3: LVN/HVN Strategy
LVN (Green) Areas: "Go Zones" - expect quick price movement through low volume
HVN (Red) Areas: "Stop Zones" - expect resistance and potential reversals
NPOC Areas: "Fill Zones" - price often returns to fill single print gaps
Strategy 4: Multi-Session Analysis
Use Daily/Weekly for major structure context
Use 4H for intermediate levels
Use 1H for precise entry timing
Ensure all timeframes align before taking signals
Strategy 5: Fibonacci + Volume Profile
Buy signals at 61.8% or 78.6% fibonacci near VAL
Sell signals at 61.8% or 78.6% fibonacci near VAH
Use 88.6% level as final support/resistance before major moves
50% level often aligns with POC for confluence
Signal Quality Assessment
Grade A Signals (Highest Probability):
Signal at VAL/VAH with order block confluence
Fibonacci level alignment (61.8%, 78.6%)
Volume profile shows 70%+ dominance in signal direction
Multiple timeframe structure alignment
Signal occurs during high-volume sessions (London/NY)
Grade B Signals (Moderate Probability):
Signal near POC with some confluence
Fibonacci 50% or 38.2% alignment
Mixed volume profile readings (50-70% dominance)
Some timeframe alignment present
Signal during overlap sessions
Grade C Signals (Lower Probability):
Signal with minimal confluence
Weak fibonacci alignment or none
Volume profile neutral or against signal
Conflicting timeframe signals
Signal during low-volume periods
Risk Management Guidelines
Position Sizing Based on Signal Quality:
Grade A: Standard position size
Grade B: Reduced position size (50-75%)
Grade C: Minimal position size (25%) or skip entirely
Stop Loss Placement:
Beyond order block boundaries
Outside Value Area (VAL/VAH)
Below/above fibonacci confluence levels
Account for session volatility ranges
Profit Targets:
First target: Opposite VAL/VAH boundary
Second target: Next session's key levels
Final target: Major order blocks or fibonacci extensions
Credits & Attribution
Original components derived from:
Market Sessions & Volume Profile by © Leviathan (Mozilla Public License 2.0)
Volume Profile elements inspired by @LonesomeTheBlue's volume profile script
Pivot Order Blocks by TradingWolf / © MensaTrader (Mozilla Public License 2.0)
Auto Fibonacci Retracement code (public domain)
Significant enhancements and modifications include:
Advanced LVN/HVN detection and visualization
Bull/Bear percentage analysis for Mode 2/3
Comprehensive alert system with market context
Integrated buy/sell signals at key levels
Performance optimizations and extended session support
Enhanced Mode 2/3 with percentage pressure analysis
Important Disclaimers
This indicator is a technical analysis tool designed for educational purposes. It does not provide financial advice, investment recommendations, or trading signals that guarantee profits. All trading involves substantial risk of loss, and past performance does not guarantee future results. Users should conduct their own research, understand the risks involved, and consider consulting with qualified financial advisors before making trading decisions. The signals and analysis provided are based on historical price patterns and volume data, which may not predict future market movements accurately.
Best Practices
Never trade signals blindly - always consider volume profile context
Wait for confluence between multiple tools before entering
Respect the Value Area - avoid buying above VAH or selling below VAL
Use session context - Asian ranges vs London/NY breakouts
Practice proper risk management - position size based on signal quality
Understand the bigger picture - use multiple timeframes for context
Remember: Like the IDKFA cheat code, having all the tools doesn't guarantee success. The key is learning to use them together effectively and understanding when NOT to take a signal is often more important than knowing when to take one.

Session Range ProjectionsSession Range Projections
Purpose & Concept:
Session Range Projections is a comprehensive trading tool that identifies and analyzes price ranges during user-defined time periods. The indicator visualizes high-probability reversal zones and profit targets by projecting Fibonacci levels from custom session ranges, making it ideal for traders who focus on time-based market structure analysis.
Key Features & Calculations:
1. Custom Time Range Analysis
- Define any time period for range calculation - from traditional sessions (Asian, London, NY) to custom periods like opening ranges, hourly ranges, or 4-hour blocks
- Automatically captures the highest and lowest prices within your specified timeframe
- Supports multiple timezone selections for global market analysis
- Flexible enough for intraday scalping ranges or longer-term swing trading setups
2. Premium & Discount Zones
- Automatically divides the range into premium (above 50%) and discount (below 50%) zones
- Visual differentiation helps identify institutional buying and selling areas
- Color-coded boxes clearly mark these critical price zones
3. Optimal Trade Entry (OTE) Zones
- Highlights the 79-89% retracement zone in premium territory
- Highlights the 11-21% retracement zone in discount territory
- These zones represent high-probability reversal areas based on institutional order flow concepts
4. Fibonacci Projections
- Projects 11 customizable Fibonacci extension levels from the range extremes
- Levels extend both above and below the range for symmetrical analysis
- Each level can be individually toggled and color-customized
- Default levels include common retracement ratios: -0.5, -1.0, -2.0, -2.33, -2.5, -3.0, -4.0, -4.5, -6.0, -7.0, -8.0
How to Use:
Set Your Time Range: Input your desired session start and end times (24-hour format)
Select Timezone: Choose the appropriate timezone for your trading session
Customize Display: Toggle various visual elements based on your preferences
Monitor Price Action: Watch for reactions at projected levels and OTE zones
Set Alerts: Configure sweep alerts for when price breaks above/below range extremes
Input Parameters Explained:
Time Range Settings
Range Start/End Hour & Minute: Define your analysis period
Time Zone: Ensure accurate session timing across different markets
Visual Settings
Range Box: Toggle the premium/discount zone visualization
Horizontal Lines: Customize high/low line appearance
Internal Range Levels: Show/hide equilibrium and OTE zones
Labels: Configure text display for key levels
Fibonacci Projections: Enable/disable extension levels
Display Settings
Historical Ranges: Show up to 10 previous session ranges
Alert Type: Choose between high sweep, low sweep, or both
Trading Applications:
Session-Based Trading: Analyze specific market sessions (Asian, London, New York, opening ranges, hourly ranges)
Reversal Trading: Identify high-probability reversal zones at OTE levels
Breakout/Reversal Trading: Monitor range breaks/reversals with built-in sweep alerts
Risk Management: Use Fibonacci projections as profit targets or rejection areas
Multi-Timeframe Analysis: Apply to any timeframe for various trading styles
Important Notes:
This indicator is for educational purposes only and should not be considered financial advice
Past performance does not guarantee future results
Always use proper risk management when trading
The indicator automatically manages historical data to maintain chart performance

Fibonacci Entry Bands [AlgoAlpha]OVERVIEW
This script plots Fibonacci Entry Bands, a trend-following and mean-reversion hybrid system built around dynamic volatility-adjusted bands scaled using key Fibonacci levels. It calculates a smoothed basis line and overlays multiple bands at fixed Fibonacci multipliers of either ATR or standard deviation. Depending on the trend direction, specific upper or lower bands become active, offering a clear framework for entry timing, trend identification, and profit-taking zones.
CONCEPTS
The core idea is to use Fibonacci levels—0.618, 1.0, 1.618, and 2.618—as multipliers on a volatility measure to form layered price bands around a trend-following moving average. Trends are defined by whether the basis is rising or falling. The trend determines which side of the bands is emphasized: upper bands for downtrends, lower bands for uptrends. This approach captures both directional bias and extreme price extensions. Take-profit logic is built in via crossovers relative to the outermost bands, scaled by user-selected aggressiveness.
FEATURES
Basis Line – A double EMA smoothing of the source defines trend direction and acts as the central mean.
Volatility Bands – Four levels per side (based on selected ATR or stdev) mark the Fibonacci bands. These become visible only when trend direction matches the side (e.g., only lower bands plot in an uptrend).
Bar Coloring – Bars are shaded with adjustable transparency depending on distance from the basis, with color intensity helping gauge overextension.
Entry Arrows – A trend shift triggers either a long or short signal, with a marker at the outermost band with ▲/▼ signs.
Take-Profit Crosses – If price rejects near the outer band (based on aggressiveness setting), a cross appears marking potential profit-taking.
Bounce Signals – Minor pullbacks that respect the basis line are marked with triangle arrows, hinting at continuation setups.
Customization – Users can toggle bar coloring, signal markers, and select between ATR/stdev as well as take-profit aggressiveness.
Alerts – All major signals, including entries, take-profits, and bounces, are available as alert conditions.
USAGE
To use this tool, load it on your chart, adjust the inputs for volatility method and aggressiveness, and wait for entries to form on trend changes. Use TP crosses and bounce arrows as potential exit or scale-in signals.

Daily Fibonacci Levels [Asa]This indicator plots dynamic daily Fibonacci levels based on the overnight session high and low, helping traders identify key price zones for potential reversals, breakouts, and pullbacks during the regular trading session.
Key Features:
Overnight Session High/Low Detection: Automatically captures the high and low between user-defined hours (default 16:00–09:30 EST).
Day Session Levels: Fibonacci retracement and extension levels are calculated once the regular session begins (default 09:30–16:00 EST).
Proximity Filter: Only plots levels that are within a customizable threshold of the current price to reduce chart clutter.
Custom Styling: Choose from solid lines, crosses, or circles, and customize the line width for a personalized look.
Mirrored Extensions: Includes both upside and downside Fibonacci extensions beyond the 100% level (up to 300%).
Labels: Clearly marks the overnight high and low with labeled points at session start.
Use Case:
Ideal for intraday and swing traders who rely on overnight price action to map out key Fibonacci levels before and during the trading day. This tool helps quickly identify zones of confluence, potential resistance/support, and continuation levels.
Customization Options:
Session hours and timezone
Line width and style
Proximity threshold for level visibility
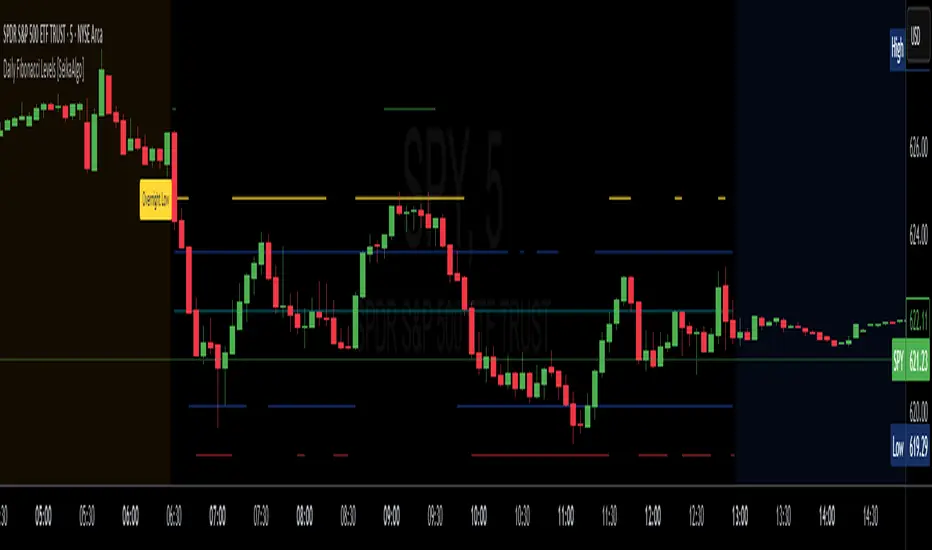
Smooth Fibonacci BandsSmooth Fibonacci Bands
This indicator overlays adaptive Fibonacci bands on your chart, creating dynamic support and resistance zones based on price volatility. It combines a simple moving average with ATR-based Fibonacci levels to generate multiple bands that expand and contract with market conditions.
## Features
- Creates three pairs of upper and lower Fibonacci bands
- Smoothing option for cleaner, less noisy bands
- Fully customizable colors and line thickness
- Adapts automatically to changing market volatility
## Settings
Adjust the SMA and ATR lengths to match your trading timeframe. For short-term trading, try lower values; for longer-term analysis, use higher values. The Fibonacci factors determine how far each band extends from the center line - standard Fibonacci ratios (1.618, 2.618, and 4.236) are provided as defaults.
## Trading Applications
- Use band crossovers as potential entry and exit signals
- Look for price bouncing off bands as reversal opportunities
- Watch for price breaking through multiple bands as strong trend confirmation
- Identify potential support/resistance zones for placing stop losses or take profits
Fibonacci Bands combines the reliability of moving averages with the adaptability of ATR and the natural market harmony of Fibonacci ratios, offering a robust framework for both trend and range analysis.
Death Metal Fire & IceA dynamic support/resistance system built from modified Fibonacci-based moving averages, designed to assist with structure identification in trending markets — particularly when price is moving into uncharted territory.
🧠 Core Logic
Twelve Fibonacci-based moving averages are mathematically adjusted by the square root of a standard trading Fibonacci ratio to create projected zones above and around price. These dynamic levels are labeled L1 to L12 and automatically adjust with trend velocity and volatility.
Faster levels (L1–L5) often serve as immediate reaction zones in volatile markets and provide ceilings for rising price action.
Slower levels (L6–L12) tend to behave as longer-term structure — both above and below current price.
These levels are dynamic, non-static, and provide forward-looking structure that adapts as markets move. Price tends to range between these levels until conditions change, which becomes visually apparent through the breaking of support/resistance.
⚙️ Features
Smart Mode: Hides levels that are not relevant to current price proximity. Price action needs to get within 10% of the level for it to appear. If price action moves away from the level, there will be a cooldown period for the line to cease printing on the chart.
Gradient Mode: Fills space between levels with a visual overlay to help visualize distance and potential volatility.
Levels can be toggled on/off individually.
🧩 Use Case
Designed for trending markets where traditional support/resistance is unavailable or unreliable.
Applicable across all assets and timeframes — stocks, crypto, futures, etc.

Adaptive Support & Resistance Levels [StabTrading]The Adaptive S&R Levels indicator is designed to study support and resistance levels by synthesizing multiple well-known techniques for identifying these zones. It aims to provide traders with reliable price levels that reflect the collective perspective of market participants, using historical price action and projective techniques for extreme conditions.
💡 Introduction: Identified Problem
Traders often draw support and resistance lines using varied methods, leading to inconsistencies in where these levels are placed on charts. This variability can reduce the effectiveness of individual levels, as price may not react strongly to zones that lack broad recognition. The Adaptive S&R Levels indicator addresses this by aggressively averaging multiple established techniques to create support and resistance lines that align with what most traders are likely to identify, increasing the probability of price reactions.
🚀 How it Works: Overview
The indicator employs a multi-technique algorithm to generate support and resistance levels, ensuring they represent a consensus of trader perspectives.
🚀 How it Works: Chart Levels Display and Styling
Support levels, displayed in green below the current price, and resistance levels, shown in red above the price, are plotted clearly on the chart. Levels are numbered sequentially (e.g., v1, v2) as they move further from the current price, providing a visual hierarchy of proximity. Extreme levels, labeled as "Extreme Support" or "Extreme Resistance," are plotted in a bolder color to distinguish them as the outermost boundaries, maintaining the same green (support) and red (resistance) color scheme for consistency.
🚀 How it Works: Historical Price Action Algorithm
For areas with available historical data, the algorithm analyzes price action using a variety of recognized methods for drawing support and resistance, such as pivot points, swing highs/lows, and volume-based zones. It calculates a weighted average of these techniques to produce a “regression fit” line that reflects the accumulation of levels traders might draw. By prioritizing areas where multiple methods converge, the indicator identifies zones likely to be significant to a wide audience, enhancing their relevance.
🚀 How it Works: Projective Techniques Algorithm
In scenarios without recent historical price action—such as all-time highs or lows—the indicator employs an alternative algorithm that combines projective techniques commonly used by traders. These include Fibonacci extensions, Measured Moves (price projections), Psychological Milestones (e.g., round numbers), Channel/Trendline Extrapolation, and Time-Based Targets (inspired by methods like Gann techniques). The algorithm seeks a confluence of these methods to draw support and resistance levels that align with what most traders would consider significant in such conditions. These levels maintain the same green (support) and red (resistance) color scheme, with numbering based on their distance from the price.
🚀 How it Works: Noise Parameter Adjustment
Users can adjust a noise parameter to control the number of displayed levels. Lower settings show more lines, reflecting a broader range of potential zones but with less confluence. Higher settings increase the required confluence of techniques, resulting in fewer lines that have a higher probability of eliciting a price reaction. This customization allows traders to tailor the indicator to their preferred timeframe or trading style.
🔥 Features
Confluence-Based Levels: Support and resistance lines are derived from a weighted average of multiple techniques, aiming to mirror the levels most traders would recognize.
Extreme Levels: Generates support and resistance in areas without historical price action, using techniques like Fibonacci extensions and Measured Moves.
Color-Coded Display: Green support levels appear below the current price, and red resistance levels appear above, with extreme levels in a bolder shade for distinction.
Adjustable Noise Parameter: Users can modify the confluence threshold to display more lines (lower settings) or fewer, higher-probability lines (higher settings).
📈 Implementing the System
1. Adjust Settings
Set the noise parameter based on your trading style (0.1 to 10).
Use lower values for more frequent levels, suitable for scalping or short-term analysis.
Use higher values for fewer, higher-confluence levels, ideal for swing trading or longer-term strategies.
Adjust for your timeframe: Settings tend to be lower on shorter timeframes and higher on longer timeframes.
2. Identify Levels
Monitor green support levels below the price for potential buying zones, noting their numbered proximity (v1, v2, etc.).
Observe red resistance levels above the price for potential selling or shorting zones, noting their numbered proximity.
Note extreme levels (labeled "Extreme Support" or "Extreme Resistance") in areas like all-time highs, which may act as key reversal points.
3. Evaluate Price Reactions
Track how price interacts with the plotted levels to assess their effectiveness, considering their proximity to price.
Observe performance in bullish, bearish, or ranging markets to understand the indicator’s behavior at different levels.
Test different noise parameter settings across various assets and timeframes to find the optimal balance for your approach.
4. Layering Trades with Levels
Use the numbered levels to layer into a trade: for example, enter a partial position at a closer support level (e.g., v1) and add to it at a further level (e.g., v2) if price continues to decline, spreading risk across multiple zones.
Layer out of a trade by taking partial profits at each resistance level as price rises (e.g., reduce position at v1, then v2), or fully exit at an "Extreme Resistance" level to maximize gains while managing exposure.
🔶 Conclusion
The Adaptive S&R Levels indicator provides a framework for studying support and resistance by averaging multiple trader-recognized techniques. With its ability to handle both historical and extreme price scenarios, numbered levels for visual hierarchy, and customizable noise settings, it offers a versatile tool for analyzing key price levels. Designed for educational use, it encourages traders to test and observe how these consensus-driven levels align with market behavior within broader analysis.
