ETH Signal 15m
This strategy uses the Supertrend indicator combined with RSI to generate buy and sell signals, with stop loss (SL) and take profit (TP) conditions based on ATR (Average True Range). Below is a detailed explanation of each part:
1. General Information BINANCE:ETHUSDT.P
Strategy Name: "ETH Signal 15m"
Designed for use on the 15-minute time frame for the ETH pair.
Default capital allocation is 15% of total equity for each trade.
2. Backtest Period
start_time and end_time: Define the start and end time of the backtest period.
start_time = 2024-08-01: Start date of the backtest.
end_time = 2054-01-01: End date of the backtest.
The strategy will only run when the current time falls within this specified range.
3. Supertrend Indicator
Supertrend is a trend-following indicator that provides buy or sell signals based on the direction of price changes.
factor = 2.76: The multiplier used in the Supertrend calculation (increasing this value makes the Supertrend less sensitive to price movements).
atrPeriod = 12: Number of periods used to calculate ATR.
Output:
direction: Determines the buy/sell direction based on Supertrend.
If direction decreases, it signals a buy (Long).
If direction increases, it signals a sell (Short).
4. RSI Indicator
RSI (Relative Strength Index) is a momentum indicator, often used to identify overbought or oversold conditions.
rsiLength = 12: Number of periods used to calculate RSI.
rsiOverbought = 70: RSI level considered overbought.
rsiOversold = 30: RSI level considered oversold.
5. Entry Conditions
Long Entry:
Supertrend gives a buy signal (ta.change(direction) < 0).
RSI must be below the overbought level (rsi < rsiOverbought).
Short Entry:
Supertrend gives a sell signal (ta.change(direction) > 0).
RSI must be above the oversold level (rsi > rsiOversold).
The strategy will only execute trades if the current time is within the backtest period (in_date_range).
6. Stop Loss (SL) and Take Profit (TP) Conditions
ATR (Average True Range) is used to calculate the distance for Stop Loss and Take Profit based on price volatility.
atr = ta.atr(atrPeriod): ATR is calculated using 12 periods.
Stop Loss and Take Profit are calculated as follows:
Long Trade:
Stop Loss: Set at close - 4 * atr (current price minus 4 times the ATR).
Take Profit: Set at close + 2 * atr (current price plus 2 times the ATR).
Short Trade:
Stop Loss: Set at close + 4 * atr (current price plus 4 times the ATR).
Take Profit: Set at close - 2.237 * atr (current price minus 2.237 times the ATR).
Summary:
This strategy enters a Long trade when the Supertrend indicates an upward trend and RSI is not in the overbought region. Conversely, a Short trade is entered when Supertrend signals a downtrend, and RSI is not oversold.
The trade is exited when the price reaches the Stop Loss or Take Profit levels, which are determined based on price volatility (ATR).
Disclaimer:
The content provided in this strategy is for informational and educational purposes only. It is not intended as financial, investment, or trading advice. Trading in cryptocurrency, stocks, or any financial markets involves significant risk, and you may lose more than your initial investment. Past performance is not indicative of future results, and no guarantee of profit can be made. You should consult with a professional financial advisor before making any investment decisions. The creator of this strategy is not responsible for any financial losses or damages incurred as a result of following this strategy. All trades are executed at your own risk.
Analisis Fundamental

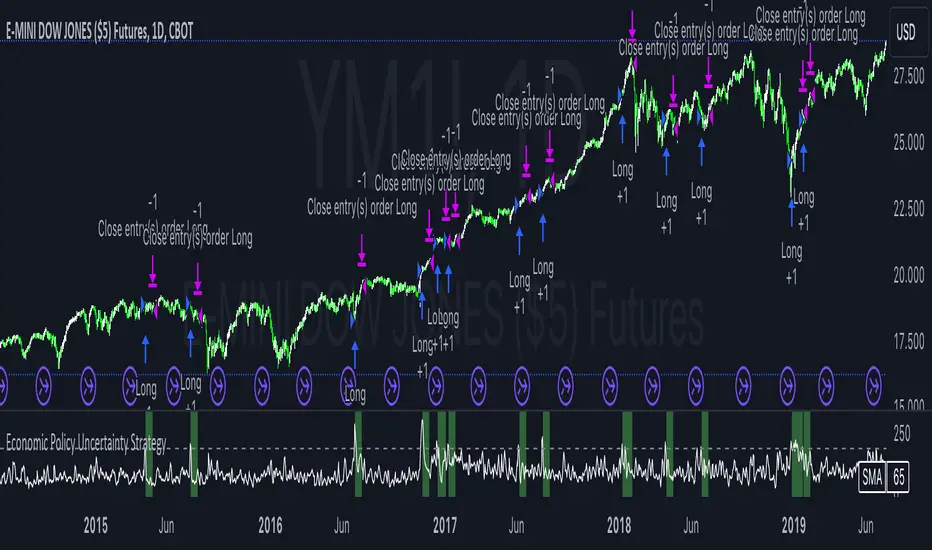
Economic Policy Uncertainty StrategyThis Pine Script strategy is designed to make trading decisions based on the Economic Policy Uncertainty Index for the United States (USEPUINDXD) using a Simple Moving Average (SMA) and a dynamic threshold. The strategy identifies opportunities by entering long positions when the SMA of the Economic Policy Uncertainty Index crosses above a user-defined threshold. An exit is triggered after a set number of bars have passed since the trade was opened. Additionally, the background is highlighted in green when a position is open to visually indicate active trades.
This strategy is intended to be used in portfolio management and trading systems where economic policy uncertainty plays a critical role in decision-making. The index provides insight into macroeconomic conditions, which can affect asset prices and investment returns.
The Economic Policy Uncertainty (EPU) Index is a significant metric used to gauge uncertainty related to economic policies in the United States. This index reflects the frequency of newspaper articles discussing economic uncertainty, government policies, and their potential impact on the economy. It has become a popular indicator for both academics and practitioners to analyze the effects of policy uncertainty on various economic and financial outcomes.
Importance of the EPU Index for Portfolio Decisions:
Economic Policy Uncertainty and Investment Decisions:
Research by Baker, Bloom, and Davis (2016) introduced the Economic Policy Uncertainty Index and explored how increased uncertainty leads to delays in investment and hiring decisions. Their study shows that heightened uncertainty, as captured by the EPU index, is associated with a contraction in economic activity and lower stock market returns. Investors tend to shift their portfolios towards safer assets during periods of high policy uncertainty .
Impact on Asset Prices:
Gulen and Ion (2016) demonstrated that policy uncertainty adversely affects corporate investment, leading to lower stock market returns. The study emphasized that firms reduce investment during periods of high policy uncertainty, which can significantly impact the pricing of risky assets. Consequently, portfolio managers need to account for policy uncertainty when making asset allocation decisions .
Global Implications:
Policy uncertainty is not only a domestic issue. Brogaard and Detzel (2015) found that U.S. economic policy uncertainty has significant spillover effects on global financial markets, affecting equity returns, bond yields, and foreign exchange rates. This suggests that global investors should incorporate U.S. policy uncertainty into their risk management strategies .
These studies underscore the importance of the Economic Policy Uncertainty Index as a tool for understanding macroeconomic risks and making informed portfolio management decisions. Strategies that incorporate the EPU index, such as the one described above, can help investors navigate periods of uncertainty by adjusting their exposure to different asset classes based on economic conditions.
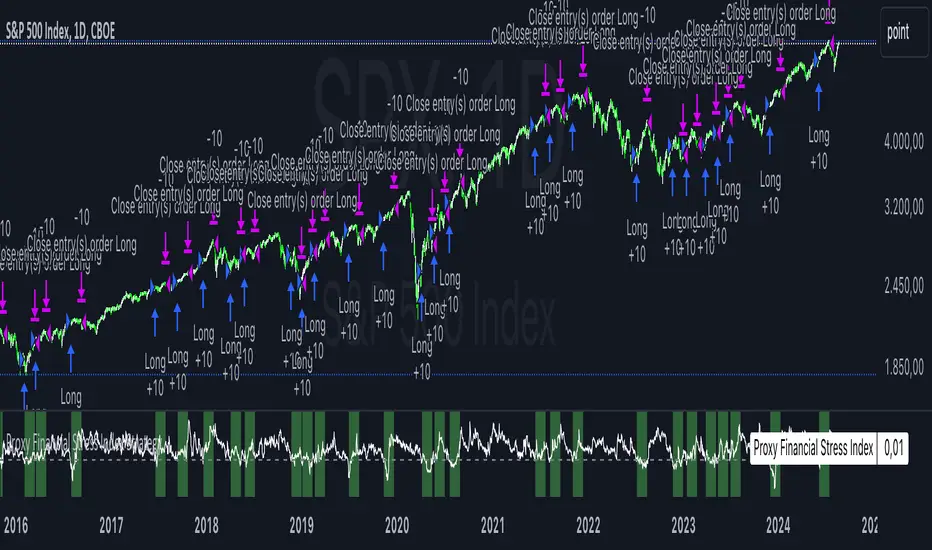
Proxy Financial Stress Index StrategyThis strategy is based on a Proxy Financial Stress Index constructed using several key financial indicators. The strategy goes long when the financial stress index crosses below a user-defined threshold, signaling a potential reduction in market stress. Once a position is opened, it is held for a predetermined number of bars (periods), after which it is automatically closed.
The financial stress index is composed of several normalized indicators, each representing different market aspects:
VIX - Market volatility.
US 10-Year Treasury Yield - Bond market.
Dollar Index (DXY) - Currency market.
S&P 500 Index - Stock market.
EUR/USD - Currency exchange rate.
High-Yield Corporate Bond ETF (HYG) - Corporate bond market.
Each component is normalized using a Z-score (based on the user-defined moving average and standard deviation lengths) and weighted according to user inputs. The aggregated index reflects overall market stress.
The strategy enters a long position when the stress index crosses below a specified threshold from above, indicating reduced financial stress. The position is held for a defined holding period before being closed automatically.
Scientific References:
The concept of a financial stress index is derived from research that combines multiple financial variables to measure systemic risks in the financial markets. Key research includes:
The Financial Stress Index developed by various Federal Reserve banks, including the Cleveland Financial Stress Index (CFSI)
Bank of America Merrill Lynch Option Volatility Estimate (MOVE) Index as a measure of interest rate volatility, which correlates with financial stress
These indices are widely used in economic research to gauge financial instability and help in policy decisions. They track real-time fluctuations in various markets and are often used to anticipate economic downturns or periods of high financial risk.
[INVX] Post-Earnings Announcement DriftWhat does this strategy do?
This Pine Script strategy implements the Post-earnings announcement drift (PEAD) strategy, which is a financial market anomaly where a stock's price tends to drift in the direction of the firm's earnings surprise for an extended period of time.
Ref: en.wikipedia.org
An earnings announcement is an official public statement of a company's profitability for a specific time period, typically a quarter or a year. It includes various financial metrics but the most watched figure is the Earnings Per Share (EPS). Analysts estimate the EPS before the announcement, and the actual EPS is compared to this estimate to determine if there was an earnings surprise.
An earnings surprise occurs when the actual EPS is significantly different from the analysts' estimates. A positive earnings surprise indicates that the actual EPS is higher than the estimate, while a negative earnings surprise suggests the EPS is lower than anticipated.
The script takes the following inputs
" Holding periods (bar) " : This input defines the number of periods (or bars) the script will hold a position after the earnings announcement.
" Surprise threshold (%) ": This input sets the minimum percentage for an earnings surprise, which triggers the strategy to enter either a long or short position. In essence, it represents the minimum deviation between the estimated and actual Earnings Per Share (EPS) that will trigger a trade. A higher threshold may lead to fewer, potentially more significant trades, while a lower threshold might result in more frequent, possibly less impactful trades. This parameter allows you to adjust the sensitivity of the strategy to earnings surprises.
Positive earnings surprise
After the earnings announcement, the script compares the actual EPS with the estimated EPS to identify an earnings surprise. If there is a positive earnings surprise, the script will enter a long position. A long position is a bullish strategy where the investor expects the stock price to rise.
Negative earnings surprise
On the other hand, if there is a negative earnings surprise, the script will enter a short position. A short position is a bearish strategy where the investor expects the stock price to fall.
In both scenarios, the position (either long or short) is held for the number of periods specified in the "Holding periods (bar)" input. This strategy is based on the assumption that the stock price will continue to drift in the direction of the earnings surprise for the specified holding period.
Disclaimer: The script provided herein is for educational purposes only. It should not be considered as investment advice or a recommendation of any particular security, strategy or investment product. Past performance is not indicative of future results.
The results of the Pine Script backtesting are hypothetical and should not be considered as a true reflection of the results that might be achieved in a live trading environment. The backtest results are based on historical data and may not take into account certain factors such as actual transaction costs, taxes, or changes in market conditions.
Investors should consult with their financial advisor before making any investment decisions. All investments involve risk, including the potential loss of all invested capital.

Intelle_city - World Cycle - Ath & Atl - Logarithmic - Strategy.Overview
Indicators: Strategy !
INTELLECT_city - World Cycle - ATH & ATL - Timeframe 1D and 1W - Logarithmic - Strategy - The Pi Cycle Top and Bottom Oscillator is an adaptation of the original Pi Cycle Top chart. It compares the 111-Day Moving Average circle and the 2 * 350-Day Moving Average circle of Bitcoin’s Price. These two moving averages were selected as 350 / 111 = 3.153; An approximation of the important mathematical number Pi.
When the 111-Day Moving Average circle reaches the 2 * 350-Day Moving Average circle, it indicates that the market is becoming overheated. That is because the mid time frame momentum reference of the 111-Day Moving Average has caught up with the long timeframe momentum reference of the 2 * 350-Day Moving Average.
Historically this has occurred within 3 days of the very top of each market cycle.
When the 111 Day Moving Average circle falls back beneath the 2 * 350 Day Moving Average circle, it indicates that the market momentum of that cycle is significantly cooling down. The oscillator drops down into the lower green band shown where the 111 Day Moving Average is moving at a 75% discount relative to the 2 * 350 Day Moving Average.
Historically, this has highlighted broad areas of bear market lows.
IMPORTANT: You need to set a LOGARITHMIC graph. (The function is located at the bottom right of the screen)
IMPORTANT: The INTELLECT_city indicator is made for a buy-sell strategy; there is also a signal indicator from INTELLECT_city
IMPORTANT: The Chart shows all cycles, both buying and selling.
IMPORTANT: Suitable timeframes are 1 daily (recommended) and 1 weekly
-----------------------------
Описание на русском:
-----------------------------
Обзор индикатора
INTELLECT_city - World Cycle - ATH & ATL - Timeframe 1D and 1W - Logarithmic - Strategy - Логарифмический - Сигнал - Осциллятор вершины и основания цикла Пи представляет собой адаптацию оригинального графика вершины цикла Пи. Он сравнивает круг 111-дневной скользящей средней и круг 2 * 350-дневной скользящей средней цены Биткойна. Эти две скользящие средние были выбраны как 350/111 = 3,153; Приближение важного математического числа Пи.
Когда круг 111-дневной скользящей средней достигает круга 2 * 350-дневной скользящей средней, это указывает на то, что рынок перегревается. Это происходит потому, что опорный моментум среднего временного интервала 111-дневной скользящей средней догнал опорный момент импульса длинного таймфрейма 2 * 350-дневной скользящей средней.
Исторически это происходило в течение трех дней после вершины каждого рыночного цикла.
Когда круг 111-дневной скользящей средней опускается ниже круга 2 * 350-дневной скользящей средней, это указывает на то, что рыночный импульс этого цикла значительно снижается. Осциллятор опускается в нижнюю зеленую полосу, показанную там, где 111-дневная скользящая средняя движется со скидкой 75% относительно 2 * 350-дневной скользящей средней.
Исторически это высветило широкие области минимумов медвежьего рынка.
ВАЖНО: Выставлять нужно ЛОГАРИФМИЧЕСКИЙ график. (Находиться функция с правой нижней части экрана)
ВАЖНО: Индикатор INTELLECT_city сделан для стратегии покупок продаж, есть также и сигнальный от INTELLECT_сity
ВАЖНО: На Графике видны все циклы, как на покупку так и на продажу.
ВАЖНО: Подходящие таймфреймы 1 дневной (рекомендовано) и 1 недельный
-----------------------------
Beschreibung - Deutsch
-----------------------------
Indikatorübersicht
INTELLECT_city – Weltzyklus – ATH & ATL – Zeitrahmen 1T und 1W – Logarithmisch – Strategy – Der Pi-Zyklus-Top- und Bottom-Oszillator ist eine Anpassung des ursprünglichen Pi-Zyklus-Top-Diagramms. Er vergleicht den 111-Tage-Gleitenden-Durchschnittskreis und den 2 * 350-Tage-Gleitenden-Durchschnittskreis des Bitcoin-Preises. Diese beiden gleitenden Durchschnitte wurden als 350 / 111 = 3,153 ausgewählt; eine Annäherung an die wichtige mathematische Zahl Pi.
Wenn der 111-Tage-Gleitenden-Durchschnittskreis den 2 * 350-Tage-Gleitenden-Durchschnittskreis erreicht, deutet dies darauf hin, dass der Markt überhitzt. Das liegt daran, dass der Momentum-Referenzwert des 111-Tage-Gleitenden-Durchschnitts im mittleren Zeitrahmen den Momentum-Referenzwert des 2 * 350-Tage-Gleitenden-Durchschnitts im langen Zeitrahmen eingeholt hat.
Historisch gesehen geschah dies innerhalb von 3 Tagen nach dem Höhepunkt jedes Marktzyklus.
Wenn der Kreis des 111-Tage-Durchschnitts wieder unter den Kreis des 2 x 350-Tage-Durchschnitts fällt, deutet dies darauf hin, dass die Marktdynamik dieses Zyklus deutlich nachlässt. Der Oszillator fällt in das untere grüne Band, in dem der 111-Tage-Durchschnitt mit einem Abschlag von 75 % gegenüber dem 2 x 350-Tage-Durchschnitt verläuft.
Historisch hat dies breite Bereiche mit Tiefstständen in der Baisse hervorgehoben.
WICHTIG: Sie müssen ein logarithmisches Diagramm festlegen. (Die Funktion befindet sich unten rechts auf dem Bildschirm)
WICHTIG: Der INTELLECT_city-Indikator ist für eine Kauf-Verkaufs-Strategie konzipiert; es gibt auch einen Signalindikator von INTELLECT_city
WICHTIG: Das Diagramm zeigt alle Zyklen, sowohl Kauf- als auch Verkaufszyklen.
WICHTIG: Geeignete Zeitrahmen sind 1 täglich (empfohlen) und 1 wöchentlich

TASC 2024.06 REIT ETF Trading System█ OVERVIEW
This strategy script demonstrates the application of the Real Estate Investment Trust (REIT) ETF trading system presented in the article by Markos Katsanos titled "Is The Price REIT?" from TASC's June 2024 edition of Traders' Tips .
█ CONCEPTS
REIT stocks and ETFs offer a simplified, diversified approach to real estate investment. They exhibit sensitivity to interest rates, often moving inversely to interest rate and treasury yield changes. Markos Katsanos explores this relationship and the correlation of prices with the broader market to develop a trading strategy for REIT ETFs.
The script employs Bollinger Bands and Donchian channel indicators to identify oversold conditions and trends in REIT ETFs. It incorporates the 10-year treasury yield index (TNX) as a proxy for interest rates and the S&P 500 ETF (SPY) as a benchmark for the overall market. The system filters trade entries based on their behavior and correlation with the REIT ETF price.
█ CALCULATIONS
The strategy initiates long entries (buy signals) under two conditions:
1. Oversold condition
The weekly ETF low price dips below the 15-week Bollinger Band bottom, the closing price is above the value by at least 0.2 * ATR ( Average True Range ), and the price exceeds the week's median.
Either of the following:
– The TNX index is down over 15% from its 25-week high, and its correlation with the ETF price is less than 0.3.
– The yield is below 2%.
2. Uptrend
The weekly ETF price crosses above the previous week's 30-week Donchian channel high.
The SPY ETF is above its 20-week moving average.
Either of the following:
– Over ten weeks have passed since the TNX index was at its 30-week high.
– The correlation between the TNX value and the ETF price exceeds 0.3.
– The yield is below 2%.
The strategy also includes three exit (sell) rules:
1. Trailing (Chandelier) stop
The weekly close drops below the highest close over the last five weeks by over 1.5 * ATR.
The TNX value rises over the latest 25 weeks, with a yield exceeding 4%, or its value surges over 15% above the 25-week low.
2. Stop-loss
The ETF's price declines by at least 8% of the previous week's close and falls below the 30-week moving average.
The SPY price is down by at least 8%, or its correlation with the ETF's price is negative.
3. Overbought condition
The ETF's value rises above the 100-week low by over 50%.
The ETF's price falls over 1.5 * ATR below the 3-week high.
The ETF's 10-week Stochastic indicator exceeds 90 within the last three weeks.
█ DISCLAIMER
This strategy script educates users on the system outlined by the TASC article. However, note that its default properties might not fully represent real-world trading conditions for an individual. By default, it uses 10% of equity as the order size and a slippage amount of 5 ticks. Traders should adjust these settings and the commission amount when using this script. Additionally, since this strategy utilizes compound conditions on weekly data to trigger orders, it will generate significantly fewer trades than other, higher-frequency strategies.

Crypto MVRV ZScore - Strategy [PresentTrading]█ Introduction and How it is Different
The "Crypto Valuation Extremes: MVRV ZScore - Strategy " represents a cutting-edge approach to cryptocurrency trading, leveraging the Market Value to Realized Value (MVRV) Z-Score. This metric is pivotal for identifying overvalued or undervalued conditions in the crypto market, particularly Bitcoin. It assesses the current market valuation against the realized capitalization, providing insights that are not apparent through conventional analysis.
BTCUSD 6h Long/Short Performance
Local
█ Strategy, How It Works: Detailed Explanation
The strategy leverages the Market Value to Realized Value (MVRV) Z-Score, specifically designed for cryptocurrencies, with a focus on Bitcoin. This metric is crucial for determining whether Bitcoin is currently undervalued or overvalued compared to its historical 'realized' price. Below is an in-depth explanation of the strategy's components and calculations.
🔶Conceptual Foundation
- Market Capitalization (MC): This represents the total dollar market value of Bitcoin's circulating supply. It is calculated as the current price of Bitcoin multiplied by the number of coins in circulation.
- Realized Capitalization (RC): Unlike MC, which values all coins at the current market price, RC is computed by valuing each coin at the price it was last moved or traded. Essentially, it is a summation of the value of all bitcoins, priced at the time they were last transacted.
- MVRV Ratio: This ratio is derived by dividing the Market Capitalization by the Realized Capitalization (The ratio of MC to RC (MVRV Ratio = MC / RC)). A ratio greater than 1 indicates that the current price is higher than the average price at which all bitcoins were purchased, suggesting potential overvaluation. Conversely, a ratio below 1 suggests undervaluation.
🔶 MVRV Z-Score Calculation
The Z-Score is a statistical measure that indicates the number of standard deviations an element is from the mean. For this strategy, the MVRV Z-Score is calculated as follows:
MVRV Z-Score = (MC - RC) / Standard Deviation of (MC - RC)
This formula quantifies Bitcoin's deviation from its 'normal' valuation range, offering insights into market sentiment and potential price reversals.
🔶 Spread Z-Score for Trading Signals
The strategy refines this approach by calculating a 'spread Z-Score', which adjusts the MVRV Z-Score over a specific period (default: 252 days). This is done to smooth out short-term market volatility and focus on longer-term valuation trends. The spread Z-Score is calculated as follows:
Spread Z-Score = (Market Z-Score - MVVR Ratio - SMA of Spread) / Standard Deviation of Spread
Where:
- SMA of Spread is the simple moving average of the spread over the specified period.
- Spread refers to the difference between the Market Z-Score and the MVRV Ratio.
🔶 Trading Signals
- Long Entry Condition: A long (buy) signal is generated when the spread Z-Score crosses above the long entry threshold, indicating that Bitcoin is potentially undervalued.
- Short Entry Condition: A short (sell) signal is triggered when the spread Z-Score falls below the short entry threshold, suggesting overvaluation.
These conditions are based on the premise that extreme deviations from the mean (as indicated by the Z-Score) are likely to revert to the mean over time, presenting opportunities for strategic entry and exit points.
█ Practical Application
Traders use these signals to make informed decisions about opening or closing positions in the Bitcoin market. By quantifying market valuation extremes, the strategy aims to capitalize on the cyclical nature of price movements, identifying high-probability entry and exit points based on historical valuation norms.
█ Trade Direction
A unique feature of this strategy is its configurable trade direction. Users can specify their preference for engaging in long positions, short positions, or both. This flexibility allows traders to tailor the strategy according to their risk tolerance, market outlook, or trading style, making it adaptable to various market conditions and trader objectives.
█ Usage
To implement this strategy, traders should first adjust the input parameters to align with their trading preferences and risk management practices. These parameters include the trade direction, Z-Score calculation period, and the thresholds for long and short entries. Once configured, the strategy automatically generates trading signals based on the calculated spread Z-Score, providing clear indications for potential entry and exit points.
It is advisable for traders to backtest the strategy under different market conditions to validate its effectiveness and adjust the settings as necessary. Continuous monitoring and adjustment are crucial, as market dynamics evolve over time.
█ Default Settings
- Trade Direction: Both (Allows for both long and short positions)
- Z-Score Calculation Period: 252 days (Approximately one trading year, capturing a comprehensive market cycle)
- Long Entry Threshold: 0.382 (Indicative of moderate undervaluation)
- Short Entry Threshold: -0.382 (Signifies moderate overvaluation)
These default settings are designed to balance sensitivity to market valuation extremes with a pragmatic approach to trade execution. They aim to filter out noise and focus on significant market movements, providing a solid foundation for both new and experienced traders looking to exploit the unique insights offered by the MVRV Z-Score in the cryptocurrency market.

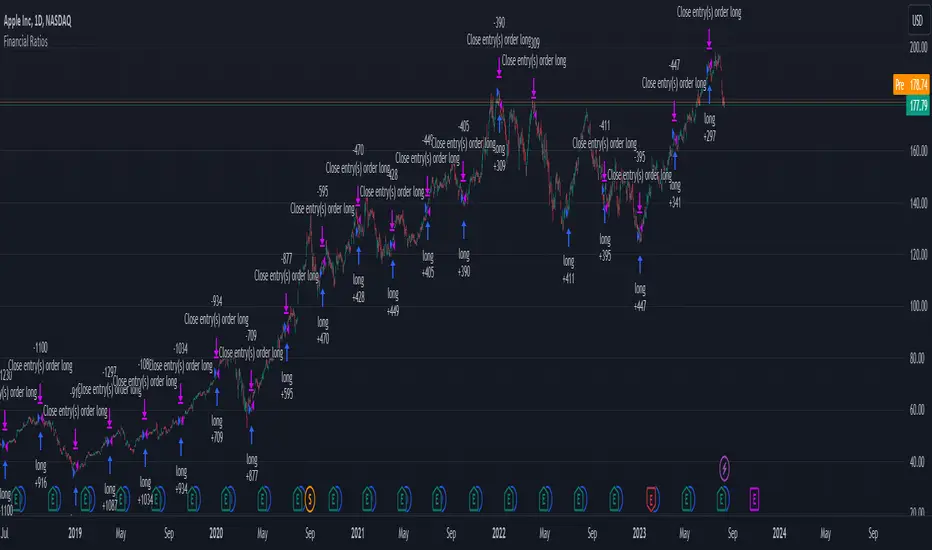
Financial Ratios Fundamental StrategyWhat are financial ratios?
Financial ratios are basic calculations using quantitative data from a company’s financial statements. They are used to get insights and important information on the company’s performance, profitability, and financial health.
Common financial ratios come from a company’s balance sheet, income statement, and cash flow statement.
Businesses use financial ratios to determine liquidity, debt concentration, growth, profitability, and market value.
The common financial ratios every business should track are
1) liquidity ratios
2) leverage ratios
3)efficiency ratio
4) profitability ratios
5) market value ratios.
Initially I had a big list of 20 different ratios for testing, but in the end I decided to stick for the strategy with these ones :
Current ratio: Current Assets / Current Liabilities
The current ratio measures how a business’s current assets, such as cash, cash equivalents, accounts receivable, and inventories, are used to settle current liabilities such as accounts payable.
Interest coverage ratio: EBIT / Interest expenses
Companies generally pay interest on corporate debt. The interest coverage ratio shows if a company’s revenue after operating expenses can cover interest liabilities.
Payables turnover ratio: Cost of Goods sold (or net credit purchases) / Average Accounts Payable
The payables turnover ratio calculates how quickly a business pays its suppliers and creditors.
Gross margin: Gross profit / Net sales
The gross margin ratio measures how much profit a business makes after the cost of goods and services compared to net sales.
With this data, I have created the long and long exit strategy:
For long, if any of the 4 listed ratios,such as current ratio or interest coverage ratio or payable turn ratio or gross margin ratio is ascending after a quarter, its a potential long entry.
For example in january the gross margin ratio is at 10% and in april is at 15%, this is an increase from a quarter to another, so it will get a long entry trigger.
The same could happen if any of the 4 listed ratios follow the ascending condition since they are all treated equally as important
For exit, if any of the 4 listed ratios are descending after a quarter, such as current ratio or interest coverage ratio or payable turn ratio or gross margin ratio is descending after a quarter, its a potential long exit.
For example in april we entered a long trade, and in july data from gross margin comes as 12% .
In this case it fell down from 15% to 12%, triggering an exit for our trade.
However there is a special case with this strategy, in order to make it more re active and make use of the compound effect:
So lets say on july 1 when the data came in, the gross margin data came descending (indicating an exit for the long trade), however at the same the interest coverage ratio came as positive, or any of the other 3 left ratios left . In that case the next day after the trade closed, it will enter a new long position and wait again until a new quarter data for the financial is being published.
Regarding the guidelines of tradingview, they recommend to have more than 100 trades.
With this type of strategy, using Daily timeframe and data from financials coming each quarter(4 times a year), we only have the financial data available since 2016, so that makes 28 quarters of data, making a maximum potential of 28 trades.
This can however be "bypassed" to check the integrity of the strategy and its edge, by taking for example multiple stocks and test them in a row, for example, appl, msft, goog, brk and so on, and you can see the correlation between them all.
At the same time I have to say that this strategy is more as an educational one since it miss a risk management and other additional filters to make it more adapted for real live trading, and instead serves as a guiding tool for those that want to make use of fundamentals in their trades
If you have any questions, please let me know !
Range BreakerStrategy Description: Range Breaker
The Range Breaker strategy is a breakout trading strategy that aims to capture profits when the price of a financial instrument moves out of a defined range. The strategy identifies swing highs and swing lows over a specified lookback period and enters long or short positions when the price breaks above the swing high or below the swing low, respectively. It also employs stop targets based on a percentage to manage risk and protect profits.
Beginner's Guide:
Understand the concepts:
a. Swing High: A swing high is a local peak in price where the price is higher than the surrounding prices.
b. Swing Low: A swing low is a local trough in price where the price is lower than the surrounding prices.
c. Lookback Period: The number of bars or periods the strategy analyzes to determine swing highs and swing lows.
d. Stop Target: A predetermined price level at which the strategy will exit the position to manage risk and protect profits.
Configure the strategy:
a. Set the initial capital, order size, commission, and pyramiding as needed for your specific trading account.
b. Choose the desired lookback period to identify the swing highs and lows.
c. Set the stop target multiplier and stop target percentage as desired to manage risk and protect profits.
Backtest the strategy:
a. Set the backtest start date to analyze the strategy's historical performance.
b. Observe the backtesting results to evaluate the strategy's effectiveness and adjust the parameters if necessary.
Implement the strategy:
a. Apply the strategy to your preferred financial instrument on the TradingView platform.
b. Monitor the strategy's performance and adjust the parameters as needed to optimize its effectiveness.
Risk management:
a. Always use a stop target to protect your trading capital and manage risk.
b. Don't risk more than a small percentage of your trading capital on a single trade.
c. Be prepared to adjust the strategy or stop trading it if the market conditions change significantly.
Adjusting the Lookback Period and Timeframes for Optimal Strategy Performance
The Range Breaker strategy uses a lookback period to identify swing highs and lows, which serve as the basis for determining entry and exit points for long and short positions. By adjusting the lookback period and analyzing different timeframes, you can potentially find the best strategy configuration for each specific asset.
Adjusting the lookback period:
The lookback period is a critical parameter that affects the sensitivity of the strategy to price movements. A shorter lookback period will make the strategy more sensitive to smaller price fluctuations, resulting in more frequent trading signals. On the other hand, a longer lookback period will make the strategy less sensitive, generating fewer signals but potentially capturing larger price movements.
To optimize the lookback period for a specific asset, you can test different lookback values and compare their performance in terms of risk-adjusted returns, win rate, and other relevant metrics. Keep in mind that using an overly short lookback period may lead to overtrading and increased transaction costs, while an overly long lookback period may cause the strategy to miss profitable trading opportunities.
Analyzing different timeframes:
Timeframes refer to the duration of each bar or candlestick on the chart. Shorter timeframes (e.g., 5-minute, 15-minute, or 30-minute) focus on intraday price movements, while longer timeframes (e.g., daily, weekly, or monthly) capture longer-term trends. The choice of timeframe affects the number of trading signals generated by the strategy and the length of time each position is held.
To find the best strategy for each asset, you can test the Range Breaker strategy on different timeframes and analyze its performance. Keep in mind that shorter timeframes may require more active monitoring and management due to the increased frequency of trading signals. Longer timeframes, on the other hand, may require more patience as positions are held for extended periods.
Finding the best strategy for each asset:
Every asset has unique price characteristics that may affect the performance of a trading strategy. To find the best strategy for each asset, you should:
a. Test various lookback periods and timeframes, observing the strategy's performance in terms of profitability, risk-adjusted returns, and win rate.
b. Consider the asset's historical price behavior, such as its volatility, liquidity, and trend-following or mean-reverting tendencies.
c. Evaluate the strategy's performance during different market conditions, such as bullish, bearish, or sideways markets, to ensure its robustness.
d. Keep in mind that each asset may require a unique set of strategy parameters for optimal performance, and there may be no one-size-fits-all solution.
By experimenting with different lookback periods and timeframes, you can fine-tune the Range Breaker strategy for each specific asset, potentially improving its overall performance and adaptability to changing market conditions. Always practice proper risk management and be prepared to make adjustments as needed.
Remember that trading strategies carry inherent risk, and past performance is not indicative of future results. Always practice proper risk management and consider your own risk tolerance before trading with real money.

MVRV Z Score and MVRV Free Float Z-ScoreIMPORTANT: This script needs as much historic data as possible. Please run it on INDEX:BTCUSD , BNC:BLX or another chart of sufficient length.
MVRV
The MVRV (Market Value to Realised Value Ratio) simply divides bitcoins market cap by bitcoins realized market cap. This was previously impossible on Tradingview but has now been made possible thanks to Coinmetrics providing us with the realized market cap data.
In the free float version, the free float market cap is used instead of the regular market cap.
Z-Score
The MVRV Z-score divides the difference between Market cap and realized market cap by the historic standard deviation of the market cap.
Historically, this has been insanely accurate at detecting bitcoin tops and bottoms:
A Z-Score above 7 means bitcoin is vastly overpriced and at a local top.
A Z-Score below 0.1 means bitcoin is underpriced and at a local bottom.
In the free float version, the free float market cap is used instead of the regular market cap.
The Z-Score, also known as the standard score is hugely popular in a wide range of mathematical and statistical fields and is usually used to measure the number of standard deviations by which the value of a raw score is above or below the mean value of what is being observed or measured.
Credits
MVRV Z Score initially created by aweandwonder
MVRV initially created by Murad Mahmudov and David Puell

Big Whale Purchases and SalesBig Whale Purchases and Sales - plots big whale transactions on your chart!
People that hold more than 1% of a crypto currencies circulating supply are considered whales and have a huge influence on price, not just because they can move the market with their huge transactions, but also because other traders often track their wallets and follow their example. Taking a look at whale holdings, one can see why whale worship is so common in crypto: While Bitcoin has a relatively low whale concentration, many of the Top 100 Cryptocurrencies have whales control 60% or more of their circulating supply.
Integrating IntoTheBlock data, this script plots the transactions of these whales and, in strategy mode, copy trades them.
Features:
Strategy Mode: Switches the script between an indicator and a strategy.
Standard Deviations: The number of Standard Deviations that a transaction needs to surpass to be considered worth plotting. Setting this to 0 will show all whale transactions, higher settings will only show the biggest transactions.
Blockchain: The Chain on which Whale activity is tracked.

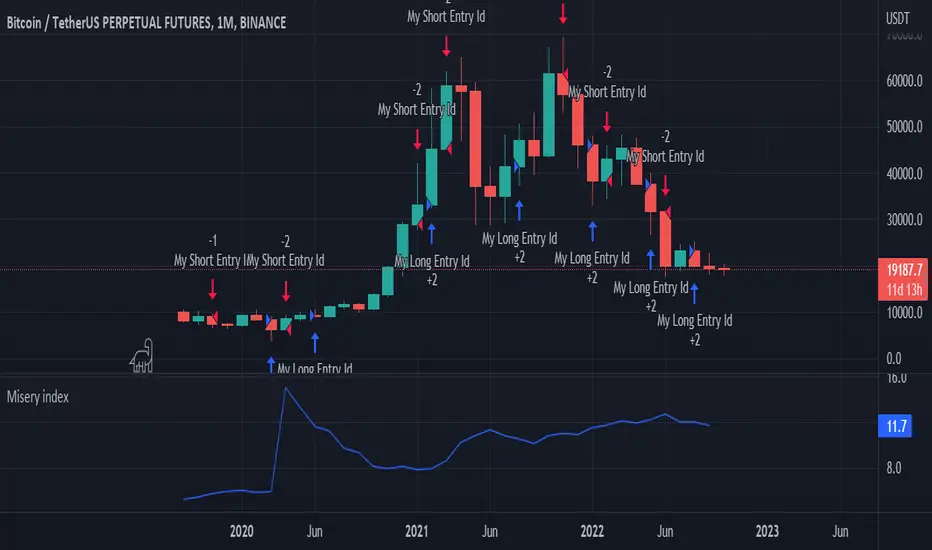
Misery index strategyHi all,
It's bear market so let's have a look at the misery index.
Misery index = inflation(%) + unemployment (%)
It's only possible to use this chart on the monthly (as misery index is updated monthly), but just for fun I added a strategy to it. If misery index increases you short and you go long when MI decreases.
Enjoy
p.s. the band is pretty cool too
USD Liquidity Conditions Index Swing Stock Strategy Original credits goes to @ElDoggo22 www.tradingview.com
I looked in the post created by him, of USD liquidity and I have noticed that if you are going to apply a percentile top and bottom to it, can become an interesting swing strategy for US Stocks.
So in this case I decided to create a 99th percentile for top and 4th percentile for bot with a big length, preferably 100+ candles, for this example i took 150.
Rules for entry :
Long : either bot or top lines are ascending
We exit long either the top line is descending, or we have sudden cross of the moving average with both top and bot within the same candle
Short: we enter short when we have a sudden cross down of the moving average with both top and bot within the same candle
We exit short when we have a cross over of the moving average with both top and bot within the same candle ( or we have a long entry condition)
If there are qny questions, please let me know !

BTC Profitable Wallets StrategyBTC Profitable Wallets Strategy - plots the percentage of profitable BTC wallets and places long orders when the profitable wallet share crosses above 50%, historically a very accurate point to catch the next Bull Run early.
The only setting is a smoothing option using the Moving Average method and length of your choice.
On Chain Data is queried from IntoTheBlock.
This is a 'HODL' strategy, with no exit given. If you'd like to see the historical performance check the Open Profit or place a sell order at the current date.

BTC Hashrate ribbonsBTC Hash Rate ribbons / Hash Rate cross
This strategy goes long when BTCs Hash Rate 30 day moving average crosses above the 60 day moving average, signifying that miner capitulation is over and recovery has started.
When the opposite signal is given, which signifies the beginning of miner capitulation, the strategy goes short (or flat, depending on configuration). This is generally considered the most popular Hash Rate related strategy.
The strategy is based on this medium article: medium.com
Thanks to the recent integration of IntoTheBlock data into Tradingview, we can now effortlessly show Hash Rate data on our chart,
keep in mind however, that IntoTheBlock doesn't provide Hash Rate data on timeframes below daily, so this strategy is based used on the daily, weekly or even monthly time frames.
Hash Rate definition:
The Bitcoin hash rate is the number of times per second that computers on the Bitcoin network are hashing data to verify transactions and perform the encryption that secures the network. The hash rate is an indicator of how healthy the Bitcoin network is at any given time, and is driven primarily by difficulty mining and the number of miners. Generally, a high hash rate is considered a good thing.
More precisely, the Bitcoin hash rate is the number of times per second that computers on the Bitcoin network are hashing data to verify transactions and perform the encryption that secures the network.

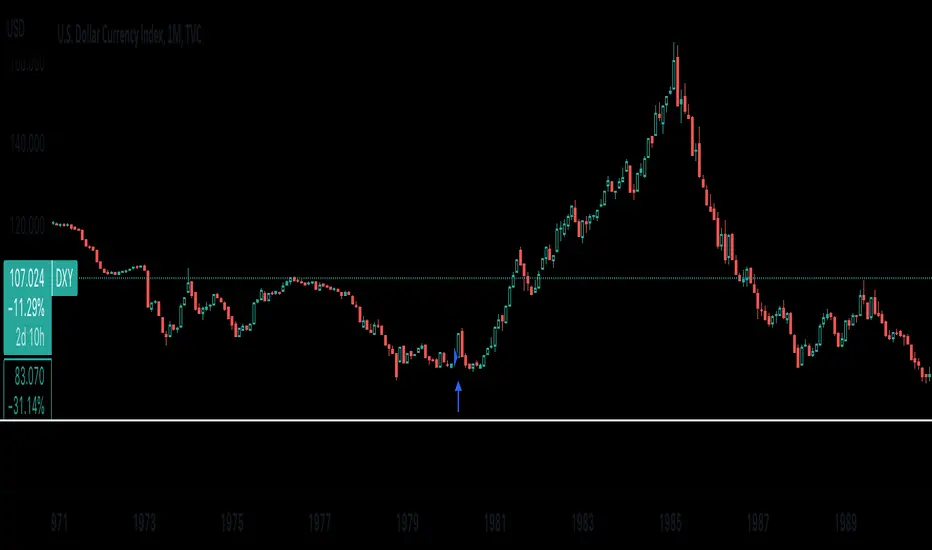
When was the last time we were in stagflation?Here I coded a strategy that indicates when we should enter a long position in the US dollar. The three indicators I used were the Inflation Rate, 10Y interest rate, and GDP growth rate. Right now in our economy, It seems as though we are in stagflation due to high inflation and declining GDP growth. Thoughts on how our government should handle the oversupply of money in the economy right now are another conversation. The reason I built this indicator is to see when the last time our country was in this type of market environment was and to see how far the dollar rose from that point on. It is necessary to say that the US dollar generally does not show these steep increases in value unless there is a hard cut in the Money supply. However, what we see is that the last time we were in stagflation was around the early 1980s when the dollar value rose to around 107( the levels we're at right now) and did not stop until It hit its peak at 150!!!! This isn't all that exciting really because if the FED follows a similar path as It did back in the '80s then we are going to see a whole lot more money supply being cut, an increase in interest rates, and a declining GDP Growth rate.
ATTENTION: This indicator does not tell you to buy any financial instrument that follows the DXY(US Dollar index), with that being said please feel free to comment and tell me your opinion. whether it's how bad my coding is(I'm a beginner sorry!!) or whether my ideas on our market environment right now are bogus or just do not make sense.

Gotobi TeriyakiUSDJPY Anomaly.
This anomaly originated in Japan.
Buy from 2:00 pm Japan time.
Sell at 9:55 Japan time.
Japanese importers often settle payments to suppliers in dollars, and exchange yen for dollars on settlement days (days falling on a 5 or 10, so-called goto days).
Therefore, on goto days, there is sometimes a shortage of dollars held by financial institutions. This is called the "middle price shortage," and financial institutions purchase dollars through the foreign exchange market to resolve the middle price shortage.
As a result, the dollar currency is bought and USD/JPY depreciates against the yen. Since the yen has historically appreciated against the dollar, exporting companies make forward exchange contracts with financial institutions as a risk hedge.
Financial institutions are therefore forced to procure dollars in the market because they do not have enough dollars in their balance sheets to deliver to exporters.
Five days is called "GO" in Japanese.
Ten days is called "TO" in Japanese.
In Japanese, a day is called "BI".
Now I can eat teriyaki all day long :)
ドル円ゴトー日ストラテジーを作ってみました。

BEST Strategy Template AutoviewHello Traders
I've build a strategy template building for you the AUTOVIEW commands
I made this template based on this documentation: use.autoview.with.pink
You can select whether you want to use an SL or not, a TP or not, using the borrow/repay feature (only for Binance), ... and it will build dynamically the Autoview commands and will send them when entry/exit alerts trigger.
The template accept SL/TP in percentage or pips/USD distance from the entry price
MAGICAL !!!! (not really, just some dumb coding)
Users will have to specify from the settings:
- the Autoview account name
- the symbol name: I couldn't capture it from the chart because sometimes the symbol name on the broker side is different than the one from the TradingView side
- the position size
- the broker name (Tradovate, Binance, Bitmex, FTX, ...)
- if you want to send the alerts to your DEMO or LIVE account
- a debug mode to check if your alerts are well formatted
- and a few other interesting options...
If you want to use it, you'll have to update the dummy entries logic lines 97-98 and replacing those two lines by your own stuff
I'll make the ProfitView and 3Commas and Alertatron versions shortly.
Basically the same script but with the commands built for those 3 automation third-parties.
Best regards
Dave

Nabz-BBMACD-2022-V1.1I have tried to make script which triggers indicators on combination of different feedback including Bollinger bands and MACD. Also used some of my logic by trial and error, It gave 744%+ profit on back-testing on coin RUNE/USDT from Jan 2021. It is my first script, I am happy to help the community. Please share your feedback.

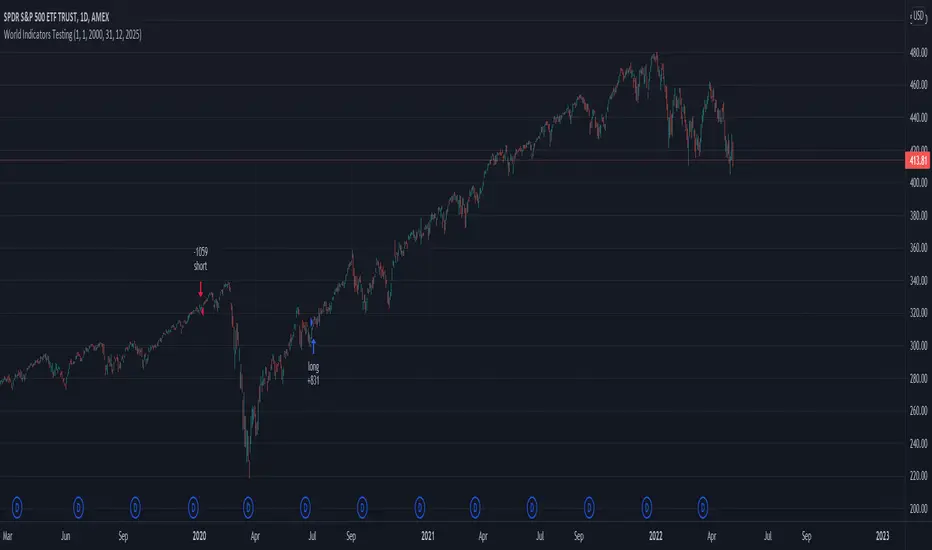
Swing Stock designed for Monthly/Yearly Trading This is a strategy tester designed around the most important data from FRED - Federal Reserve Economic Data
As input data, we have:
// Personal Consumption Expenditures
// Real Retail and Food Services Sales
// Leading Index for the United States
// All Employees: Total Nonfarm Payrolls
// Real Gross Domestic Product
// Gross Domestic Product
I adapted the long and short entry based on the GDP data, since they are most accurate in prediction compared to the rest.
However, feel free to test with other as well if you want.
For this test I compared previous GDP values, if they were higher than previous that represent a long signals, if they were smaller that represents a reversal=short signal.
From the tests performed we can see that GDP is highly accurate and overall as long as there is patience, profits are going to be make, sometimes even beat the index itself.
If you have any questions, let me know !
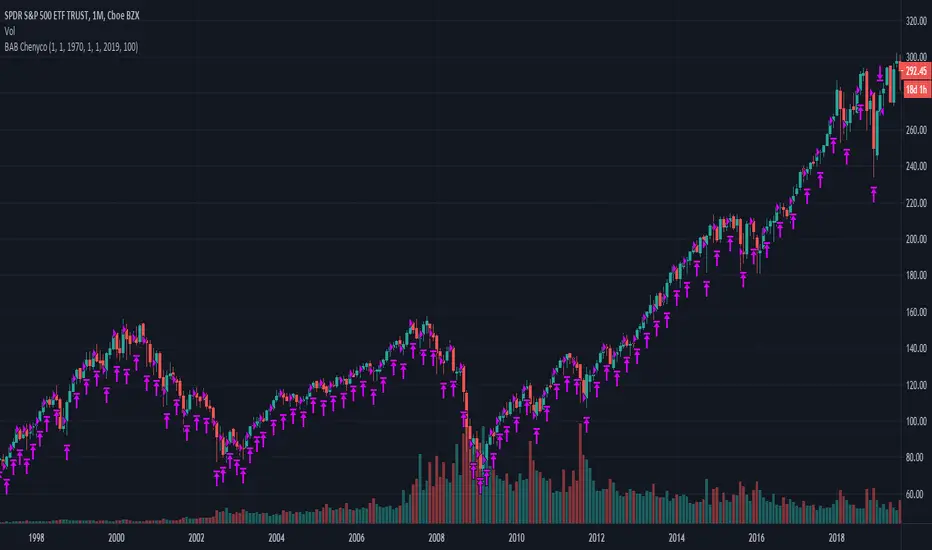
Buy Any Bar By ChenycoBuys amount of shares by bars with specified amount of money (100$ for a month bar for example).
Including commissions.
Stupid strategyStrategy with simple stop-loss and take-profit in percentage. If last trade was a successful one then repeat it. If not successful - do a reversal trade.
