Funding

MKAST V2 (lifetime)PLEASE READ THE ENTIRE POST BEFORE PURCHASING & USING THE MKAST Algorithm. Saves you and me some time in emails and messages. :)
This is the NEW LIFETIME ACCESS Version of the MKAST
The MKAST Buy Sell Algorithm is a very specific strategy, cut down to its roots and made perfect for the volatile crypto market.
Many Algorithms focus only on one aspect, one side, one specific rule.
As you know, this is not how life, the market or anything else works.
MKAST combines many different aspects at the same time, scans multiple other Algorithms and comes to a conclusion based on over 1350 lines of code.
It is based on Divergences, Elliott Waves, Ichimoku, MACD, MACD Histogram, RSI, Stoch, CCI, Momentum, OBV, DIOSC, VWMACD, CMF and multiple EMAs.
Every single aspect is weighted into the decision before giving out an indication.
Most buy/sell Algorithms FAIL because they try to apply the same strategy to every single chart, which
are as individual as humans.
To conquer this problem, MKAST has a wide range of settings and variables which can be easily
modified.
To make it a true strategy, MKAST has as well settings for Take Profit Points, Multiple Entries and Stop
Losses. Everything with an Alert Feature of course.
I know from experience that many people take one Algorithm and are simply too LAZY to add multiple Algorithms to make a rational choice.
The result of that is that they lose money, by following blatantly only one Algorithm.
MKAST has additional 9 Indicators, perfect for the crypto market, which can be turned on and off.
Manual
MKAST Signals Settings
“Show Signals?” - On/Off to show the Buy/Sell Signals.
“Aggressiveness” - Increase to make the signals less aggressive and decrease to make them more aggressive.
“Show Custom Signals?” - On/Off to show custom MKAST Signals as chosen in the settings below.
“Custom Buy/Sell Aggressiveness” - Choose a custom Aggressiveness for each buy and sell signal individually.
“TJ-Index Requirement For Buy/Sell” - If the TJ-Index is below the given number, it will show the signal in grey, this also applies for normal signals. Buy 0 and Sell 15 shows all signals in their original colour again.
“Don’t show signals that don’t meet index requirement?” - Checked, it will completely not show signals which would be “grey” as in the explanation above.
“Change Backgroundcolour if index is at 15 or 0?” - Checked, changes the colour of the chart if the index is at 15 or 0 points
MKAST Panel Settings
“Show Info Panel?” - Shows Info Panel on the chart.
“Move Info Panel UP by %” - Moves Info Panel up/down.
“Move Info Panel Left/Right ” - Moves Info Panel Left/Right.
“Show BitMEX Panel?” - Shows BitMEX Panel on the chart.
“Move BitMEX Panel by % ” - Moves BitMEX Panel up/down.
“Move BitMEX Panel Left/Right” - Moves BitMEX Panel Left/Right. “Signal Source” - Choose source of candle open/close for Equity calculation.
“Leverage Used?” - Select the used Leverage for your strategy and Equity calculation.
“Fees Per Trade in % ” - Deducts these fees after each trade from Equity calculation.
“Round Current Profit Price?” - Rounds the number on the Panel. “Trading Periods ” - Choose a trading Period which will be used to calculate Period Equity.
“Show separations of each Trading Period?” - Show separations on the chart of each Trading Period.
The very new feature on Tradingview and obviously now as well on MKAST are Information Panels.
I have chosen to add an Info Panel and a BitMEX Price Panel into MKAST, to make live and even
backtesting easier.
With only one blink of an eye the user is able to see ALL relevant information, without having to go
through various ways of checking and using other tools.
The Info Panel:
The first row shows the current profit. This is calculated since the signal initiation and the current candle close. Followed by a single number, which represents the current TJ-Index, removing the need of having to add the actual TJ-Index Oscillator on the chart.
The second row shows the current position and its status. This was added on request of many users wanting to know if their position is “about to change” or not. The status shows the users if the position is “endangered” or “okay”.
Followed by the “backtesting tool” already included inside the Panel. No need for complex oscillators with a hard reading for backtesting. With this one and simple panel, you see the Period Equity for the period chosen previously in the settings. This calculates all profits made inside that period and re-sets when the period ends. Right next to it, the Total Equity calculating ALL profits since the beginning of the chart.
Right below, you see the information about the last long and short position which have been open. This helps with the evaluation and documentation of the last trade.
The BitMEX Panel:
A convenient panel which shows all BitMEX contracts and their LIVE prices. The need for opening each chart goes away, the quality and experience of trading increases.
MKAST custom Signals are one of the notorious possibilities for ADVANCED strategies with MKAST.
Users who requested these features and use them frequently are the ones, having already a very unique trading strategy and they use these very custom signals as confluence or for multiple entry trades.
These custom signals and their settings can be mostly ignored by the majority of traders who are using this Algorithm.
The idea behind the grey signals has its roots in the idea of the TJ-Index. The TJ-Index being 15 Algorithms and conditions possible showing a bullish or bearish interpretation. The index counts the Algorithms which are showing a bullish interpretation.
Like that we can make sure that signals are shown in the original colour, are only those who have an additional confluence with the TJ-Index, not letting the user buy, if at least the majority is not bullish, and not letting the user sell, if at least the majority is bearish.
The custom buy and sell aggressiveness lets the user customise the MKAST algorithm even more.
Either the users wants to see how signals are changing on a different (slightly lower or higher) aggressiveness, being able to expect a change on their own settings. OR seeing that some signals of the same sort are a little out of place and is able to move these to a different aggressiveness, increasing the profitability even more.
Needless to say, custom signals are NOT a part of the Info Panel.
MKAST Label & Trendline Settings
“Show Labels?” - On/Off to show Labels above each signal, with the percentage gain or loss, calculated from the last signal to the new signal.
“Show Trendlines?” - On/Off to show automatic Trendlines following Gainzy Lines.
“Lookback Length” - Choose a length that the automatic trendiness use for calculation. Comparable to Aggressiveness.
“Wicks//Bodies” - Change between trendiness connecting from wick to wick or from body to body.
“Black lines// Coloured lines” - Change between simply black lines or changing colour lines.
“Filter Trendlines?” - On/Off to show all trendiness or just resistance decreasing and support increasing ones.
“Limit Extensions Of The Lines?” - This value increases by how much the trendiness are being extended. 0 = endless extension, otherwise 100 = maximum custom extension.MKAST Strategy “Take Profit 1” - On/Off to show TP1 points.
“Take Profit After %” - Set the percentage after which TP1 is active.
“Take Profit 2 ” - On/Off to show TP2 points.
“Take Profit 2 After %” - Set the percentage after which TP1 is
active.
“Take Profit 3” - On/Off to show TP3 points.
“Take Profit 3 After %” - Set the percentage after which TP1 is active.
“Second Entry” - On/Off to show Second Entry points.
“Second Entry After %” - Set the percentage after which Second Entry is active.
“Third Entry” - On/Off to show Third Entry points.
“Third Entry After %” - Set the percentage after which Third Entry is active.
“Stop Loss” - On/Off to show Stop Loss points.
“Stop Loss After %” - Set the percentage after which Stop Loss is active.
MKAST Strategy
To make the life of the MKAST user even easier, I have added all adjustable Take Profit Points, Multiple entry points and Stop Loss points.
I have never seen a sustainable and reliable trading strategy without TPs, Multiple entry and especially without a stop loss. Everything in the usual and fully customisable MKAST style.
Simply choose how many Take Profit points you would like to have and choose the percentage after which you would like to see the Take Profit point appear on the chart and notify you to take profits.
Are you a Trader who likes Multiple Entries? Also no problem with MKAST. Select how many additional entries you would like to have and after how many percent you would like them to appear on the chart and remind you of adding to the position.
What would a Strategy be without a Stop Loss? Same settings apply here as on the TPs and MEs.
All of the settings are able to take fractions of a number as well. This enables users to even use all of the strategy settings for scalping or FX pairs, where high leverage and the smallest of moves are used for trading.
Needless to say, all of these settings work on RENKO and Heikin Ashi as well. These might need adjustment, since the calculation is different, yet there is nothing standing in the way of it anymore.
Crypto Modified Indicators
“Show Divergences?” - On/Off to show Divergences on the Chart based on the data of 10 different Algorithms.
“Show Oversold/bought?” - On/Off to change the colour of the chart in Oversold/bought conditions.
“Oversold/bought value?” - Choose a value for which the chart is Oversold/bought.
“Show Fibonacci Levels?” - On/Off to show automatic Fibonacci Levels.
“Fibonacci Lookback Lenght” - This value states how many candles from right now are taken into account to paint the Fibonacci Levels.
“Fibonacci Custom Period” - Choose a custom Timeframe that should be used to paint the Fibonacci Levels.
“2nd-7th Fibonacci Level” - Enter a value for the Fibonacci Levels you would like to use and see on the chart.
“Plot 1.618 Level?” - On/Off for the Fibonacci extension level.
Crypto Modified Indicators
“Show Bands?” - On/Off to show the TJ-Bands on the chart.
“Bands Length” - Choose a value for the TJ-Bands Lenght
“Show Show EMA 1-3?” - On/Off to show the EMAs 1-3 on the chart.
“EMA Lenght 1-3” - Choose a value for the first to third EMA Lenght
“Show Ichimoku? ” - On/Off to show Ichimoku on the chart.
“Show Tenkin?” - On/Off to show Tenkin on the chart. “Tenkin” - Set the lenght of the Tenkin.
“Show Kijun?” - On/Off to show Kijun on the chart.
“Kijun” - Set the lenght of the Kijun.
“Show Senkou?” - On/Off to show the Senkou on the chart. “Senkou” - Set the lenght of the Senkou.
“Displacement” - Set the value of the Displacement.
“Show Chikou Span?” - On/Off to show the Chikou Span on the chart.
Crypto Custom Indicators
In the picture above, you see the first pair of Crypto Custom Indicators. The oversold and overbought conditions are highlighted.
Bullish and Bearish divergences are also plotted on the chart.
This is personally my favourite combination of Indicators and MKAST settings. It shows nicely
everything one needs to know and makes it easier to decide wether to follow a signal or not.
We here as well a perfect example of the Automatic Fibonacci Lines (Lookback 50, Timeframe 1D).
It shows all significant levels, which we can see being respected.
Orange = 23.6%, Green = 38.2%, Red = 50%, Yellow = 61.8%, Blue = 78.6%, White = 0%;100%
In this picture above, we observe the perfect ensemble of MKAST and an EMA strategy, especially modified for crypto markets.
Here, as by default, we have the EMAs at 21, 90 and 200. These have shown to be very significant moving support and resistance points in the crypto market.
In this picture above, I lowered the timeframe to show the highly significant levels of the Ichimoku. It has not the “usual values”. These here have been modified for the volatile crypto market and set as default.
An incredibly powerful tool for anyone who is ready to step up their trading game. It is a huge part of the MKAST back end and the strategy behind it.
MKAST Custom Alerts
1
MKAST without any doubt has Custom Alerts for all Signals that it is painting on the chart.
One can even choose to receive custom notifications for Take Profit points, Multiple Entry points and
the Stop Loss points.
The signals appear on the chart DURING the candle, not at the end of the candle. Therefore, the
alerts do this as well. These appear during the candle.
Here we can see all of the possible Alerts that can be chosen to be displayed. In total it is 14 different custom alerts, based on what the trader is looking for and how he is trading.
Personally, I have 10-15 coins that I trade the most and for these I have custom notifications, mostly though only the MKAST Buy/Sell and Stop Loss Signals.
To activate Alerts for MKAST,
1) Go to the “ALERT” icon on the top tool bar of your Tradingview.
2) Select “CONDITION” as “—MKAST—“
3) Then choose ONE condition from the list of conditions.
4) On “OPTIONS” you can set how many times it appears, I have “Once per Bar”.
4.1) If you want to make sure that the signal is truly there and not just a condition for a second during the candle, choose “ONCE PER BAR CLOSE”.
5) “Expiration Time” sets the time until the alert expires. PRO users have no expiration for alerts.
6) “Alert Actions” give you a row of choices what happens and how you want to be notified.
7) “Message” is the message that you receive inside the notification.
Thank you, Kong

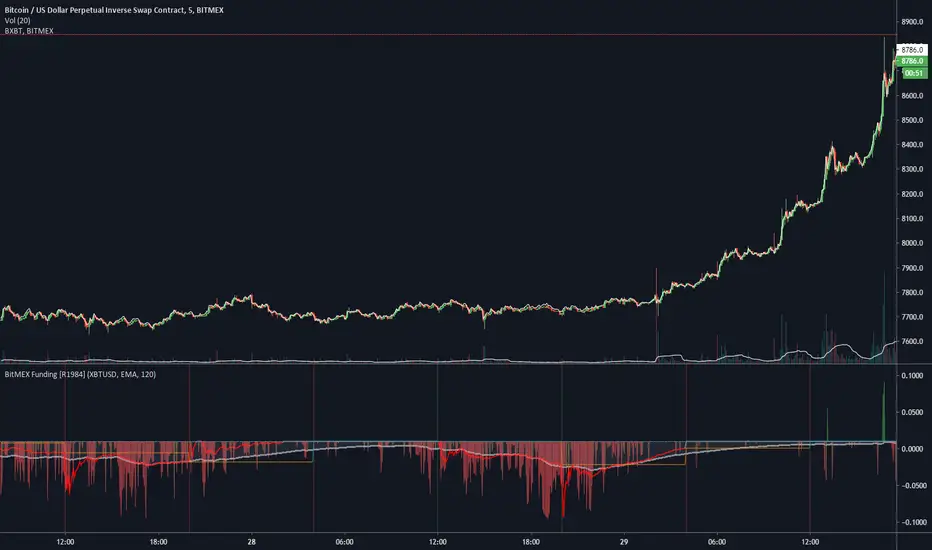
Bitmex Funding Estimate with Moving AverageThis will show an estimate of the Bitmex Funding Rate and also a moving average of the rate. The moving average will be most accurate on the 8 hour chart as funding is paid every 8 hours. Values are NOT official, but can be helpful for sentiment. The Moving Average helps reflect that one or two funding changes do NOT result in a reversal. In a bull trend, funding often does not fully favor shorts until near the middle of the trend.

Crypto Prices InfoPanel V2Hello traders
Following the introduction of ByBit to TradingView ByBit on TradingView
I decided to upgrade my previous Bitcoin InfoPanel Bitcoin-Prices-InfoPanel/
Now it's more dynamic (thumbs up) but only work with Bitcoin, Ethereum and Litecoin . If you select any other asset than those 3, the script won't work
This is due to a technical limitation on TradingView because I can't do more than 40 security calls per script
If you don't know what the security function is, here's a reminder : Security documentation . If you don't know what is TradingView... I cannot do anything for you...
Now you can use this panel to have a very cool arbitrage view directly from TradingView and use the info to gamble between brokers (not financial advice)
See you all tomorrow for a huge update regarding the Strategy Builder. I'll show you how to connect it to a Backtest system
____________________________________________________________
Feel free to hit the thumbs up as it shows me that I'm not doing this for nothing and will motivate to deliver more quality content in the future.
- I'm an officially approved PineEditor/LUA/MT4 approved mentor on codementor. You can request a coaching with me if you want and I'll teach you how to build kick-ass indicators and strategies
Jump on a 1 to 1 coaching with me
- You can also hire for a custom dev of your indicator/strategy/bot/chrome extension/python

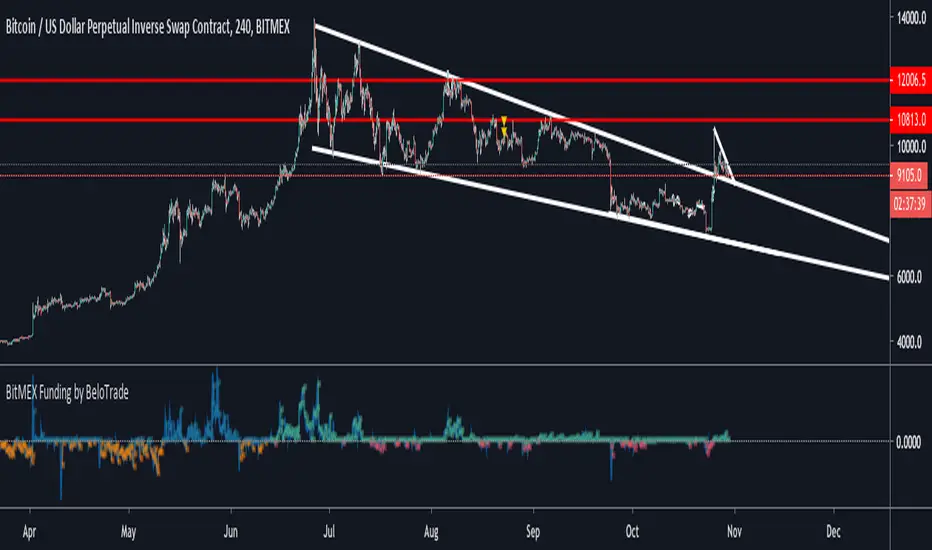
BitMEX Funding Visual by Mcrypt28This is a modified script originating from user m59 that better visually represents the BitMEX funding trend over time. Green indicates the funding is positive (longs pay shorts every 8 hours to maintain their position) and red indicates the funding is negative (shorts pay longs). The darker the color means the higher the rate. The unproven theory is that the funding helps to identify what retail investors are doing at a given time. Thus, in downtrends as the negative funding is drying up, a low may be near. In uptrends, as the funding remains negative, retail is generally bearish and continues to sell as institutional investors likely are absorbing. Vice versa for when the funding is positive. In any market in general, money flows from the many to the few. That means whatever retail is doing is generally the opposite of what will be the actual outcome. One more modifier to the m59 script is that volume is factored into the calculation which will impact which threshold (opacity on the chart) it falls within.
If you'd like to chart the BitMEX funding yourself, I'd recommend checking out the source from m59's indicator as that is more likely to stay up to date if BitMEX makes any changes to the way funding is calculated. The source if this is protected for that reason.

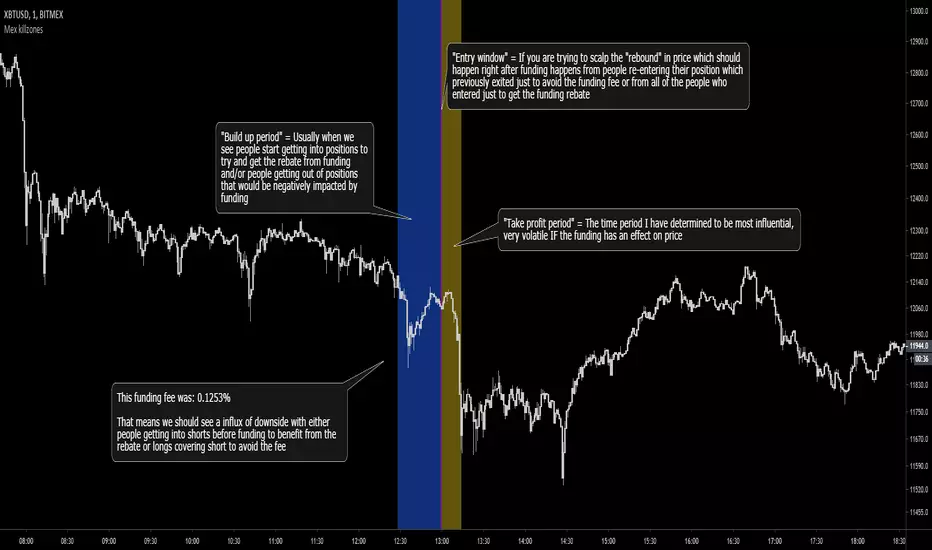
Bitmex Funding Killzones v3 [MaliciousUpload]Originally built off of "Oscarvs: BITCOIN KILL ZONES v2" indicator, updated to now highlight a different time period based event.
1. The indicator should not be affected by what time zone you are in, it will show true Funding periods by default.
2. This needs to be used on the 1min time frame to be used to its full extent
3. The more the funding fee is the more likely you are to have price get manipulated by people looking to act on its benefit
4. This indicator will work only for XBTUSD and ETHUSD perpetual contract symbols as they are the only two ones with funding...
My opinion: Funding is literally the exchanges insurance policy, they are "the house", they will always win.
With that in mind you can trade "with the house" in this regard, getting onto the side that will benefit from exponentially large funding rebates.
Do you ever ask how those "whales" got to be rich? It was by saving every penny they could while trading.
Funding gives people the option to jump out right before, avoiding the fee and then immediately enter in after at no loss (assuming limit orders ofc).
If that doesn't make sense to you i cant help, sorry. :pray: :pray: :pray:
"Build up period" = Usually when we see people start getting into positions to try and get the rebate from funding and/or people getting out of positions that would be negatively impacted by funding
"Entry window" = If you are trying to scalp the "rebound" in price which should happen right after funding happens from people re-entering their position which previously exited just to avoid the funding fee or from all of the people who entered just to get the funding rebate
"Take profit period" = The time period I have determined to be most influential, very volatile IF the funding has an effect on price
Hit me up on Discord if you are an **experienced** trader that takes trading seriously.
MaliciousUpload#1637
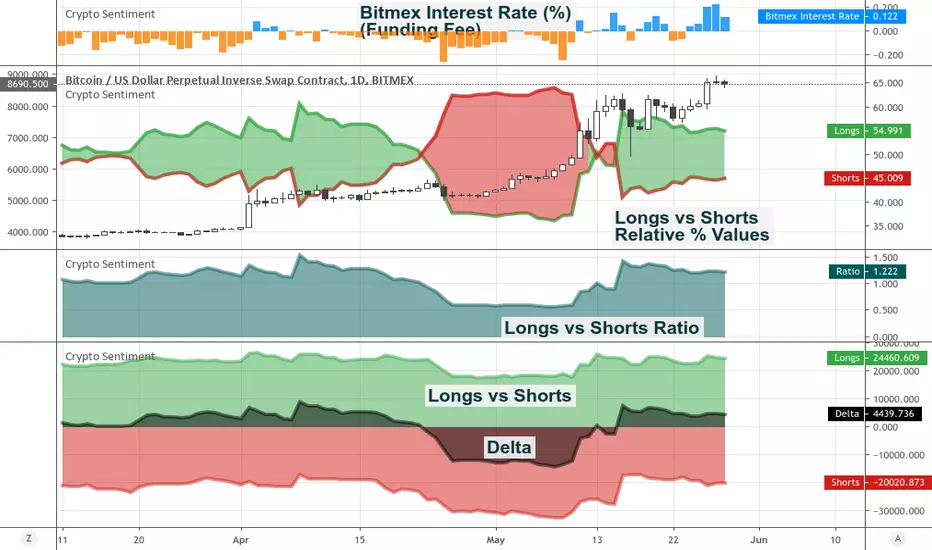
Ultimate Crypto SentimentThis study plots sentiment data from Longs vs Shorts reported at Bitfinex and the Funding Interest Rate that applies at Bitmex.
The indicator includes 4 visualization modes:
Overlapped Areas: Plots Longs and Shorts overlapping each other
Opposed Areas: Displays Longs as positive values and Shorts as negative.
Cloud: Highlights the difference between Longs and Shorts
Bitmex Interest Rate: Shows the funding rate that applies at Bitmex
The Longs vs Shorts data can be displayed either in Absolute mode or in Relative Mode.
The indicator includes visibility controls to Show/Hide:
The Longs
The Shorts
The Delta
The Longs vs Shorts Ratio
TJ-Bitmex Funding RateWelcome back to another indicator of the TJ-Series
All indicators I publish, are based on existing indicator ideas just modified and in the selection of a CryptoCurrency Day Trader
This indicator emulates BitMEX funding rates with reasonably accurate results.
I have made a YouTube Video on my channel "TJ Trade Corner" explaining Funding Rates and how each of them work and what these are based on.
There is a google form link in the description, which when filled out correctly will grant you permission to this indicator.
BitMEX funding occurs every 8 hours at 4:00 UTC, 12:00 UTC and 20:00 UTC.
You pay the funding rate if you are in a position at funding time.
The funding rate is predicted from the minute funding occurs over 480 minutes (8 hours).
After 8 hours, which is another funding time, the predicted rate is set as the next funding rate, which will be paid 8 hours later at the next funding time.
For example:
It is 4:00 UTC and funding is paid, and there is currently a predicted rate of 0.01.
The predicted rate, 0.01, will be set as the next funding rate which will be paid in 8 hours at the next funding time.
The predicted rate resets and will become a more accurate prediction each minute.
Funding Rate Bar: On the bar on which funding is paid (see funding times), a column is rendered with the value of the paid funding rate.
Next Funding Rate: The rendered circles show the next funding rate, which will be the value of the Funding Rate Bar
Predicted Funding Rate: The rendered line is the predicted funding rate that resets when funding is paid.
Daily, Weekly, and Monthly views show the total of fundings within the bar.
i.e. a daily bar contains 3 funding periods, so if funding were 0.1 each of those times, the daily funding is 0.3.
There are 21 funding periods in a week, so a week during which the funding was 0.1 on average will have a Weekly bar with a funding value of 2.1
PRINTED VALUES
Predicted Funding Rate | Next Funding Rate | Funding Rate Bar
OPTIONS
Contract: Choose the BitMEX perpetual swap contract for which to emulate funding. XBTUSD or ETHUSD
This Indicator and the video have been published before in my private learning group "ETG".
We are going over many observations and possible trades very frequently.
It is meant for only those who are really interested in becoming a self sufficient trader and learning about all the secrets of trading.
Should you be interested in ETG or the indicators I use, join my discord channel and say hi in chat, then I will give you a free trial for which you might be interested.
Like and Follow me and you will find the space interesting because I am a TA expert and professional day trader in crypto since 2012 that does daily updates and new posts about the hottest and most discussed coins.
Cheers TJ

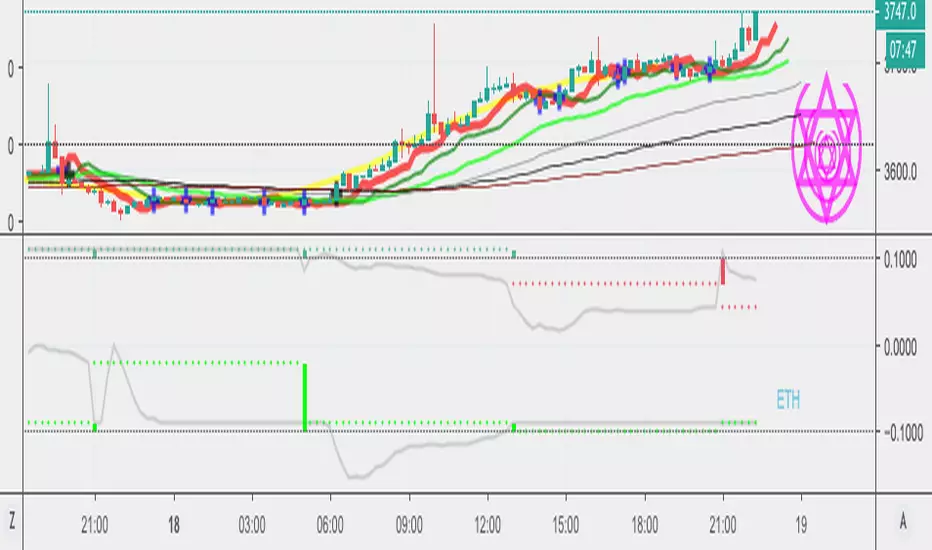
BitMEX Funding and Premium Index [NeoButane]This is a simplified version of the funding toolbox with only final funding and the premium index. As you can see, Ethereum funding makes zero sense.
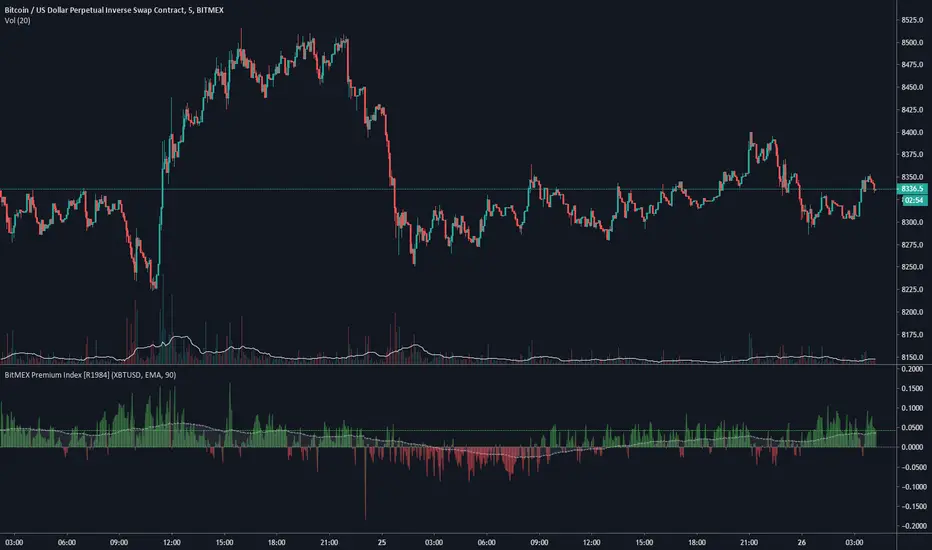
BitMEX Funding Toolbox [NeoButane]BitMEX's funding rates as described on their website.
Usage of the indicator:
Cumulative funding is a running sum of funding, similar to OBV. The idea is that funding can be used to predict current sentiment or market direction. The blue line is cumulative funding and the orange is a MVWAP used as a signal to determine current trend. Longs are paid when the blue line is going down.
Cumulative funding oscillator is the running sum of funding but made to be able to discern more recent trends.
Funding rate and premium index is as the name states.
Pictures of funding directly from BitMEX's funding history: imgur.com
The indicator will auto-select XBTUSD or ETHUSD depending which ticker is currently being viewed; if it is not on bitcoin or ethereum it defaults to XBTUSD funding.
References used:
www.bitmex.com
www.bitmex.com
More pictures:

BitMEX ETHUSD Perpetual Quanto Swap Predictive FundingThis script shows actual and predicted funding levels for the BitMEX ETHUSD perpetual swap.
It gives exact results when using 1 minute candles, or after leaving any timescale chart open for several hours to collect the new data points. In all other situations it lacks fine precision.

BitMEX XBTUSD Perpetual Swap Predictive FundingThis script shows actual and predicted funding levels for the BitMEX XBTUSD perpetual swap.
It gives exact results when using 1 minute candles, or after leaving any timescale chart open for several hours to collect the new data points. In all other situations it lacks fine precision.

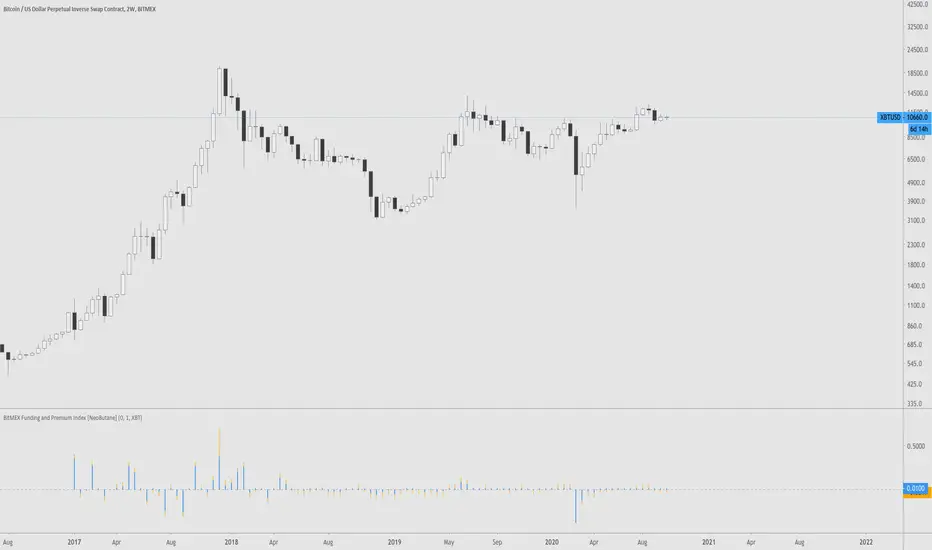
BitMEX Premium Index (.XBTUSDPI) [R1984]Basic indicator showing raw values of the BitMEX Premium Index (.XBTUSDPI) used in calculating the funding rate.
www.bitmex.com
www.bitmex.com
Funding rate indicator available here .
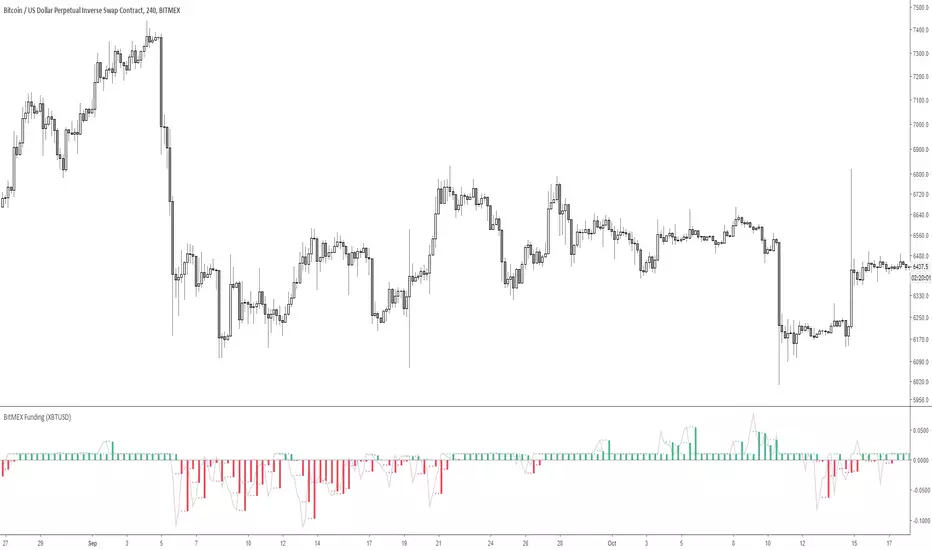
BitMEX Funding [R1984]This indicator attempts to emulate the BitMEX predicted funding rate for the XBTUSD perpetual swaps contract.
Reference
www.bitmex.com
www.bitmex.com
Indicator Key
Green/Red Area plot: Raw values of the calculated funding rate based on the XBTUSD Premium Index (.XBTUSDPI)
White Line plot: Time-Weighted Average Price (TWAP) of the calculated funding rate
Lime/Fuchsia Line plot: Predicted funding rate