Macro Momentum – 4-Theme, Vol Target, RebalanceMacro Momentum — 4-Theme, Vol Target, Rebalance
Purpose. A macro-aware strategy that blends four economic “themes”—Business Cycle, Trade/USD, Monetary Policy, and Risk Sentiment—into a single, smoothed Composite signal. It then:
gates entries/exits with hysteresis bands,
enforces optional regime filters (200-day bias), and
sizes the position via volatility targeting with caps for long/short exposure.
It’s designed to run on any chart (index, ETF, futures, single stocks) while reading external macro proxies on a chosen Signal Timeframe.
How it works (high level)
Build four theme signals from robust macro proxies:
Business Cycle: XLI/XLU and Copper/Gold momentum, confirmed by the chart’s price vs a long SMA (default 200D).
Trade / USD: DXY momentum (sign-flipped so a rising USD is bearish for risk assets).
Monetary Policy: 10Y–2Y curve slope momentum and 10Y yield trend (steepening & falling 10Y = risk-on; rising 10Y = risk-off).
Risk Sentiment: VIX momentum (bearish if higher) and HYG/IEF momentum (bullish if credit outperforms duration).
Normalize & de-noise.
Optional Winsorization (MAD or stdev) clamps outliers over a lookback window.
Optional Z-score → tanh mapping compresses to ~ for stable weighting.
Theme lines are SMA-smoothed; the final Composite is LSMA-smoothed (linreg).
Decide direction with hysteresis.
Enter/hold long when Composite ≥ Entry Band; enter/hold short when Composite ≤ −Entry Band.
Exit bands are tighter than entry bands to avoid whipsaws.
Apply regime & direction constraints.
Optional Long-only above 200MA (chart symbol) and/or Short-only below 200MA.
Global Direction control (Long / Short / Both) and Invert switch.
Size via volatility targeting.
Realized close-to-close vol is annualized (choose 9-5 or 24/7 market profile).
Target exposure = TargetVol / RealizedVol, capped by Max Long/Max Short multipliers.
Quantity is computed from equity; futures are rounded to whole contracts.
Rebalance cadence & execution.
Trades are placed on Weekly / Monthly / Quarterly rebalance bars or when the sign of exposure flips.
Optional ATR stop/TP for single-stock style risk management.
Inputs you’ll actually tweak
General
Signal Timeframe: Where macro is sampled (e.g., D/W).
Rebalance Frequency: Weekly / Monthly / Quarterly.
ROC & SMA lengths: Defaults for theme momentum and the 200D regime filter.
Normalization: Z-score (tanh) on/off.
Winsorization
Toggle, lookback, multiplier, MAD vs Stdev.
Risk / Sizing
Target Annualized Vol & Realized Vol Lookback.
Direction (Long/Short/Both) and Invert.
Max long/short exposure caps.
Advanced Thresholds
Theme/Composite smoothing lengths.
Entry/Exit bands (hysteresis).
Regime / Execution
Long-only above 200MA, Short-only below 200MA.
Stops/TP (optional)
ATR length and SL/TP multiples.
Theme Weights
Per-theme scalars so you can push/pull emphasis (e.g., overweight Policy during rate cycles).
Macro Proxies
Symbols for each theme (XLI, XLU, HG1!, GC1!, DXY, US10Y, US02Y, VIX, HYG, IEF). Swap to alternatives as needed (e.g., UUP for DXY).
Signals & logic (under the hood)
Business Cycle = ½ ROC(XLI/XLU) + ½ ROC(Copper/Gold), then confirmed by (price > 200SMA ? +1 : −1).
Trade / USD = −ROC(DXY).
Monetary Policy = 0.6·ROC(10Y–2Y) − 0.4·ROC(10Y).
Risk Sentiment = −0.6·ROC(VIX) + 0.4·ROC(HYG/IEF).
Each theme → (optional Winsor) → (robust z or scaled ROC) → tanh → SMA smoothing.
Composite = weighted average → LSMA smoothing → compare to bands → dir ∈ {−1,0,+1}.
Rebalance & flips. Orders fire on your chosen cadence or when the sign of exposure changes.
Position size. exposure = clamp(TargetVol / realizedVol, maxLong/Short) × dir.
Note: The script also exposes Gross Exposure (% equity) and Signed Exposure (× equity) as diagnostics. These can help you audit how vol-targeting and caps translate into sizing over time.
Visuals & alerts
Composite line + columns (color/intensity reflect direction & strength).
Entry/Exit bands with green/red fills for quick polarity reads.
Hidden plots for each Theme if you want to show them.
Optional rebalance labels (direction, gross & signed exposure, σ).
Background heatmap keyed to Composite.
Alerts
Enter/Inc LONG when Composite crosses up (and on rebalance bars).
Enter/Inc SHORT when Composite crosses down (and on rebalance bars).
Exit to FLAT when Composite returns toward neutral (and on rebalance bars).
Practical tips
Start higher timeframes. Daily signals with Monthly rebalance are a good baseline; weekly signals with quarterly rebalances are even cleaner.
Tune Entry/Exit bands before anything else. Wider bands = fewer trades and less noise.
Weights reflect regime. If policy dominates markets, raise Monetary Policy weight; if credit stress drives moves, raise Risk Sentiment.
Proxies are swappable. Use UUP for USD, or futures-continuous symbols that match your data plan.
Futures vs ETFs. Quantity auto-rounds for futures; ETFs accept fractional shares. Check contract multipliers when interpreting exposure.
Caveats
Macro proxies can repaint at the selected signal timeframe as higher-TF bars form; that’s intentional for macro sampling, but test live.
Vol targeting assumes reasonably stationary realized vol over the lookback; if markets regime-shift, revisit volLook and targetVol.
If you disable normalization/winsorization, themes can become spikier; expect more hysteresis band crossings.
What to change first (quick start)
Set Signal Timeframe = D, Rebalance = Monthly, Z-score on, Winsor on (MAD).
Entry/Exit bands: 0.25 / 0.12 (defaults), then nudge until trade count and turnover feel right.
TargetVol: try 10% for diversified indices; lower for single stocks, higher for vol-sell strategies.
Leave weights = 1.0 until you’ve inspected the four theme lines; then tilt deliberately.
GABRIEL

US Macro Cycle (Z-Score Model)US Macro Cycle (Z-Score Model)
This indicator tracks the US economic cycle in real time using a weighted composite of seven macro and market-based indicators, each converted into a rolling Z-score for comparability. The model identifies the current phase of the cycle — Expansion, Peak, Contraction, or Recovery — and suggests sector tilts based on historical performance in each phase.
Core Components:
Yield Curve (10y–2y): Positive & steepening = growth; inverted = slowdown risk.
Credit Spreads (HYG/LQD): Tightening = risk-on; widening = risk-off.
Sector Leadership (Cyclicals vs. Defensives): Measures market leadership regime.
Copper/Gold Ratio: Higher copper = growth signal; higher gold = defensive.
SPY vs. 200-day MA: Equity trend strength.
SPY/IEF Ratio: Stocks vs. bonds relative strength.
VIX (Inverted): Low/falling volatility = supportive; high/rising = risk-off.
Methodology:
Each series is transformed into a rolling Z-score over the selected lookback period (optionally using median/MAD for robustness and winsorization to clip outliers).
Z-scores are combined using user-defined weights and normalized.
The smoothed composite is compared against phase thresholds to classify the macro environment.
Features:
Customizable Weights: Emphasize the indicators most relevant to your strategy.
Adjustable Thresholds: Fine-tune cycle phase definitions.
Background Coloring: Visual cue for the current phase.
Summary Table: Displays composite Z, confidence %, and individual Z-scores.
Alerts: Trigger when the phase changes, with details on the composite score and recommended tilt.
Use Cases:
Align sector rotation or relative strength strategies with the macro backdrop.
Identify favorable or defensive phases for tactical allocation.
Monitor macro turning points to manage portfolio risk.
It's doesn't fill nan gaps so there is quite a bit of zeroes, non-repainting.

Fabian Z-ScoreFabian Z-Score — % Distance & Z-Scores for SPX / DJI / XLU
What it does
This indicator measures how far three market proxies are from a moving average and standardizes those distances into z-scores so you can spot stretch/mean-reversion and relative out/under-performance.
Universe: S&P 500 (SPX), Dow Jones (DJI) and Utilities (XLU). You can change any of these in Inputs.
Anchor MA: user-selectable MA type (SMA/EMA/RMA/WMA/VWMA/HMA/LSMA/ALMA) and length (default 39; a popular weekly anchor).
Outputs
% from MA: 100 × (𝐶𝑙𝑜𝑠𝑒 − 𝑀𝐴) / 𝑀𝐴
Time-series Z: z-score of the last N % distances (default 39) → “how stretched vs its own history?”
Cross-sectional Z: z-score of each % distance within the trio on this bar → “who’s strongest vs the others right now?”
A compact mini table (top-right) shows the latest values for each symbol: % from MA, Z(ts) and Z(xsec).
Panels & Visualization
Toggle what you want to see in View:
Plot % distance — raw % above/below the MA (0% line shown).
Plot time-series Z — standardized stretch with ±Threshold guides (default ±2σ).
Plot cross-sectional Z — relative z across SPX, DJI, XLU (0 = at the trio’s mean).
Smoothing — optional light MA on the plotted series (set to 1 for none).
A price-panel Moving Average is drawn with your chosen type/length for visual context.
Colors: SPX = teal, DJI = orange, XLU = purple.
Alerts
Two built-in alert conditions (time-series Z only):
“Z(ts) crosses up +Thr” — any of the three crosses above +Threshold.
“Z(ts) crosses down -Thr” — any crosses below −Threshold.
When enabled, the chart background tints faint green (up cross) or red (down cross) on those bars.
How to use (ideas, not advice)
On weekly charts, a 39-length MA/Z lookback often captures major risk-on/off swings. (Fabian Timing)
Deep negative Z(ts) (e.g., ≤ −2σ or −3σ) frequently accompanies panic and mean-reversion setups.
High positive Z(ts) suggests over-extension; watch for momentum fades.
Cross-sectional Z helps rank leadership today:
Z(xsec) > 0 → stronger than the trio’s mean this bar; Z(xsec) < 0 → weaker.
Utilities (XLU) turning positive x-sec while the others are negative can hint at defensive rotation.
If all 3 are above 0, go long, if below 0 go cash.
Combine: look for extreme Z(ts) aligning with lead/lag Z(xsec) to time entries/exits or hedges.
Inputs (quick reference)
Symbols: SPX / DJI / XLU (editable).
MA type & length: SMA, EMA, RMA, WMA, VWMA, HMA, LSMA, ALMA; default EMA(39).
Z-score lookback (ts): default 39.
Smoothing on plots: default 1 (off).
Z threshold (±): default 2.0 (guide lines & alerts).

Kent Directional Filter🧭 Kent Directional Filter
Author: GabrielAmadeusLau
Type: Filter
📖 What It Is
The Kent Directional Filter is a directionality-sensitive smoothing tool inspired by the Kent distribution, a probability model used to describe directional and elliptical shapes on a sphere. In this context, it's repurposed for analyzing the angular trajectory of price movements and smoothing them for actionable insights.
It’s ideal for:
Detecting directional bias with probabilistic weighting
Enhancing momentum or trend-following systems
Filtering non-linear price action
🔬 How It Works
Price Angle Estimation:
Computes a rough angular shift in price using atan(src - src ) to estimate direction.
Kent Distribution Weighting:
κ (kappa) controls concentration strength (how sharply it prefers a direction).
β (beta) controls ellipticity (bias toward curved vs. linear moves).
These parameters influence how strongly the indicator favors movements at ~45° angles, simulating a directional “lens.”
Smoothing:
A Simple Moving Average (SMA) is applied over the raw directional probabilities to reduce noise and highlight the underlying trend signal.
⚙️ Inputs
Source: Price series used for angle calculation (default: close)
Smoothing Length: Window size for the moving average
Pi Divisor: Pi / 4 would be 45 degrees, you can change the 4 to 3, 2, etc.
Kappa (κ): Controls how focused the directionality is (higher = sharper filter)
Beta (β): Adds curvature sensitivity; higher values accentuate asymmetrical moves
🧠 Tips for Best Results
Use κ = 1–2 for moderate directional filtering, and β = 0.3–0.7 for smooth elliptical bias.
Combine with volume-based indicators to confirm breakout strength.
Works best in higher timeframes (1h–1D) to capture macro directional structure.
I might revisit this.

Better MACD📘 Better MACD – Adaptive Momentum & Divergence Suite
Better MACD is a comprehensive momentum-trend tool that evolves the traditional MACD into a multi-dimensional, divergence-aware oscillator. It leverages exponential smoothing across logarithmic rate-of-change of OHLC data, adaptive signal processing, and intelligent divergence detection logic to provide traders with earlier, smoother, and more reliable momentum signals.
This indicator is built for professional-level analysis, suitable for scalping, swing trading, and trend-following systems.
🧬 Core Concept
Unlike the classic MACD which subtracts two EMAs of price, Better MACD constructs a signal by:
Applying logarithmic transformation on the change between OHLC components (Close, High, Low, Open).
Using double EMA smoothing to filter noise and volatility, Triangular method. 1st to 2nd Smoothing.
Averaging and de-biasing the results through a custom linear regression model, 4th Smoothing.
Subtracting a fast SMA and slow SMA response to yield a dynamic MACD value, 3rd Smoothing.
The result is a smooth, adaptive, and high-resolution MACD-style oscillator that responds more naturally to trend conditions and price geometry.
🧠 Features Breakdown
1. 📈 Multi-Layer MACD Engine
Src1: Smoothed Log Rate-of-Change on Close
Src2: Smoothed Log Rate-of-Change on High
Src3: Smoothed Log Rate-of-Change on Low
Src4: Smoothed Log Rate-of-Change on Open
These are blended using highest high, lowest low, and average Close price over a configurable window for more complete trend detection. The open-based Src4 is subtracted using SMA.
2. 🧮 Signal Line
A fast EMA (signalLength) of the Better MACD value is used for crossover logic.
Crossovers of MACD and Signal line signal potential entries or exits.
3. 📊 MACD Histogram
Visualizes the difference between MACD and Signal line.
Dynamically color-coded:
Green/Light Green for bullish impulse
Red/Pink for bearish impulse
Width and color intensity reflect strength and momentum slope.
🎨 Visual Enhancements
Feature Description
✅ Ribbon Fill Optional fill between MACD and Signal line, colored by trend direction
✅ Zero-Line Background Background highlights above/below 0 to easily read bullish/bearish bias
✅ Crossover Highlights Tiny circles plotted when MACD crosses Signal line
🔍 Divergence Detection Suite
The script includes a full Divergence Engine to detect:
🔼 Bullish Regular Divergence (Price lower lows + Indicator higher lows)
🔽 Bearish Regular Divergence (Price higher highs + Indicator lower highs)
🟢 Bullish Hidden Divergence (Price higher lows + Indicator lower lows)
🔴 Bearish Hidden Divergence (Price lower highs + Indicator higher highs)
🧩 Divergence Modes:
Supports both Regular, Hidden, or Both simultaneously
Detects from either Close Price or Heikin Ashi-derived candles
Uses dynamic pivot tracking with configurable lookback and divergence sensitivity
Divergence lines are labeled, colored, and plotted in real-time
🔁 Styling & Customization:
Choose from Solid, Dashed, or Dotted line styles
Configure separate colors and widths for all divergence types
Control number of divergence lines visible or only show the most recent
Divergences update live without repainting
⚠️ Alerts
Alerts are built-in for real-time notification:
MACD Histogram reversals (rising → falling, or vice versa)
Divergence signals (all 4 types, grouped and individually)
Combines seamlessly with TradingView alerts for actionable triggers
🔧 Input Controls (Grouped by Purpose)
Better MACD Group
1st–4th Smoothing Lengths: Controls responsiveness of MACD core engine
Signal Length: Smoothness of signal line
Toggles for crossover highlights, zero cross fills, and ribbon fills
Divergence Settings
Enable/disable divergence lines
Choose divergence type (Regular, Hidden, Both)
Set confirmation requirements
Customize pivot detection and bar search depth
Styling Options
Colors, line widths, and line styles for each divergence type
Heikin Ashi Mode for smoother pivots and divergences
🧠 How to Use
✅ For Trend Traders:
Use MACD > Signal + Histogram > 0 → Bullish confirmation
MACD < Signal + Histogram < 0 → Bearish confirmation
Wait for pullbacks with hidden divergences to enter in trend direction
✅ For Reversal Traders:
Look for Regular Divergences at trend exhaustion points
Combine with price action (e.g., support/resistance or candle pattern)
✅ For Swing & Day Traders:
Enable Heikin Ashi Mode for smoother divergence pivots
Use zero line background + histogram color to time entries
📌 Summary
Feature Description
🚀 Advanced MACD Core Smoother, more reliable, multi-source-based MACD
🔍 Divergence Engine Detects 4 divergence types with pivot logic
🎯 Real-Time Alerts Alerts for histogram slope and divergences
🎛️ Deep Customization Full styling, smoothing, and detection controls
📉 Heikin Ashi Support Improved signal quality in trend-based markets

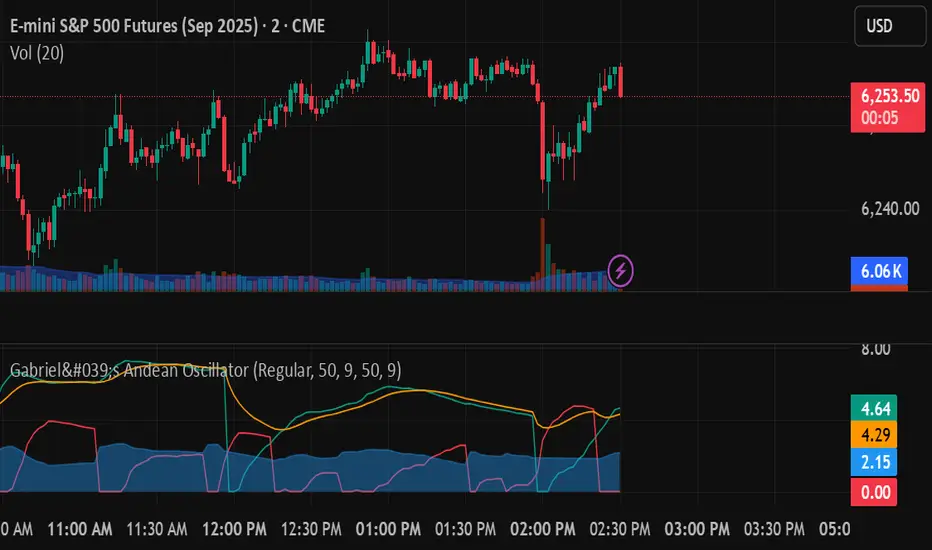
Gabriel's Andean Oscillator📈 Gabriel's Andean Oscillator — Enhanced Trend-Momentum Hybrid
Gabriel's Andean Oscillator is a sophisticated trend-momentum indicator inspired by Alex Grover’s original Andean Oscillator concept. This enhanced version integrates multiple envelope types, smoothing options, and the ability to track volatility from both open/close and high/low dynamics—making it more responsive, adaptable, and visually intuitive.
🔍 What It Does
This oscillator measures bullish and bearish "energy" by calculating variance envelopes around price. Instead of traditional momentum formulas, it builds two exponential variance envelopes—one capturing the downside (bullish potential) and the other capturing the upside (bearish pressure). The result is a smoothed oscillator that reflects internal market tension and potential breakouts.
⚙️ Key Features
📐 Envelope Types:
Choose between:
"Regular" – Uses single EMA-based smoothing on open/close variance. Ideal for shorter timeframes.
"Double Smoothed" – Adds an extra layer of smoothing for noise reduction. Ideal for longer timeframes.
📊 Bullish & Bearish Components:
Bull = Measures potential upside using price lows (or open/close).
Bear = Measures downside pressure using highs (or open/close).
These can optionally be derived from high/low or open/close for flexible interpretation.
📏 Signal Line:
A customizable EMA of the dominant component to confirm momentum direction.
📉 Break Zone Area Plot:
An optional filled area showing when bull > bear or vice versa, useful for detecting expansion/contraction phases.
🟢 High/Low Overlay Option (Use Highs and Lows?):
Visualize secondary components derived from high/low prices to compare against the open/close dynamics and highlight volatility asymmetry.
🧠 How to Use It
Trend Confirmation:
When bull > bear and rising above signal → bullish bias.
When bear > bull and rising above signal → bearish bias.
Breakout Potential:
Watch the Break area plot (√(bull - bear)) for rapid expansion, signaling volatility bursts or directional moves.
High/Low Envelope Divergence:
Enabling the high/low comparison reveals hidden strength or weakness not visible in open/close alone.
🛠 Customizable Inputs
Envelope Type: Regular vs. Double Smoothed
EMA Envelope Lengths: For both regular and smoothed logic
Signal Length: Controls EMA smoothing for the signal
Use Highs and Lows?: Toggles second set of envelopes; the original doesn't include highs and lows.
Plot Breaks: Enables the filled “break” zone area, the squared difference between Open and Close.
🧪 Based On:
Andean Oscillator - Alpaca Markets
Licensed under CC BY-NC-SA 4.0
Developed by Gabriel, based on the work of Alex Grover
London/NY Sessions + SMC Levels📜 Indicator Description: London/NY Sessions + SMC Levels
Overview: This indicator highlights the key trading sessions — London, New York, NY Lunch, and Asian Range — providing structured visual guides based on Smart Money Concepts (SMC) and ICT principles.
It dynamically plots:
Session Backgrounds and Boxes for London, NY, Lunch, and Asian sessions
Reference Levels for the High, Low, and Close from today, previous day, or weekly data
Midnight Open line for ICT-style power of three setups
Real-time alerts for session starts, session closes, and important price level crossings
Features:
🕰️ Session Visualization:
Toggle London, NY, Lunch, and Asian session ranges individually, with customizable colors and transparent backgrounds.
🔔 Built-in Alerts:
Alerts for:
Price crossing the previous day's high/low
Price crossing the Midnight Open
Start and end of major sessions (London, NY, Lunch, Asian)
🟩 Reference Levels:
Plot selectable session reference levels:
Today’s intraday High/Low/Close
Previous Day’s High/Low/Close
This Week’s or Previous Week’s levels for broader context.
🌙 Midnight Open:
Track the Midnight New York Open as a reference point for daily bias shifts.
🎯 Customizable Settings:
Choose your session time zones (UTC, New York, London, etc.)
Customize all border colors, background colors, and session hours.
Use Cases:
Identify killzones and optimal trade entry windows for Smart Money Concepts (SMC) and ICT strategies.
Monitor liquidity pool sweeps and session transitions.
Confirm or refine your intraday or swing trading setups by referencing session highs/lows.
Recommended For:
ICT traders
Smart Money Concepts (SMC) practitioners
Forex, indices, crypto, and futures traders focusing on session-based volatility patterns
Anyone wanting a clean, professional session mapping tool
📈
Designed to help you trade with session precision and Smart Money accuracy.
Integrates seamlessly into any ICT, Wyckoff, or Liquidity-based trading approach.

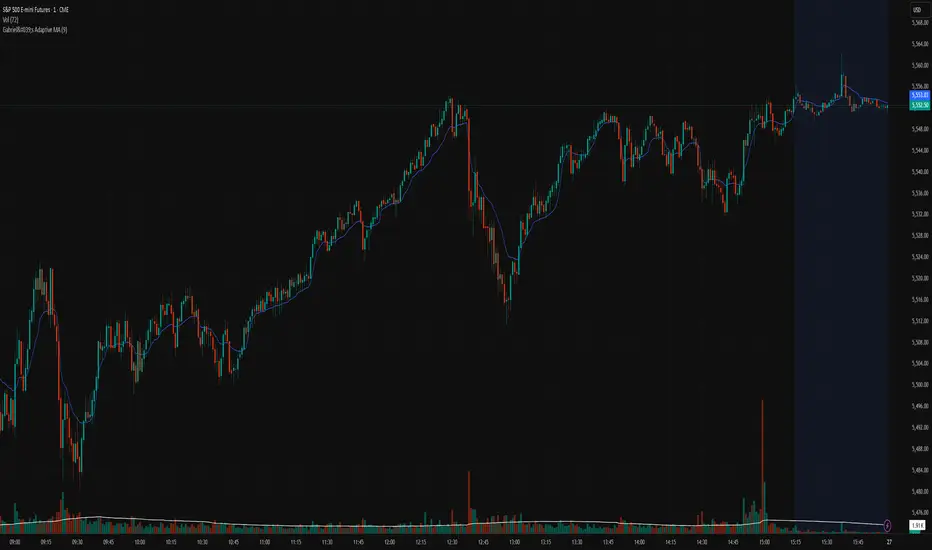
Gabriel's Adaptive MA📜 Gabriel's Adaptive MA — Indicator Description
Gabriel's Adaptive Moving Average (GAMA) is a dynamic trend-following indicator that intelligently adjusts its smoothing based on both trend strength and market volatility.
It is designed to provide faster responsiveness during strong moves while maintaining stability during choppy or consolidating periods.
🧠 What it does:
This indicator plots a custom-built, highly dynamic Moving Average that adapts itself intelligently based on:
Trend Strength (via Perry Kaufman's Efficiency Ratio)
Market Volatility (via Tushar Chande's Volatility Ratio)
It reacts faster when the market is trending strongly and/or highly volatile,
and it smooths out and slows down when the market is choppy or calm.
🔍 How it works (step-by-step):
1. User Inputs:
length: (default 14)
How many bars to look back for calculations.
fastSC: Fastest possible smoothing constant (hardcoded as 2 / (2+1))
slowSC: Slowest possible smoothing constant (hardcoded as 2 / (30+1))
(These are used to control how fast/slow the KAMA can react.)
2. Calculate Trendiness — Kaufman Efficiency Ratio (ER):
Net Change = Absolute difference between current close and close from length bars ago.
Sum of Absolute Changes = Sum of absolute price changes between every bar inside the length window.
Efficiency Ratio (ER) = Net Change divided by Sum of Changes.
✅ If ER is close to 1 → Smooth, trending market.
✅ If ER is close to 0 → Choppy, sideways market.
3. Calculate Bumpiness — Volatility Ratio (VR):
Short-Term Volatility = Standard deviation of close over length.
Long-Term Volatility = Standard deviation of close over length * 2.
Volatility Ratio (VR) = Short-Term Volatility divided by Long-Term Volatility.
✅ If VR is >1 → Market is becoming more volatile recently.
✅ If VR is <1 → Market is calming down.
4. Create the Hybrid Alpha:
Multiply ER × VR.
Then square the result (math.pow(..., 2)).
This hybrid alpha decides how aggressive the MA should be based on both trend and volatility.
If ER and VR are both strong → big alpha → fast movement.
If ER and/or VR are weak → small alpha → slow movement.
5. Calculate the Final Adaptive Smoothing Constant (hybridSC):
hybridSC = slowSC + hybridAlpha × (fastSC - slowSC)
This smoothly interpolates between the slowest and fastest smoothing depending on market conditions.
6. Calculate and Plot the Adaptive MA:
The moving average is manually calculated:
hybridMA := na(hybridMA ) ? close : hybridMA + hybridSC * (close - hybridMA )
It behaves like an EMA but with dynamic smoothing, not a fixed alpha.
✅ If hybridSC is high → MA hugs the price closely.
✅ If hybridSC is low → MA stays smooth and resists noise.
Finally, it plots this Adaptive MA on the chart in blue color.
📊 Visual Summary
Market Type What Happens to GAMA
Trending hard + volatile Follows price quickly
Trending hard + calm Follows steadily but carefully
Sideways + volatile Reacts carefully (won't chase noise)
Sideways + calm Smooths heavily (avoids fakeouts)
✨ Main Strengths:
Adapts automatically without you tuning settings manually every time market changes.
Responds smartly to both trend quality (ER) and market energy (VR).
Reduces lag during real moves.
Filters out false signals during choppy mess.
🧪 Key Innovation compared to normal MAs:
Traditional MA Gabriel's Adaptive MA
Same smoothing every bar Dynamic smoothing every bar
Slow during fast moves Adapts fast during real moves
No understanding of volatility or trendiness Full market sensitivity
⚡ **Simple One-Line Description:**
"Gabriel's Adaptive MA is a dynamic, trend-and-volatility-sensitive moving average that intelligently adjusts its speed to match market conditions."