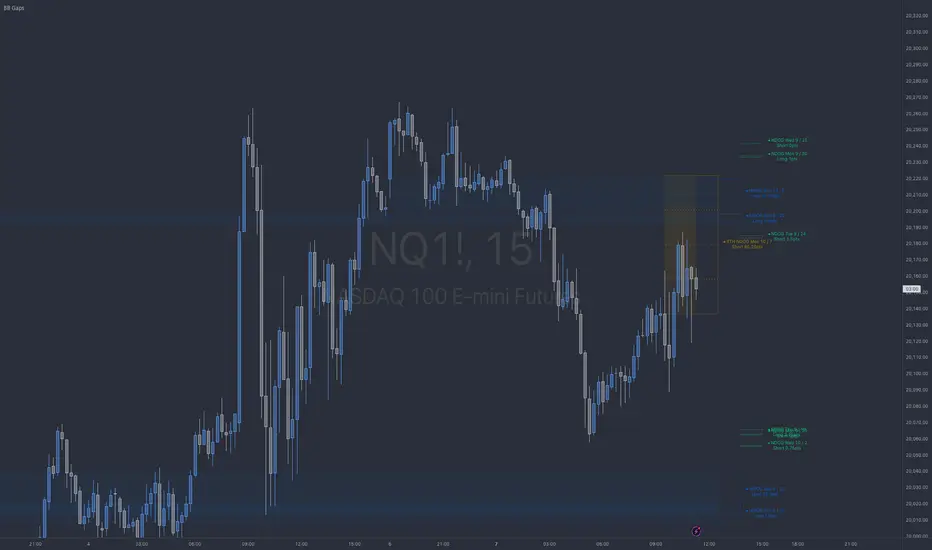
BB NWOG - NDOG - RTH NDOGThe BB Gaps Indicator is a comprehensive tool designed for traders looking to track and visualize significant opening gaps within various market sessions, including:
• New Day Opening Gaps (NDOGs): These gaps form between the closing price of the previous day and the opening price of the new day, providing insight into potential liquidity pools or imbalances.
• RTH New Day Opening Gaps (RTH NDOGs): This focuses on gaps that occur during Regular Trading Hours (RTH), capturing gaps between session closures and the next day’s open, ideal for intraday traders.
• New Week Opening Gaps (NWOGs): These gaps track the price differential between the last candle of the week and the first candle of the new trading week, providing a broader market perspective for swing traders.
Key Features:
• Dynamic Plotting: Visualize gaps with customizable extensions, box fills, and mid-range (50%) or quarter-range (25%, 75%) levels.
• Sidecar Labels: Handy sidecar labels display the gap information right on the chart for easy reference.
• Multiple Session Support: Track gaps across different trading sessions (Daily, RTH, Weekly) with adjustable plot extensions and fill styles.
• Configurable Limits: Set a maximum number of gaps to plot, ensuring your chart remains clean and clutter-free.
Gaps
ICT Vacuum BlocksThe indicator draws a box between the closing price of one candle and the opening price of the next whenever a gap occurs, helping traders easily spot potential areas of interest where the market has skipped over price levels. The boxes do not extend beyond the gap itself, keeping the chart clean and focused on the price action.
Features:
Detects both upward and downward gaps.
Non-extending boxes that accurately represent the size of each gap.
Customizable colors for up and down gaps to match your chart style.
Gap Finder Pro (incl. Island Gaps)Hello Traders!
Unlock the power of gap trading with Gap Finder Pro , a comprehensive tool designed to identify, analyze, and visualize price gaps in any market. This advanced indicator goes beyond simple gap detection, offering you a wealth of features to enhance your gap trading strategies.
Key Features
Precise gap detection for both up and down gaps
Island gap identification and analysis
Detailed statistics for data-driven decision making
Customizable visual elements for clear chart analysis
Flexible settings to adapt to various trading styles and timeframes (works on daily and intraday charts)
Understanding and Trading Gaps
Price gaps occur when an asset opens at a different price than its previous close, creating a blank space on the chart. Gaps can signal significant market sentiment shifts and often present lucrative trading opportunities. Gap Finder Pro helps you capitalize on these opportunities
Island Gaps: A Powerful Trading Signal
Island gaps, a rare but potent chart pattern, occur when a gap is followed by a period of price consolidation and then another gap in the opposite direction. The indicator automatically detects and highlights these formations, allowing you to spot potential trend reversals or continuation patterns quickly.
Comprehensive Statistics
Make data-driven decisions with the built-in statistics panel. Analyze:
Total number of gaps (up and down)
Average and median gap sizes
Gap fill rates and average time to fill
Percentage of gaps filled within specific timeframes
Breakdown of gap types (standard vs. island)
These statistics empower you to understand market behavior better and refine your gap trading strategies over time.
Trading Strategies
Island Gap Reversals: Capitalize on the powerful reversal signals provided by island gaps.
Breakout Trading: Look for gaps in a V-formation as potential signs of strong trend continuation.
Gap Fill Trading: Use the indicator to identify unfilled gaps and set targets for potential mean reversion trades.
(For example, enter short for a up gap fill if a down candle closes below the previous candle's low.)
Statistical Edge: Leverage the comprehensive statistics to develop gap-based trading systems.
Whether you're a seasoned gap trader or looking to incorporate gap analysis into your trading strategy, Gap Finder Pro provides the tools and insights you need to make informed decisions in any market condition. Elevate your trading with this powerful, all-encompassing gap analysis indicator.

ICT NWOG/NDOG Gaps [TradingFinder] New Opening Gaps🔵 Introduction
🟣 Understanding ICT Opening Gaps
In the realm of technical analysis, mastering the art of recognizing market behavior and pinpointing key price levels is vital for making sound trading decisions. Among the array of tools available, the concept of opening gaps stands out for its ability to provide crucial insights.
The ICT (Inner Circle Trader) methodology offers a distinctive approach to understanding the importance of New Day Opening Gaps (NDOG), New Week Opening Gaps (NWOG), and New Monthly Opening Gaps (NMOG).
These gaps, representing the price differences between the close of a previous period and the open of the next, serve as key reference points that can greatly impact price movements.
The ICT trading approach highlights these gaps as potential zones of support and resistance. Prices often respond to these areas, either bouncing off or passing through and then retesting them. Within these gaps, significant levels such as the high and low are particularly important.
Additionally, the Event Horizon PD Array (EHPDA) concept, which is an intermediate level calculated from the average of neighboring NWOGs or NDOGs, adds another layer to this analysis.
This guide delves into ICT's New Daily, Weekly, and Monthly Opening Ranges, showing how these gaps can be effectively utilized in trading. By grasping the nuances of these gaps, traders can better forecast market behavior, identify key support and resistance levels, and refine their trading strategies.
🟣 The Gaps
1. New Week Opening Gap (NWOG) : The NWOG is the price gap between Friday's closing price and Sunday's opening price. This gap is particularly crucial for traders who monitor weekly trends. Depending on the direction of the gap, the NWOG often serves as a pivotal support or resistance level.
2. New Day Opening Gap (NDOG) : The NDOG signifies the price difference between the closing price of the previous day and the opening price of the current day. Much like the NWOG, the NDOG is a key reference point for intraday traders.
Prices typically react to these levels, either reversing or continuing through the gap after a retest. NDOGs are instrumental in identifying short-term support and resistance levels, aiding traders in making decisions based on daily price movements.
3. New Monthly Opening Gap (NMOG) : The NMOG represents the gap between the closing price of the previous month and the opening price of the current month.
This gap is especially valuable for traders focusing on long-term trends and macroeconomic factors. As with NWOGs and NDOGs, the NMOG can act as a significant support or resistance level.
🔵 How to Use
Identifying Support and Resistance : Opening gaps often indicate potential zones where prices might reverse or find support/resistance. For example, if a new day opens below the previous day’s close (creating a NDOG), this gap could act as resistance, prompting traders to consider short positions if the price retests this level without breaking through.
Conversely, if the price opens above the previous day’s close, the gap might serve as support, offering a potential entry point for long trades.
Gap Fill Strategy : A popular strategy associated with opening gaps is the "gap fill" approach, where traders anticipate that the price will eventually return to fill the gap.
For instance, if there’s a significant NDOG at market open, a trader might expect the price to retrace back to the previous day’s close, effectively "filling" the gap. This strategy is particularly effective in markets that exhibit mean-reverting behavior.
Combining Gaps with Other Indicators : Traders often enhance their analysis of NDOG, NWOG, and NMOG by integrating other technical indicators. Aligning gap levels with tools such as Fibonacci retracements, moving averages, or existing support and resistance zones can provide additional confirmation for trade entries and exits.
🔵 Setting
Show and Color : You can control the display or non-display of the range as well as the color of the range.
Max Opening Range Update Method : You can control the number of ranges that are updated. If it is "All", all ranges that are not mitigated will be displayed. If "Custom", the ranges will be updated based on the number you specify.
Max Opening Range Update : The number of ranges to update.
🔵 Conclusion
The ICT New Daily, Weekly, and Monthly Opening Ranges provide traders with a systematic approach to understanding market dynamics and identifying critical support and resistance levels.
By analyzing these gaps, traders can gain deeper insights into potential price movements, spot high-probability trade setups, and strengthen their overall trading strategy. Whether you are focused on short-term day trading or long-term market trends, incorporating NDOG, NWOG, and NMOG analysis into your trading plan can be a powerful addition to your toolkit.

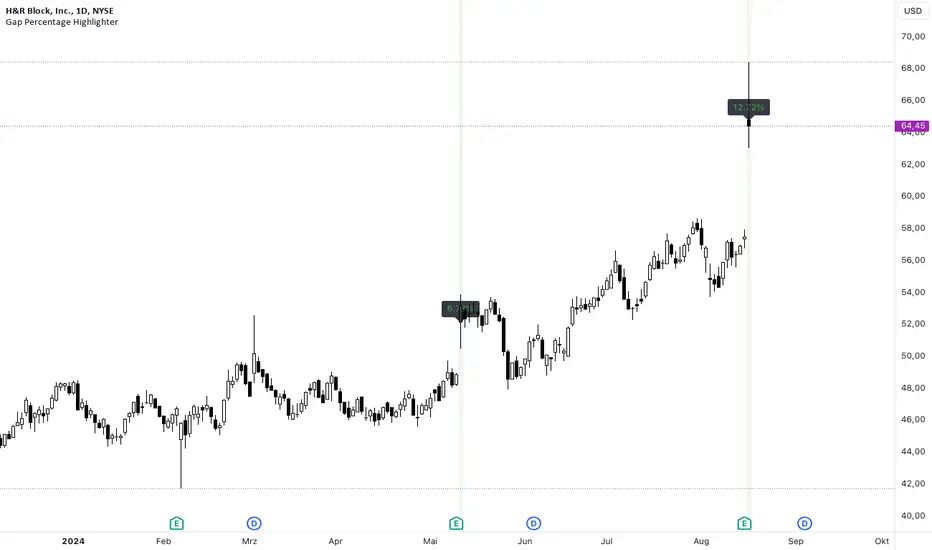
Gap Percentage Highlighter (1Day)b]🇬🇧 ENGLISH
The "Gap Percentage Highlighter" script is a useful tool for traders who want to visually highlight and analyze price gaps on their charts.
Features:
Identification of Price Gaps (Gaps):
The script automatically highlights candles where the opening price significantly differs from the previous day's closing price.
Percentage Display of the Gap:
The percentage change between the closing price and the opening price is displayed directly on the chart.
Customizable Gap Size:
Users can set the minimum size of the price gap in percentage terms through a simple input field, determining when the script marks a gap as significant.
Visual Highlighting:
Gap-ups (positive gaps) are highlighted in green, and gap-downs (negative gaps) are highlighted in red, making them easy to identify.
Use Case:
This script is ideal for traders who utilize gaps in their analyses to identify potential market movements. It allows for quick and visual identification of significant price gaps directly on the chart and offers the flexibility to adjust the definition of "significant" to match individual needs.
Disclaimer:
This script is for educational purposes only. Trading involves risks and is not suitable for every investor.
(c) BS IMPACT SCALE GmbH
🇩🇪 GERMAN
Das "Gap Percentage Highlighter" Skript ist ein nützliches Tool für Trader, die Kurslücken (Gaps) auf ihren Charts visuell hervorheben und analysieren möchten.
Funktionen:
Identifizierung von Kurslücken (Gaps):
Das Skript hebt automatisch Kerzen hervor, bei denen der Eröffnungskurs vom Schlusskurs der vorherigen Kerze auf Tagesbasis signifikant abweicht.
Prozentuale Anzeige der Kurslücke:
Die prozentuale Veränderung zwischen Schlusskurs und Eröffnungskurs wird direkt auf dem Chart angezeigt.
Anpassbare Gap-Größe:
Nutzer können über ein einfaches Eingabefeld die minimale Größe der Kurslücke in Prozent festlegen, ab der das Skript die Lücke als relevant markiert.
Visuelle Hervorhebung:
Gap-Ups (positive Lücken) werden in Grün und Gap-Downs (negative Lücken) in Rot hinterlegt, sodass sie leicht identifiziert werden können.
Anwendungsbereich:
Dieses Skript ist ideal für Trader, die Gaps in ihren Analysen nutzen, um potenzielle Marktbewegungen zu identifizieren. Es ermöglicht eine schnelle und visuelle Erkennung von signifikanten Kurslücken direkt auf dem Chart und bietet die Flexibilität, die Definition von "signifikant" an die eigenen Bedürfnisse anzupassen.
Haftungsausschluss:
Dieses Skript dient ausschließlich zu Bildungszwecken. Trading beinhaltet Risiken und ist nicht für jeden Anleger geeignet.
(c) BS IMPACT SCALE GmbH
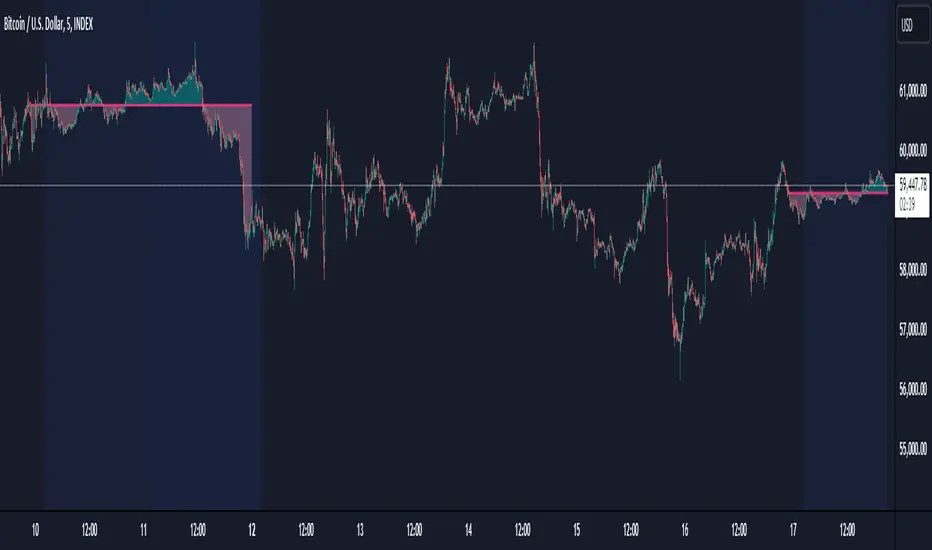
Combined Bitcoin CME Gaps and Weekend DaysScript Description: Combined Bitcoin CME Gaps and Weekend Days
Author: NeoButane (Bitcoin CME Gaps), JohnIsTrading (Day of Week),
Contributor : MikeTheRuleTA (Combined and optimizations)
This Pine Script indicator provides a combined view of Bitcoin CME gaps and customizable weekend day backgrounds on your chart. It’s designed to help traders visualize CME gaps along with customizable weekend day highlights.
Features:
CME Gaps Visualization:
Enable CME Gaps: Toggle the display of CME gaps on your chart.
Show Real vs. CME Price: Choose whether to display chart prices or CME prices for gap analysis.
Weekend Gaps Only: Filter to show only weekend gaps for a cleaner view (note: this may miss holidays).
CME Gaps Styling:
Weekend Background Highlighting:
Enable Weekend Background: Toggle the weekend day background highlight on or off.
Timezone Selection: Choose the relevant timezone for accurate weekend highlighting.
Customizable Weekend Colors: Define colors for Saturday and Sunday backgrounds.
How It Works:
CME Gaps: The script identifies gaps between CME and chart prices when the CME session is closed. It plots these gaps with customizable colors and line widths.
You can choose to see gaps based on CME prices or chart prices and decide whether to include only weekends.
Weekend Backgrounds: The script allows for background highlighting of weekends (Saturday and Sunday) on your chart. This can be enabled or disabled and customized with specific colors.
The timezone setting ensures that the background highlights match your local time settings.
Inputs:
CME Gaps Settings:
Enable CME Gaps
Show Real vs. CME Price
Only Show Weekend Gaps
CME Gaps Style:
Gap Fill Color Up
Gap Fill Color Down
Gap Fill Transparency
Weekend Settings:
Enable Weekend Background
Timezone
Enable Saturday
Saturday Color
Enable Sunday
Sunday Color
Usage:
Add this script to your TradingView chart to overlay CME gaps and weekend highlights.
Adjust the settings according to your preferences for a clearer view of gaps and customized weekend backgrounds.
This indicator provides a comprehensive tool for tracking CME gaps and understanding weekend market behaviors through visual enhancements on your trading charts.
SPX Mapped Gaps [Mxwll]Hello traders 👋
This indicator "SPX Mapped Gaps" detects gaps from the SPX (or the trader's choice of index/asset) and plots them for the asset on your chart!
Features
Selectable comparison symbol
Gaps from the selected symbol (SPX by default) are plotted for the asset on your chart - serving as potential support/resistance levels!
Closest gaps from comparison symbol displayed in upper-right table
Overlapped gaps deleted automatically - less clutter!
How this script works
The "SPX Mapped Gaps" is designed to help traders determine price levels for the asset on their chart where a major index (any asset) gapped up or down.
Of course, a gap that occurs on SPX (4-digit price) is incompatible with the price chart of BTC (5-digit price). To circumvent this, the percentage distance of the gap from SPX is determined, and a gap level is drawn equidistantly (up/down) from the open price of the asset on your chart. With this method, the proportion of the gap is maintained at the price area it occurred for the asset on your chart!
The image above outlines functionality for the indicator!
Key points:
Up gaps are denoted by green boxes
Down gaps are denoted by red boxes
All gaps are listed with their start and end price for the comparison asset (SPX for the example). These labels can be hidden at the user's discretion.
Gaps are expected to act as support/resistance during their lifetime
The image above explains the output of the script, including line style indications!
Solid lines indicate that the leverage used for at your entry price constitutes an active trade. Dotted lines mean the trade has already achieved your profit target for that leverage, or stopped out.
The image above explains the table attached to the indicator!
This table displays the closest gaps to the current asset price. The status (up gap or down gap) from the gap to the current price is also detailed.
Why are gaps on the SPX, or major index, relevant to BTC and other assets?
When a gap on the major indices occurs, it's expected that strong aggregate buying or selling pressure will transpire for BTC and other coins. Due to this, the presence of a gap on a major index might correspond to increased activity on smaller market-cap assets with some degree of positive correlation to the index. Consequently, the price level for the asset at which a gap for the major index occurred may function as support/resistance for future price!
That is all for this - thanks traders!

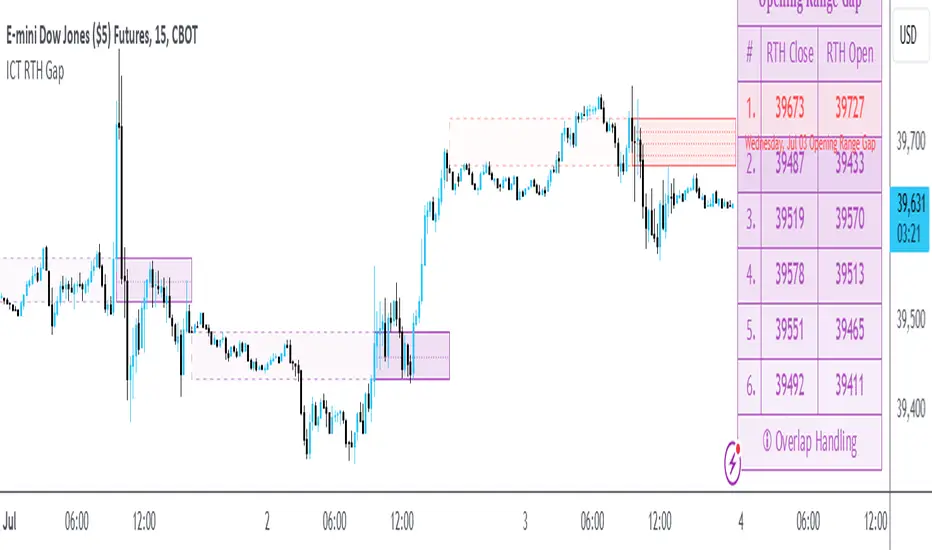
ICT Opening Range GapOpening Range Gap
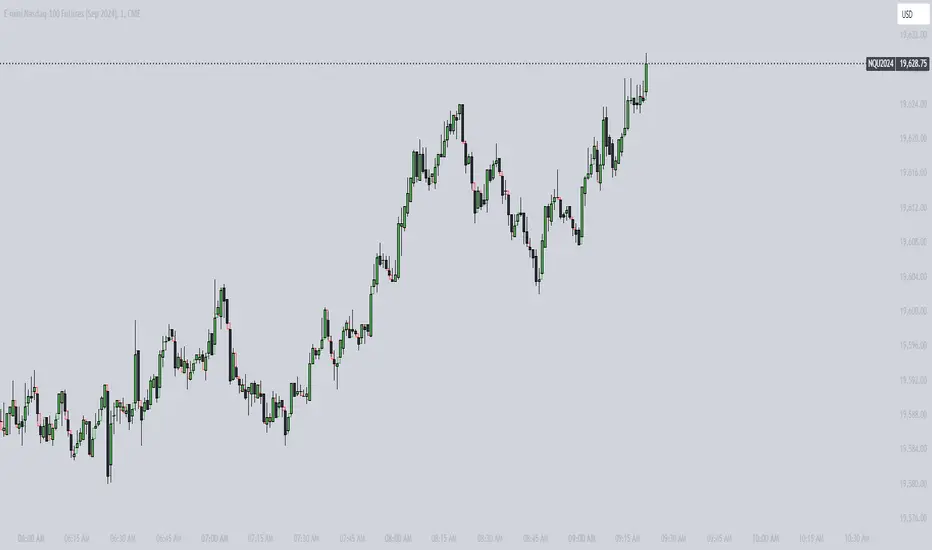
The Opening Range Gap, also known as the Regular Trading Hours (RTH) Gap, is the distance between the first opening tick of a session and the previous session's close, when looking at a chart's Regular Trading Hours (not to be confused with Electronic Trading Hours). This gap is an important element for Futures Market traders that follow the works of The Inner Circle Trader (ICT). To be more specific, the Opening Range Gap occurs between 4:15pm and 9:30am of the next day.
The Opening Range Gap can be viewed easily when switching the session type to "Regular trading hours".
The image above shows an example of an RTH Gap for Wednesday, June 12, 2024 in CME_MINI:ES1!
How To Use Opening Range Gap
The Opening Range Gap can be used like any other form of a gap by extending it into future price action and looking for it to be filled on the same day or the upcoming days.
Looking for 50% of the gap to be filled as an initial target is one of the methodologies taught by ICT. Additionally, the high and low of the gap (as well as the midpoint) can be used as points of dynamic support & resistance, even if the gap is already filled. Therefore, these gaps do not "expire", and they can be used as key price levels extended through to the end of the week.
Disclaimer
This indicator is mainly intended to work for Futures markets, and specifically the following Index Futures markets: E-mini S&P 500 Futures, E-mini NASDAQ-100 Futures, E-mini DOW Futures.
Given that, the indicator still supports various other markets/assets out-of-the-box, such as other types of Futures Markets, Stocks, Options, and more. The main difference will be that other markets may have RTH Gaps forming at different times, rather than the 4:15pm-9:30am gap that occurs in the Index Futures (Regular trading hours).
Indicator Purpose
While RTH Gaps can be labeled by hand, this indicator allows you to quickly plot multiple RTH Gaps and get a quick glimpse at potential gaps that you may have missed, which could end up being useful in your analysis.
This indicator is 100% custom-built, not using code from any other existing indicators that may plot Opening Range Gaps. The main purpose of this indicator was to overcome many shortcomings from other existing indicators, most notably the problem of displaying RTH Gaps while using ETH as the chart session.
Therefore, this indicator has many UNIQUE features, such as:
Ability to maintain accuracy of the closing/opening prices even when changing chart settings (e.g., toggling ETH/RTH sessions, toggling BACK-ADJUSTMENT on futures contracts, toggling SETTLEMENT prices, etc.).
Draw up to 25 previous Opening Range Gaps, even on ultra-low timeframes like the 1-minute or 1-second chart.
Automatically or manually choose which Opening Range Gaps to hide/show on the chart.
Highly customizable, including a different color scheme to easily distinguish between the Current and Previous RTH Gaps.
Modified price values to correctly display prices that use a format like 109'32 (e.g., Bond Futures or Wheat Futures).
Helpful tooltips to provide more detailed information about the RTH Gaps or about the current Input Settings.
Error Messages
There are some conditions which can cause the script to fail and display an error message (by clicking the red exclamation mark next to the indicator.)
Error messages:
Use a Standard Chart Type : this will occur when using a non-standard chart such as Heikin Ashi, Renko, Point & Figure, etc.
Use a Daily or Lower Timeframe : this error will appear when using a higher timeframe chart like weekly or monthly, because it can clutter the chart since RTH Gaps can form every day.
RTH Gap was not detected : this means that no RTH gap was found, which will occur on markets that don't have the option to toggle between ETH and RTH sessions (e.g., Forex or Crypto).
Exceeded the maximum lookback for Bar Replay mode : when using bar replay mode; this can depend on the amount of historical bars available in different account subscription types.
Unable to Activate Bar Replay mode : if the indicator could not be used in Bar Replay mode.
Restart Bar Replay : if the indicator works in Bar Replay but it detected an error that would cause RTH Gaps to be plotted incorrectly.
This is an example of what a script error would look like.
Indicator Settings
Most settings are self-explanatory or have a tooltip with information on what the setting does, but this section will only briefly cover the available settings.
Extend to End of Day : This setting is enabled by default. It will extend each RTH Gap only up to the end of its day (specifically, to the RTH close of the day). The option can be toggled OFF to automatically extend all RTH Gaps to the right-most candle on the chart.
Previous RTH Gaps : Between 1 and 25 previous RTH Gaps can be displayed. The checkbox can be toggled to quickly hide all previous RTH Gaps (but the same effect would be reached by setting the value to 0).
Hide Current RTH Gap : The Current RTH Gap (most recent one), can be optionally hidden from being plotted.
Beginning Anchor Point : Choose the beginning anchor point for all RTH Gaps. The default is "RTH Close", which means that each gap will be drawn on the chart starting from their previous session's RTH close @ 4:15pm. But it will be a more transparent version of the actual gap; this ghost-like image will extend from 4:15pm all the way up to 9:30am where the gap will then be drawn normally from 9:30am onwards. The other option for this setting is "RTH Open" which means that the gap will be drawn starting from the actual 9:30am opening.
Current RTH Gap Style
These settings are used to customize the visual style of the most recent RTH Gap (also known as the "Current" RTH Gap). Note: the exact same set of settings are available for the Previous RTH Gaps. The text label next to each gap can be optionally hidden to clean the chart a little.
Price Table
These are settings to customize the appearance of the Price Table on the right, including the ability to hide it completely. Note: to actually use the color configurations, you must select "Custom Style" in one of the dropdowns, otherwise it will use "Default Style" which means that the Price Table is automatically styled based on the colors chosen in the Current RTH Gap Style and Previous RTH Gap Style settings.
Overlap Handling
One of 7 available overlap handling options can be used to filter which RTH Gaps are plotted on the chart. By default, the "None" option will be selected, meaning that all valid RTH Gaps are plotted on the chart.
Formatting
Date Format : select the format of the date that is shown next to each RTH Gaps.
Timezone : choose the timezone for the RTH Gap closing/opening date-times that are displayed (only in tooltips when you hover over an RTH Gap label).
RTH Gap Label : choose the details to display next to each gap (e.g., date, or gap number, or both).
Price Format : only two options: Auto/Decimal. "Auto" uses custom processing to allow displaying values such as 109'32 for Bond futures.
Tooltips
The indicator provides additional details about an RTH Gap when you hover over a row in the Price Table.
Note: the same information can be found by hovering over the Text Label that is to the right of each RTH Gap (even when the Text Label is disabled via the Settings).
Overlap Handling
The tooltip next to "Select a Strategy" in the options will provide details on each overlap handling strategy. Additionally, when a strategy is selected, a new row in the Price Table will appear; hovering over that will show details about the currently selected strategy, as well as any suggestions in case the inputs were invalid. When a strategy hides an RTH Gap, the number in the Price Table will be replaced with an "Eye" icon, indicating that it is not currently plotted on the chart.
Available strategies are:
Option 1 (Gradients) : select the percentage opacity to shade RTH Gaps in. The more recent RTH Gaps will be closer to the maximum opacity defined, while the older RTH Gaps will appear more transparent, closer to the minimum opacity defined. Note: only affects previous RTH Gaps, not the current RTH Gap.
Option 2 (Day Extension) : select the number of days to extend each RTH Gap up to. Note: this will override the "Extend to End of Day" setting, regardless whether it is toggled ON or OFF.
Option 3 (Nested Gaps) : hides nested gaps, i.e., RTH Gaps that are enclosed within another RTH Gap. Note: this option is only available when the "Extend to End of Day" setting is disabled .
Option 4 (Intersecting Gaps) : hides intersecting/overlapping gaps, i.e., RTH Gaps that overlap one another (this may also include, but is not limited to, nested gaps). The drop-down next to this option allows choosing the priority of which RTH Gaps to hide first. Note: this option is only available when the "Extend to End of Day" setting is disabled .
Option 5 (Gap Width) : the chart will only show RTH Gaps that have a width/size between the defined parameters.
Option 6 (Close Proximity) : the chart will only show the RTH Gaps that are within a certain range from the market price. This can be useful when plotting multiple RTH Gaps while using auto-scaling on the chart. By only showing nearby RTH Gaps, it will prevent the auto-scaling from having to compress the candles to fit the far-away RTH Gaps onto the screen.
Option 7 (CSV) : this option is used if none of the others suit you well; it allows specifically choosing which RTH Gaps to hide or show on the chart.
This is an example that chooses the Overlap Handling Strategy Option 6. Note that in this example, the tooltip in the price table shows a warning that the Input Number should be increased to plot some RTH Gaps on the chart.
Tips
Chart settings can be toggled to "Scale price chart only" to prevent the auto-scaling of TradingView from compressing the chart if there are RTH Gaps that are far away from the current market action.
If you change a lot of indicator settings such as RTH Gap color schemes, you can save the settings as the Default to prevent your settings from resetting the next time you use the indicator.
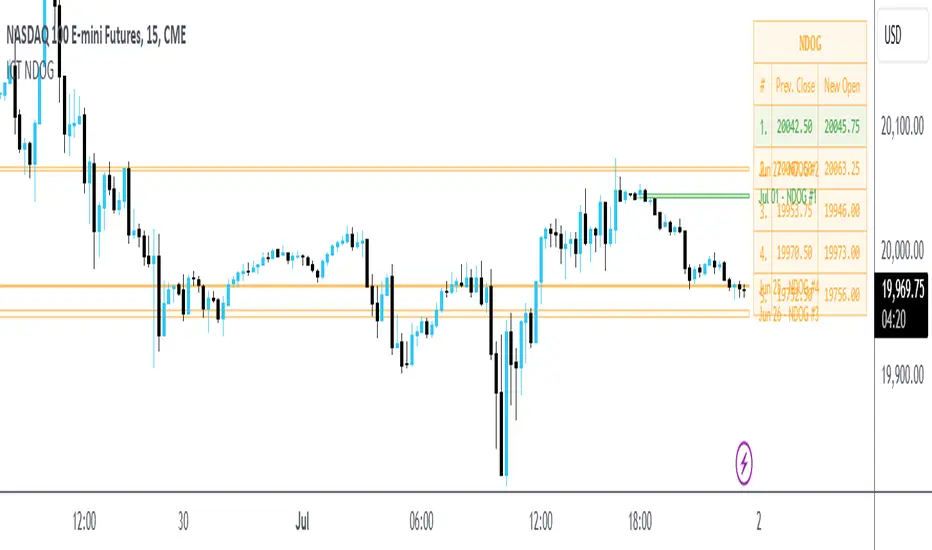
ICT New Day Opening GapNew Day Opening Gap
The New Day Opening Gap (NDOG) is defined by The Inner Circle Trader (ICT) as the separation in time/price that is caused by the 1-hour break that occurs each day in the futures market. The opening price of the gap is the very first tick that occurs at the 6:00pm restart; then we look at the 5:00pm closing price of the previous session. This New Day Opening Gap forms every day from Monday to Friday, but it does not include the gap between Friday's close and Sunday's open (because that is instead referred to as a New Week Opening Gap).
This is an example of a New Day Opening Gap (NDOG) for Wednesday, May 22, 2024 in CME_MINI:ES1!
How To Use NDOG
When an NDOG forms, it can be extended into future price action. One way to use these gaps is to look for it to be filled in by price action. Another usage for these gaps is to look for support & resistance to come in at the high and low of these NDOGs (as well as the midpoint).
Disclaimer
This indicator is mainly intended to work for Futures markets, and specifically the following Index Futures markets: E-mini S&P 500 Futures, E-mini NASDAQ-100 Futures, E-mini DOW Futures.
Given that, the indicator still supports various other markets/assets out-of-the-box, such as other types of Futures Markets, Forex markets, Stocks, Options, and more. The main difference will be that other markets may have NDOGs forming at different times, rather than the 5pm-6pm gap that occurs in the Index Futures.
Indicator Features
This indicator is 100% custom-built, not using code from any other existing NDOG plotting indicators. The purpose of this indicator was to overcome many shortcomings from other existing indicators. Therefore, this indicator has many UNIQUE features, such as:
Ability to maintain accuracy of the closing/opening prices even when changing chart settings (e.g., toggling ETH/RTH sessions, toggling BACK-ADJUSTMENT on futures contracts, toggling SETTLEMENT prices, etc.).
Draw up to 25 previous NDOGs, even on ultra-low timeframes like the 1-minute or 1-second chart.
Automatically or manually choose which NDOGs to hide/show on the chart.
Highly customizable, including a different color scheme to easily distinguish between the Current and Previous NDOGs.
Modified price values to correctly display prices that use a format like 109'32 (e.g., Bond Futures or Wheat Futures).
Helpful tooltips to provide more detailed information about the NDOGs or about the current Input Settings.
Error Messages
There are some conditions which can cause the script to fail and display an error message (by clicking the red exclamation mark next to the indicator.)
Error messages:
Use a Standard Chart Type : this will occur when using a non-standard chart such as Heikin Ashi, Renko, Point & Figure, etc.
Use a Daily or Lower Timeframe : this error will appear when using a higher timeframe chart like weekly or monthly, because it can clutter the chart since NDOGs can form every day.
NDOG was not detected : this means that no NDOG was found, for example if the chart did not have enough bars/candles (e.g., some Options markets).
Exceeded the maximum lookback for Bar Replay mode : when using bar replay mode; this can depend on the amount of historical bars available in different account subscription types.
Unable to Activate Bar Replay mode : if the indicator could not be used in Bar Replay mode.
Restart Bar Replay : if the indicator works in Bar Replay but it detected an error that would cause NDOGs to be plotted incorrectly.
NDOG was not detected. Toggle "Error Handling" Option at your own discretion : this is more of a warning message that will appear when the indicator does not detect any actual gap between the days (e.g., Forex markets where it is continuously traded through each day, without any gap forming in between). But the warning can be dismissed by toggling the checkbox at the bottom of the Indicator's Input Settings.
This is an example of what a script error would look like.
Indicator Settings
Most settings are self-explanatory or have a tooltip with information on what the setting does, so this section will only briefly cover the available settings.
The "Extend to End of Week" option is enabled by default, which will extend each NDOG only up to the end of the week that it belongs to. This option can be toggled OFF to automatically extend all NDOGs to the right-most candle on the chart.
Previous NDOGs: Between 1 and 25 previous NDOGs can be displayed. The checkbox can be toggled to quickly hide all previous NDOGs (but the same effect would be reached by setting the value to 0).
Hide Current NDOG: the current NDOG (colored in Green in the example above), can be optionally hidden from being plotted.
These settings are used to customize the visual style of the most recent NDOG (also known as the "Current" NDOG). Note: the exact same set of settings are available for the Previous NDOGs. The text next to each NDOG can be optionally hidden to clean the chart a little.
These are settings to customize the appearance of the Price Table on the right, including the ability to hide it completely.
One of 7 available overlap handling options can be used to filter which NDOGs are plotted on the chart. By default, the "None" option will be selected, meaning that all valid NDOGs are plotted on the chart.
Date Format : select the format of the date that is shown next to each NDOG.
Timezone : choose the timezone for the NDOG closing/opening date-times that are displayed (only in tooltips when you hover over an NDOG label).
NDOG Label : choose the details to display next to each NDOG (e.g., date, or NDOG number, or both).
Price Format : only two options: Auto/Decimal. "Auto" uses custom processing to allow displaying values such as 109'32 for Bond futures.
This option can be toggled to allow displaying NDOGs for markets that may not have an actual gap between days, such as Forex markets, or BTC/USD (which is traded 24/7). Note: this option must be used at your own discretion because the opening/closing times for the NDOGs are not guaranteed to be accurate.
Tooltips
The indicator provides additional details about an NDOG when you hover over a row in the Price Table.
Note: the same information can be found by hovering over the Text Label that is to the right of each NDOG.
Overlap Handling
The tooltip next to "Select a Strategy" in the options will provide details on each overlap handling strategy. Additionally, when a strategy is selected, a new row in the Price Table will appear; hovering over that will show details about the currently selected strategy, as well as any suggestions in case the inputs were invalid. When a strategy hides an NDOG, the number in the Price Table will be replaced with an "Eye" icon, indicating that it is not currently plotted on the chart.
Available strategies are:
Option 1 (Gradients) : select the percentage opacity to shade NDOGs in. The more recent NDOGs will be closer to the maximum opacity defined, while the older NDOGs will appear more transparent, closer to the minimum opacity defined. Note: only affects previous NDOGs, not the current NDOG.
Option 2 (Week Extension) : select the number of weeks to extend each NDOG up to. Note: this will override the "Extend to End of Week" setting, regardless whether it is toggled ON or OFF.
Option 3 (Nested Gaps) : hides nested gaps, i.e., NDOGs that are enclosed within another NDOG. Note: this option is only available when the "Extend to End of Week" setting is disabled .
Option 4 (Intersecting Gaps) : hides intersecting/overlapping gaps, i.e., NDOGs that overlap one another (this may also include, but is not limited to, nested gaps). The drop-down next to this option allows choosing the priority of which NDOGs to hide first. Note: this option is only available when the "Extend to End of Week" setting is disabled .
Option 5 (Gap Width) : the chart will only show NDOGs that have a width between the defined parameters. This can be useful to filter out NDOGs that are deemed "insignificant". For example, the Inner Circle Trader will generally filter out of his analysis any NDOGs that are less than a point (4 ticks) for Index futures.
Option 6 (Close Proximity) : the chart will only show the NDOGs that are within a certain range from the market price. This can be useful when plotting multiple NDOGs while using auto-scaling on the chart. By only showing nearby NDOGs, it will prevent the auto-scaling from having to compress the candles to fit the far-away NDOGs onto the screen.
Option 7 (CSV) : this option is used if none of the others suit you well; it allows specifically choosing which NDOGs to hide or show on the chart.
This is an example that chooses the Overlap Handling Strategy Option 6. Note that in this example, the tooltip in the price table shows a warning that the Input Number should be increased to plot some NDOGs on the chart.
Tips
Chart settings can be toggled to "Scale price chart only" to prevent the auto-scaling of TradingView from compressing the chart if there are NDOGs that are far away from the current market action.
If you change a lot of indicator settings such as NDOG color schemes, you can save the settings as the Default to prevent your settings from resetting the next time you use the indicator.
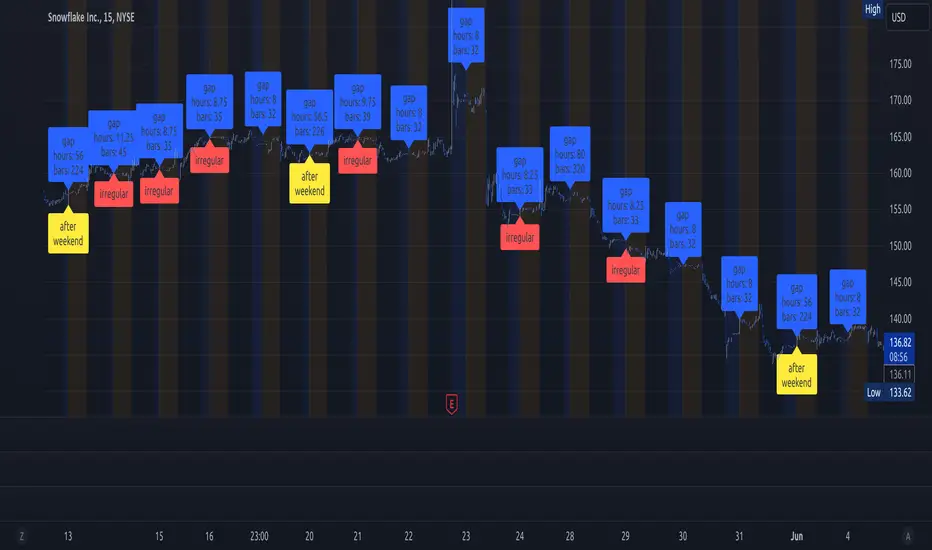
lib_session_gapsLibrary "lib_session_gaps"
simple lib to calculate the gaps between sessions
time_gap()
calculates the time gap between this and previous session (in case of irregular end of previous session, considering extended sessions)
Returns: the time gap between this and previous session in ms (time - time_close )
bar_gap()
calculates the bars missing between this and previous session (in case of irregular end of previous session, considering extended sessions)
Returns: the bars virtually missing between this and previous session (time gap / bar size in ms)
Gap Finder with Horizontal LinesBecause I was tired of manually marking gaps, I coded a simple script to automatically mark all candle gaps.
To ensure that all gaps are displayed even when only the wicks of the next candles touch the previous candle, the condition for identifying gaps was adjusted. Now this indicator tracks all gaps live and highlights high-volume price changes, which is important for swing trading or day trading. The code checks if the previous candle is completely below or above the current candle, considering both the bodies and the wicks.
There are a few scenarios where I use this indicator:
Scenario 1:
When the price increases with gaps, there is a high chance the price will come down to fill the gap.
Scenario 2:
When you see a cluster of many gaps and indicator lines, there is a high chance that there was a lot of volume and possible support.
Settings:
Update: You can change the transparency of the Lines to keep your Chart clean.
In the picture above, I marked some gaps that were closed shortly after they appeared. I use this indicator in the 1M timeframe, where gaps are closed very quickly. Some gaps created by the next candle are closed right away.
The code can be used for your private use and benefit, but please don’t forget to like it if you find it useful.

LumleyTrading GapsName: LumleyTrading Gaps
Description:
The Gap Tracker Indicator is a powerful tool designed for traders to identify, monitor, and capitalize on price gaps in financial markets. It serves two primary functions:
Identifying Gaps: The indicator scans price action to detect instances where the current trading session's opening price significantly differs from the previous session's closing price. These disparities indicate the presence of price gaps.
Tracking Gap Fills: Once a gap is identified, the indicator continues to monitor the price movement. It dynamically adjusts its parameters to track whether and when the price retraces back to fill the gap. As soon as the gap is filled, the indicator generates a signal to notify traders of this occurrence.
Key Features:
Customizable Parameters: Traders can adjust the sensitivity and criteria for what constitutes a significant gap based on their trading preferences and the market conditions.
Visual Alerts: The indicator provides clear visual signals on price charts, highlighting the presence of gaps and indicating when they are filled. This helps traders to easily spot trading opportunities and make informed decisions.
Alert Notifications: In addition to visual cues, traders can opt to receive real-time alerts via email, SMS, or within their trading platform, ensuring they never miss an opportunity or a filled gap.
Historical Analysis: The indicator may also offer historical gap data, allowing traders to conduct backtesting and analyze the performance of trading strategies based on gap patterns.
Benefits:
Gap Trading Opportunities: Traders can use the indicator to identify potential areas of price continuation or reversal, leveraging the phenomenon of gap trading for profit.
Risk Management: By tracking gap fills, traders can manage their risk more effectively, knowing when a gap is likely to act as support or resistance and adjusting their positions accordingly.
Enhanced Decision Making: With real-time gap detection and fill tracking, traders gain valuable insights into market sentiment and price dynamics, empowering them to make timely and informed trading decisions.
Compatibility:
The Gap Tracker Indicator is compatible with popular trading platforms and can be seamlessly integrated into various technical analysis tools and strategies.
Conclusion:
In the fast-paced world of financial markets, identifying and understanding price gaps is crucial for successful trading. The Gap Tracker Indicator provides traders with a reliable tool to spot, track, and capitalize on gap opportunities, enhancing their trading efficiency and profitability.
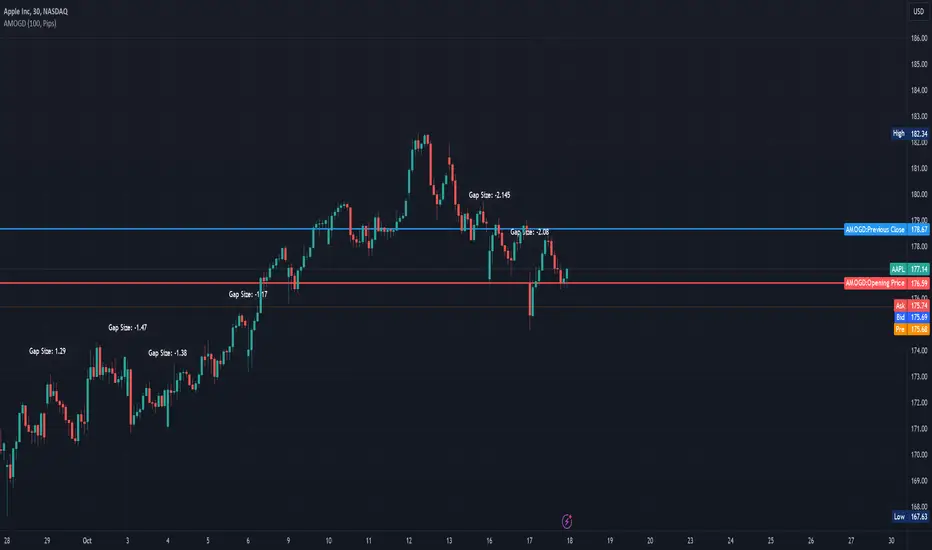
Advanced Market Opening Gap DetectorThe Advanced Market Opening Gap Detector (AMOGD) is a Pine Script indicator designed to help you identify market gaps at the opening of a new trading day. Gaps are areas on a chart where the price of a security moves sharply up or down with little or no trading in between. They are significant as they may indicate a change in market sentiment. This indicator highlights the size and direction of the opening gap, allowing you to potentially adjust your strategies accordingly.
By setting a minimum gap size, you can filter out smaller, less significant gaps, focusing only on larger gaps which may have more substantial implications. You can define the minimum gap size in points or pips, providing flexibility based on your trading preferences and the asset being traded.
How-to Use:
Apply the AMOGD indicator to your TradingView chart.
Configure the minimum gap size and unit (points or pips) based on your preference using the settings panel.
At the opening of each new trading day, the indicator will check for a gap between the previous close and the opening price.
If a valid gap is detected (i.e., the gap size meets or exceeds the minimum gap size specified), the indicator will:
Draw lines to indicate the opening price and previous close.
Display a label indicating the size of the gap.
Highlight the gap on the chart for better visibility.
Importance:
Market gaps can be pivotal points indicating a possible new trend or a continuation of the current trend. Being able to identify and analyze these gaps is crucial for making informed trading decisions. The AMOGD indicator automates the process of identifying and visualizing opening market gaps, saving traders time and allowing for quick assessment of market conditions at the start of each trading day. By setting a minimum gap size, traders can also filter out less significant price movements, allowing them to focus on potentially trend-changing gaps. This tool can be a valuable addition to a trader's toolkit, aiding in the analysis and interpretation of market behavior at the open, which is often a very volatile and crucial period in the trading day.
DISCLAIMER! RISK WARNING!
PAST PERFORMANCE IS NOT NECESSARILY INDICATIVE OF FUTURE RESULTS. TRADERS SHOULD NOT BASE THEIR DECISION ON INVESTING IN ANY TRADING PROGRAM SOLELY ON THE PAST PERFORMANCE PRESENTED, ADDITIONALLY, IN MAKING AN INVESTMENT DECISION, TRADERS MUST ALSO RELY ON THEIR OWN EXAMINATION OF THE PERSON OR ENTITY MAKING THE TRADING DECISIONS.
Candle GapsWhat This Indicator Does
This indicator shows you where the 'Gaps' are in the market ( as defined by this indicator ). The indicator draws a box that extends indefinitely to the right, this is the 'Gap'. This box will be 'Filled In' when price comes back and overlaps the box.
A Gap As Defined By This Indicator
A candle creates a 'Gap' in the area where there is no price action in front of, or behind ( up to 1 candle ) that area.
A 'Up Gap' is created when the close of a candle is above the high of the previous candle.
A 'Down Gap' is created when the close of a candle is below the low of the previous candle.
Both types of Gaps are coloured with the same colour.
Gaps are 'filled in' and disappear when price action crosses over them.
This indicator does not show gaps where there are no candlesticks.
The Intention Of This Indicator
The intention of this indicator is to make it possible to instantly identify Gaps in the market.
Gaps can be used as a confluence for a variety of different strategies.
Inputs
Gap Colour ( This changes the colour of the Gaps )
Draw Gaps From Wicks ( This changes whether the Gap begins to be drawn from the previous candles high/low, or from the candle the Gap occurs on )
Both inputs are for aesthetic preferences.
A maximum of 50 Gaps will be drawn on the chart at one time.
This indicator is not guaranteed to be 100% accurate.

AD's - Indecisive Candles, volume spikes, gapsThis script identifies price pivots, volume spikes (more than twice of 20 SMA vol) & gaps (both up & down)

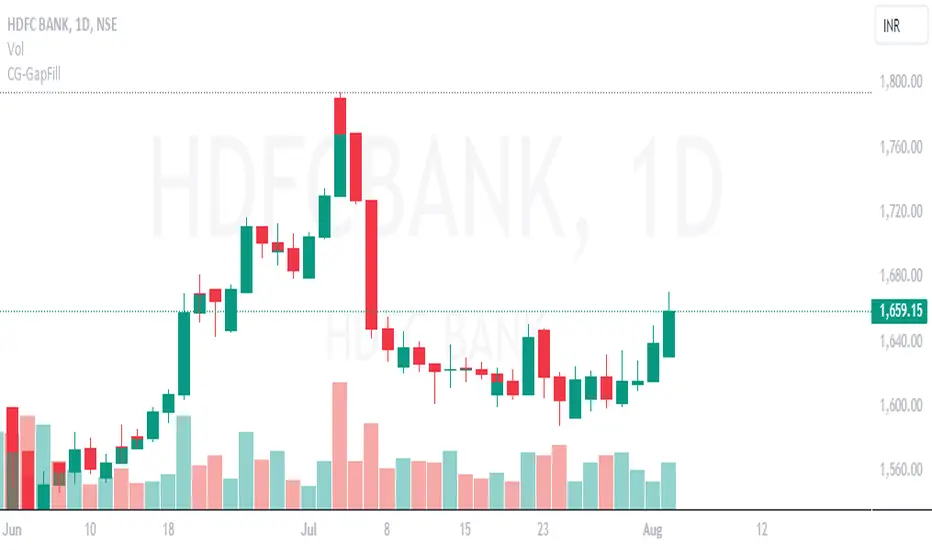
CG Gap Filling Invisible CandleThis script is used to Fill the GAP between two candles close price and next candle close price if there is GAP in the OPENING price of new candle.
This helps in identifying whether the GAP Candle is LEG candle (Big candles) or BASE candle (small accumulation candles) that can be used in marking the Demand and Supply zones based on LEG-IN, BASE and LEG-OUT candles.
LEG candles are formed by Imbalance between Buy Price (buyers) and Sell Price (sellers), that will lead to Demand and Supplies zones. This shows the aggression of institution in either BUY or SELL at certain price range.
Importance will be given to LEG-OUT candle.
If you see BIG Green LEG-OUT Candle, institutions are aggressive in BUYING (Bullish).
If it is RED LEG-OUT Candle, institutions are aggressive in SELLING (Bearish)
Bullish scenario:
LEG IN -- BASE -- LEG OUT
----------------------------------
Rally -- Base -- Rally
Drop -- Base -- Rally
Bearish scenario:
LEG IN -- BASE -- LEG OUT
----------------------------------
Drop -- Base -- Drop
Rally -- Base -- Drop
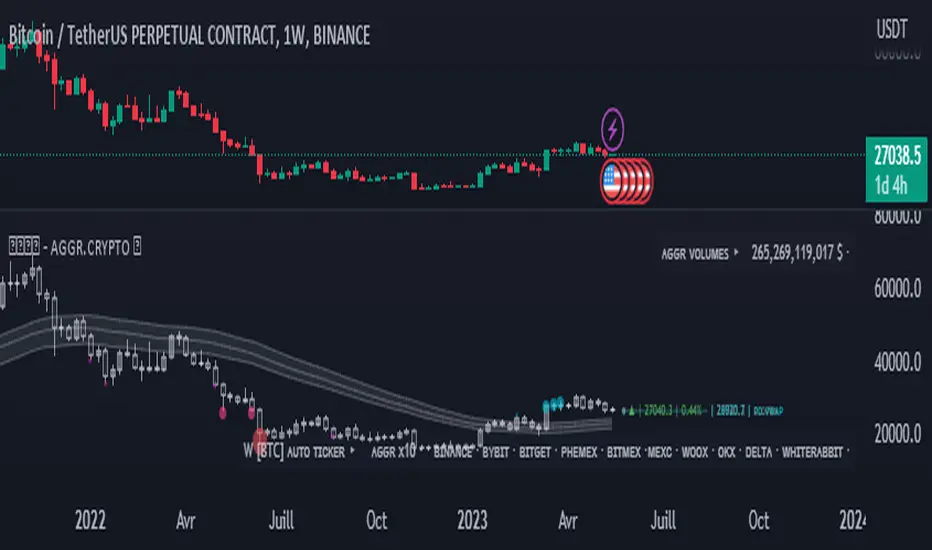
Opal - Aggr.Crypto█ OVERVIEW
The Multi-Exchange Crypto Aggregator is a unique concept ticker that gathers up to 10 tickers into one. A new OPAL Chart is created as an indicator, with its own candles and information. This information is meant to be interpreted as average information in order to reduce noise from a single ticker only. Everything is automated between assets. Our script will always check and ensure that data is received for calculations; otherwise, invalid tickers are ignored. This version is designed for Crypto Perpetual markets.
█ HOW DATA SLIPPAGE/DIFFERENCE IMPACT NOISE
This new average ticker aims to reduce noise in your candles and their live movements, avoiding most of the minor/last-second spikes, especially when they don't happen on every desired exchange at the same time. Our candles have different behaviors and highlight close-open slippage/gaps, as it seems to provide a strong reaction. Those gaps represent average slippage.
█ HOW TO USE
This should help you visualize market behaviors. Volume pressures are the origin of a lot of misunderstood things. Data analysis and observations show that makers target liquidity on both sides. Time and sessions have their own logic and will always need experience, as it is basically a gigantic Tetris game. Anyway, this should help with timing confirmations or bring confidence.
█ FEATURES
Aggregated (Tickers) Candles ▸ Aggregated OHLC candles, the idea behind the script. Set desired tickers to automate in settings. Value and Var% are displayed right next to the current candle.
Aggr. Dynamics/Levels ▸ Plot some strong levels as landmarks calculated on modified price, from Volume Weighted Average Price (VWAP) to Daily aggregated Open Price. The previous day's key level is included.
Aggr. Data Markers ▸ Plot some key markers on the chart, such as Open Pressure gaps, or estimated 3-scale liquidation bubbles with 2 confirmation modes (using different filters).
Aggr. Averages ▸ Plot up to 3 averages or HLC channels for visual ease.
█ SIGN
All of our contents are shared for educational purposes only.
Wishing you success;
OPAL - Strive for Greatness
See inside Candles: Directionality %; Constituent Bars & GapsSee inside candles based on user-input LTF setting: get data on 'Directionality' of your candle; Gaps (total and Sum; UP and DOWN); Number of Bull or Bear constituent candles
//Features:
-DIRECTIONALITY: compare length of the 'zig-zag' random walk of lower time frame constituent candles, to the full height of the current candle. Resulting % I refer to as 'directionality'.
-GAPs: what i refer to as 'gaps' are also known as Volume imbalances: the gap between previous candles close and current candle's open (if there is one).
--Gaps total (up vs down gaps). Number of Up gaps printed above bar in green, down gaps printed below bar in red.
--Gaps Sum (total summed UP gap, total summed down gaps. Sum of Up gaps printed above bar in green, Sum of down gaps printed below bar in red.
-Candles Total: Numer of LTF up vs down candles within current timeframe candle. Number of up candles printed above bar in green, Number of down candles printed below bar in red.
//USAGE:
-Primary purpose in this was the Directionality aspect. Wanted to get a measure of how choppy vs how directional the internals of a candle were. Idea being that a candle with high % directionality (approaching 100) would imply trending conditions; while a candle which was large range and full bodies but had a low % directionality would imply the internals were back-and-forth and => rebalanced, potentially indicating price may not need to retrace back into it and rebalance further. All rather experimental, please treat it as such: have a play around with it.
-Number of gaps, Sums of up and down gaps, ratio of up and down constituent candles also intended to serve a similar purpose as the above.
-Set the input lower timeframe; this must obviously be lower then your current timeframe. You will significant differences in results depending on the ratio your timeframes (chart timeframe vs user-input timeframe).
//User Inputs:
-Lower timeframe input (setting child candle size within current chart parent candle).
-Choose function from the four listed above.
-typical formating options: Bull color/bear color txt for gaps functions.
-display % unit or not.
-display vertical or horizontal text.
-Set min / max directionality thresholds; and color code results.
-Toggle on/off 'hide results outside of threshold' to declutter the chart.
-choose label style.
//NOTES:
-Directionality thresholds can be set manually; Max and Min thresholds can be set to filter out 'non-extreme' readings.
-Note that directionality % can sometimes exceed 100%, in cases where price trends very strongly and gaps up continuously such that sum of constituent candles is less than total range of parent candle.
-Personally i like the idea of seeking bold, large-range, full bodied candles, with a lower than typical directionality %; indicating that a price move is both significant and it's already done it's rebalancing; I would see this as potentially favourable for continuation (obviously depending on context).
---- Showcase of the other functions beyond Directionality percentage ----
Candles Total (bull vs Bear). ES1! Hourly; ltf = 5min: Candles total: LTF up candles and LTF down candles making up the current HTF candle (constituent number of UP candles printed above in green, Down candles printed below in red):
Gaps SUM. SPX hourly, ltf = 5min. Sum of 'UP' gaps within candle printed above in green, sum of 'DOWN' gaps printed below in red:
Gaps TOTAL: SPX hourly, ltf = 1min. Simply the total of 'up' gaps vs 'down' gaps withing our candle; based on the user input constituent candles within:

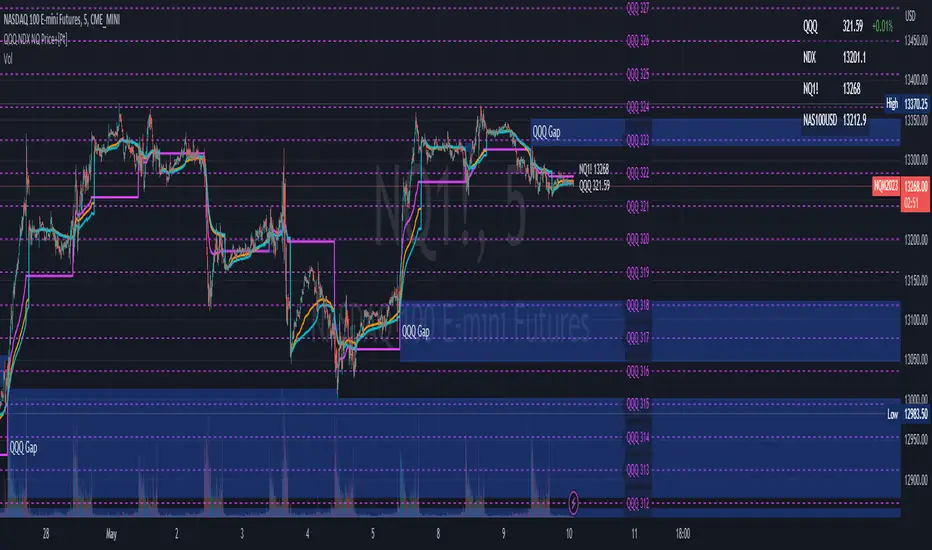
QQQ NDX NQ Price Converter+ [Pt]This is a + version of my original QQQ NDX NQ Price Converter indicator
Description
The QQQ NDX NQ Price Converter is a powerful and easy-to-use tool that allows traders to view corresponding price levels for linked instruments in real-time. This includes QQQ, NDX, NQ, and NAS100USD. Although these instruments often move in sync, differences in price movements, volume, and trading hours can create unique key levels and support/resistance areas for each. By mapping these levels on the same chart, traders can more easily spot trading opportunities and improve their chances of success.
Customizable features
- multiplier from the closest whole number price level
- line color
- line style
- label position / size
- # of levels to display
- toggle current price display table
|| ------------------------------------------------------------------------------------------------------------------------------------------------------------------------------------||
This script includes the following premium unique features.
QQQ / NDX Gaps detector
A gap is an area on a chart where the price between two bars changes significantly without any trades happening between them. Such gaps often occur when a strong shift in sentiment happens during the hours when markets are usually closed. This indicator highlights these gaps on the chart and extends them further until they have been covered (i.e., when a newer bar has crossed that gap).
Overnight gaps from QQQ or NDX can be mapped directly onto NQ chart
VWAPs
VWAPs of these linked instruments can be mapped onto the chart. For example, NQ VWAP mapped onto QQQ chart, or vise versa. This allows for clear visualization of the price action near these VWAP levels.
Custom Cross Instruments Price Targets
Want to trade QQQ options while watching NQ chart or vise versa? You can set upto 8 price targets and see the corresponding converted price level. No need to switch between charts to try to figure out which price level corresponds to which.
SPY SPX ES Price Converter+ [Pt]This is a + version of my original SPY SPX ES Price Converter indicator
Description
The SPY SPX ES Price Converter is a powerful and easy-to-use tool that allows traders to view corresponding price levels for linked instruments in real-time. This includes SPY, SPX, ES, and SPX500USD. Although these instruments often move in sync, differences in price movements, volume, and trading hours can create unique key levels and support/resistance areas for each. By mapping these levels on the same chart, traders can more easily spot trading opportunities and improve their chances of success.
Customizable features
- multiplier from the closest whole number price level
- line color
- line style
- label position / size
- # of levels to display
- toggle current price display table
|| ------------------------------------------------------------------------------------------------------------------------------------------------------------------------------------||
This script includes the following premium unique features.
SPY / SPX Gaps detector
A gap is an area on a chart where the price between two bars changes significantly without any trades happening between them. Such gaps often occur when a strong shift in sentiment happens during the hours when markets are usually closed. This indicator highlights these gaps on the chart and extends them further until they have been covered (i.e., when a newer bar has crossed that gap).
Overnight gaps from SPY or SPX can be mapped directly onto ES chart
VWAPs
VWAPs of these linked instruments can be mapped onto the chart. For example, ES VWAP mapped onto SPY chart, or vise versa. This allows for clear visualization of the price action near these VWAP levels.
Custom Cross Instruments Price Targets
Want to trade SPY options while watching ES chart or vise versa? You can setup to 8 price targets and see the corresponding converted price level. No need to switch between charts to try to figure out which price level corresponds to which.

Inversion GapsAn inverted fair value gap (FVG) occurs when candles start closing below a bullish FVG or above a bearish FVG and in this case, support FVGs become resistances and vice versa. This is a smart money concept introduced by ICT. While we a number of have indicators for FVGs, we don't have any for inversion FVGs. This indicator is just for that - it shows FVGs only after they're inverted.
The meat of it comes from being able to plot HTF inverted FVGs in LTF. In the above BTC chart, you can see M15 inverted FVGs plotted on M1 chart and you can see price respecting them. Mitigations can also be shown as lines (as you can see in the chart).
You can also setup alerts for formation and mitigation of such inversion FVGs.

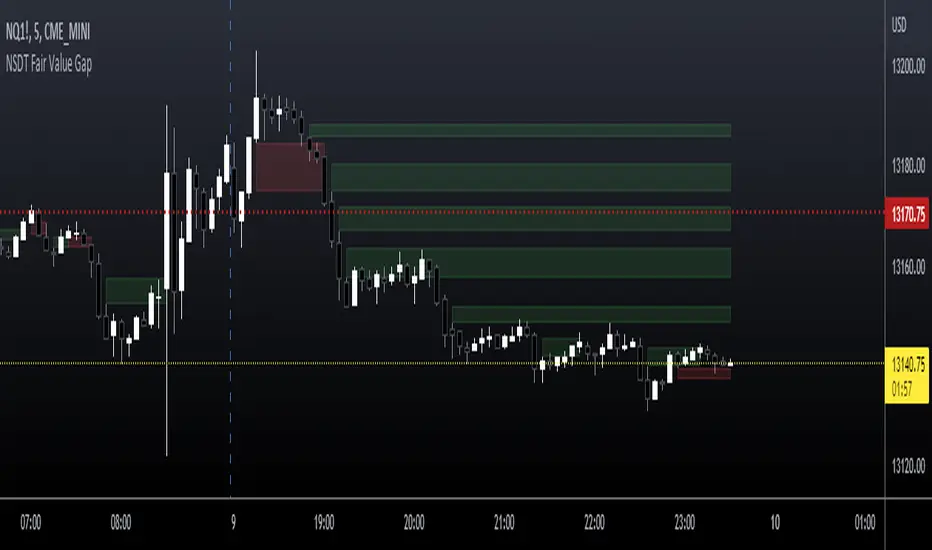
NSDT Fair Value GapThis script is our version of the "Fair Value Gap".
A Fair Value Gap is nothing more than a series of 3 candles with a gap between a candle high/low and a candle high/low two candles prior.
For example:
A Gap Up - the Low of a candle is higher than the High of two candles back.
A Gap Down - the High of a candle is lower than the Low of two candles back.
Typically, on a Gap Up, the trader would wait for the price to re-enter the Gap, and take a Long position.
Typically, on a Gap Down, the trader would wait for the price to re-enter the Gap, and take a Short position.
We found that simply trading through the Gaps (fill the gap) produced a better result. So we reversed the procedure and the colors to show our suggested direction.
We have added inputs so the trader can determine the size of the Gaps to be plotted on the chart. A minimum and maximum can be set.
The number of Gaps to be displayed can be adjusted.
There is a option to remove Gaps that had been filled, to help keep a clean chart.
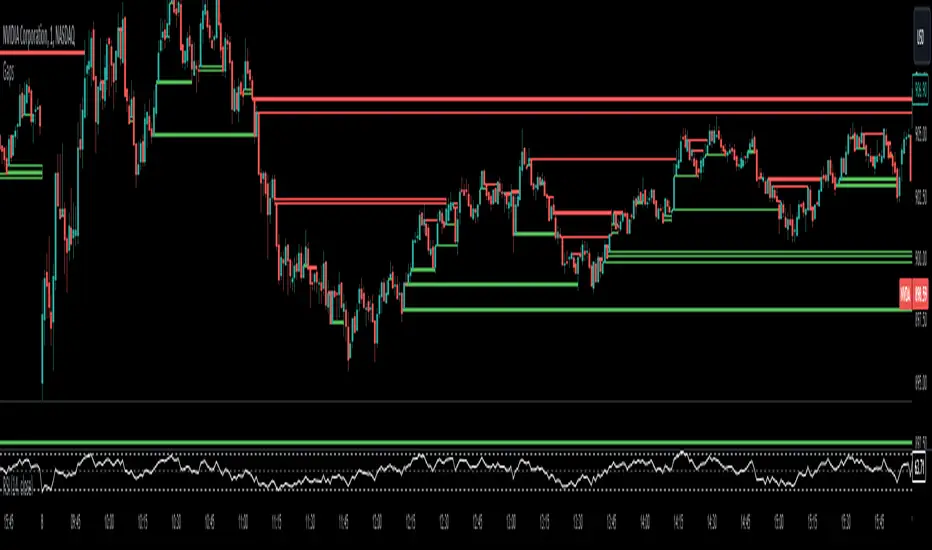
Gaps [Kioseff Trading]Hello!
This script "Gaps" is a continuation and improvement on a subset indicator included in the "Quartile Volume; Volume Aggregation; US Range Bars; Gaps)" script!
As advised by @thebearfib, the "Gaps" indicator is now standalone!
Features
Stat: Avg. Bars to Fill Up Gap
Stat: Avg. Bars to Fill Down Gap
Stat: Cumulative Up Gap % Increase
Stat: Cumulative Down Gap % Increase
Stat: Avg Up Gap % Increase
Stat: Avg Down Gap % Decrease
Nearest Unfilled Up Gaps and Down Gaps Displayed in Table
% Price Move Requirement, Including Dollar Amount, for Nearest Unfilled Gaps to Fill
Gaps Marked on Chart, Including Partially Filled Gaps and The % Amount a Partially Filled Gap Has Been Violated
Gaps Chart
The image above shows the data tables included in the indicator!
Settings
The image above shows various settings for the indicator!
The image above shows how partially filled gaps are marked using the default settings.
Exceeded price areas are shaded darker; however, by selecting the "No Partially Filled Gaps" option, the indicator will treat partially filled gaps differently.
The image above shows alternative behavior! Instead of the gap changing color it narrows in size.
The image above shows the indicator's behavior when selecting to show gap data in labels.
Therefore, when a gap is small and the box text is imperceptible, you can select to show the data in a label.
Additionally, you can select to display a "Gaps Chart".
The image above shows this feature enabled. The gaps chart shows the sequence of price gaps for the asset as candlesticks.
Thank you for checking this out; if you'd like other features included please let me know!
