GBPUSD

SupertrendIndicatorSupertrend (13,2.5) & Supertrend (18,3) are best for intraday.
Loving the signals.


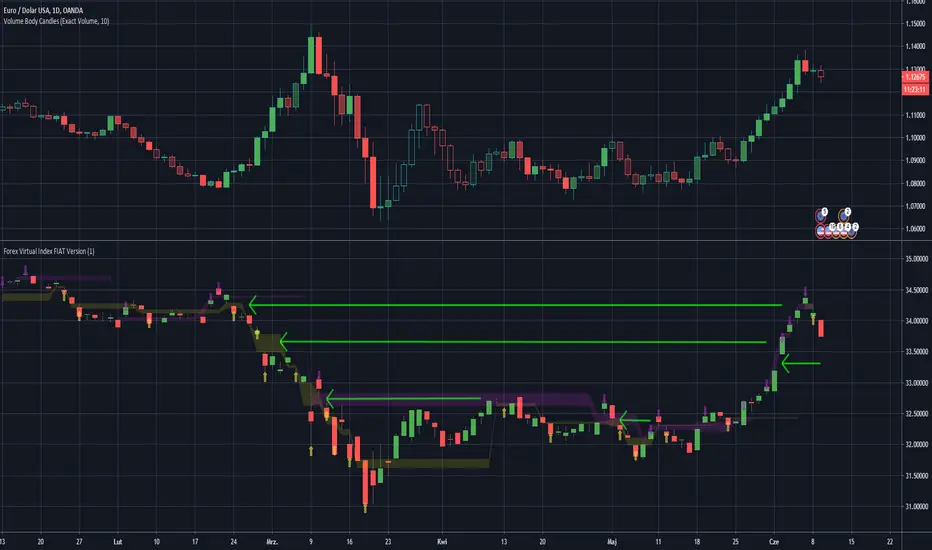
Forex Virtual Index FIAT VersionThis is virtually created FX Fiat pairs index based on OANDAs data.
Pairs are: EUR/USD , AUD/USD , GBP/USD , NZD/USD , AUD/JPY , EUR/JPY , GBP/JPY , USD/JPY , USD/CAD , USD/PLN
Be awared that some pairs like USD/CAD , have reversed correlation to the index.
You may look at the gaps as on standard S/R levels.
ps. Take look inside the scirpt's settings.
ps2. This script is invite-only for the members of our trading group (info in signature, group is free of charge).
Open Close Profit - [Alerts]This script comes with the following indicators and features:
Moving Average trend filter (Hull, ZLEMA, McGinley)
Pin Bar Filter
MACD indicator
Pump and Dump filter
Entry, Take Profit, and Stop Loss Alerts
And a few more indicators in the back-end to increase accuracy, optimize entries and filter out sideways PA
This script works really well as a scalper on lower Time Frames as well as on higher Time Frames. Besides that you can also use it on pretty much any coin or asset.
This script is not repainting. We advise to use alerts on “Once Per Bar Close”.
If you’d like to automate this script you can do that by using AutoView, ProfitView, ProfitTrailer, CryptoHopper etc.
Leave a message if you’d like to try it out.

Expert studio strategy 1 - GBPUSDThis is part of a series of strategies developed automatically by a online software.
I cannot share the site url, which is not related to me in any way, because it is against the TV reules.
This strategy was optimized for GBPUSD, timeframe 1D, fixed lots 0.1, initial balance 1000€.
LOGIC:
- LONG ENTRY when previous candle is bear
- LONG EXIT: RVI > signal line
- SHORT ENTRY when previous candle is bull
- SHORT EXIT: RVI < signal line
NOTE: I considered the open of actual candle instead of close otherwise there will be a back shift of 1 candle in pine script
Take profit = no
Stop loss = no
I have also a study with alarms.
Please use comment section for any feedback.

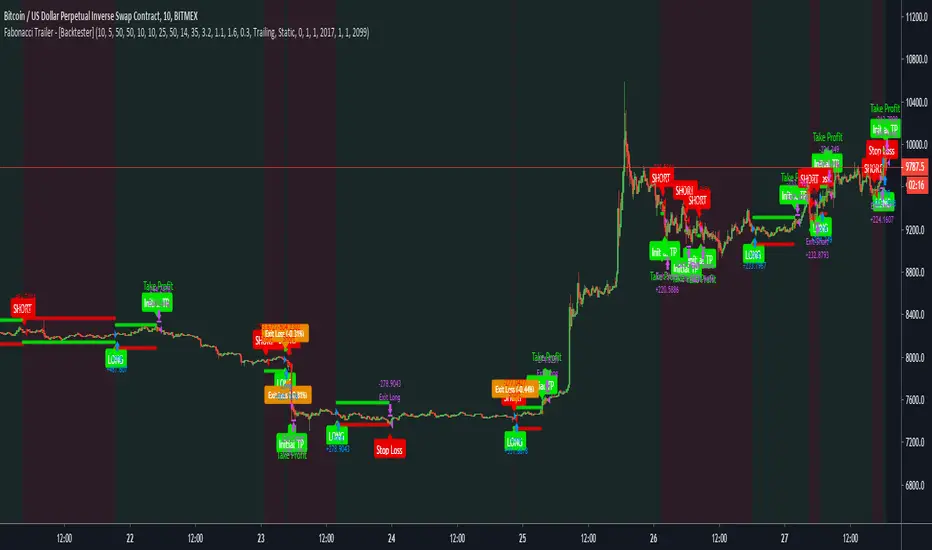
Fabonacci Trailer - [Backtester]This study comes with the following indicators and features:
ADX indicator
Chop indicator
Super Trend indicator
Trailing Take Profit and Stop Loss
Entry, Take Profit, and Stop Loss Alerts
Renko chart support
And a few more indicators in the back-end to increase accuracy and optimize entries
The study version with all alerts can be found in my profile. It is not repainting and we advise to use alerts on “Once Per Bar Close”.
Please note that this script is based on invite only.
Fabonacci Trailer - [Alerts]This script comes with the following indicators and features:
ADX indicator
Chop indicator
Super Trend indicator
Trailing Take Profit and Stop Loss
Entry, Take Profit, and Stop Loss Alerts
Renko chart support
And a few more indicators in the back-end to increase accuracy and optimize entries
This script works really well as a scalper on lower Time Frames as well as on higher Time Frames. Besides that you can also use it on pretty much any coin or asset.
This script is not repainting. We advise to use alerts on “Once Per Bar Close”.
If you’d like to automate this script you can do that by using AutoView, ProfitView, ProfitTrailer, CryptoHopper etc.
Please note that this script is based on invite only.

MA Crossover [Alerts]This is a Moving Average Crossover study .
The study comes with all alerts (Long, Short, Take Profit, and Stop Loss).
A few visuals like Exit Loss and Profit/Loss Boxes have been added as well.
The following Moving Averages are supported:
SMA
EMA
DEMA
TEMA
WMA
VWMA
SMMA
HullMA
LSMA
ALMA
SSMA
TMA
ZLEMA
If you’d like to automate this script you can do that by using AutoView, ProfitView, ProfitTrailer, CryptoHopper etc.
Feel free to leave a comment and share it with your friends. Enjoy!

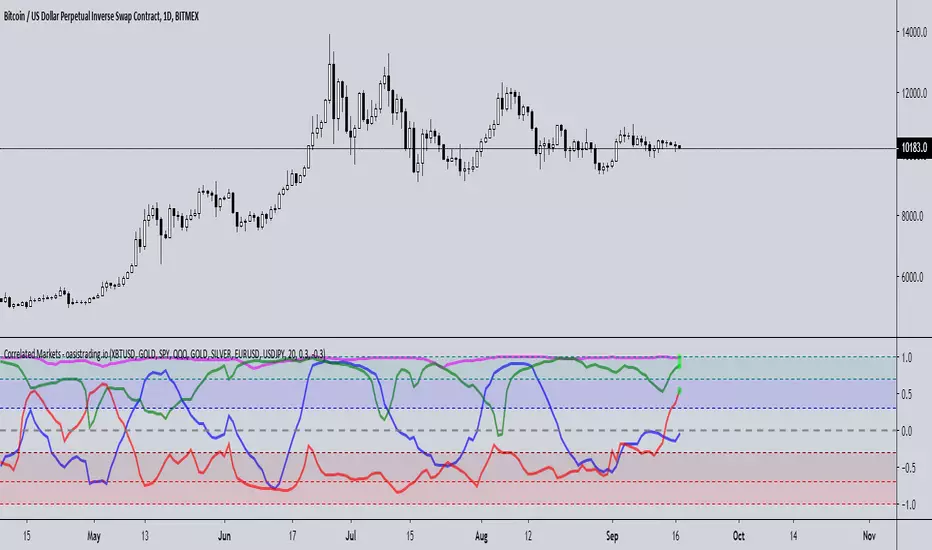
Correlated MarketsThis indicator is free to all Oasis Trading Group members.
This indicator reads correlations between two symbols of your choice, and displays 4 correlations at the same time.
The upper and lower thresholds are user-definable, alerts and visual indications are given when the line crosses the level.
This indicator uses a correlation coefficient which ranges between -1.0 and +1.0.
A correlation of +1.0 implies a perfect correlation while -1.0 implies the two pairs are in complete opposition.
This is useful not only in Forex trading but also for managing or diversifying your portfolio or for finding patterns,
for example when two Forex pairs move independently or an altcoin splits from BTC .
A circle on the +1 line will display for a positive correlation (or whatever you set the threshold to and vice versa for the -1 line.
Alerts are also available for each correlation pair.
For Access or Questions: Private message us. Thank you.
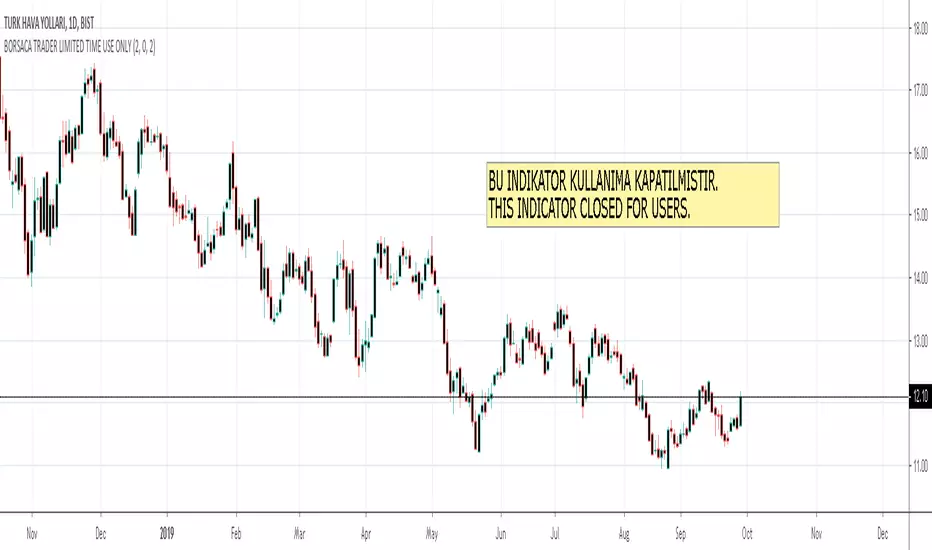
BORSACA TRADER LIMITED TIME USE ONLYThis indicator does NOT REPAINT. If the signal occurs it will be forever. Easy and profitable strategy optimized for Crypto, Foreks and Stock Markets...
This indicator gives you Long and Exit signals all timeframes...
BORSACA TRADER is optimized to catch trend movements as soon as possible and maximize profitability.
Strategy tester results. 96% Profitable on BTCUSD Daily scale. Test other markets you want.
WE RELY ON OUR INDICATOR TO THE END. AND WE ASSURE YOU THERE IS NOTHING BETTER THAN THE BORSACA TRADER INDICATOR.
Best regards and happy trading.
Herif's winning strategy option. Check the strategy tester results success than %96
Safe Mode as optional parameter. You can enable this to prevent some riskier trades to happen at the cost of some profitability. Use it if you are more conservative in trading.
Normal Mode signals for Buy and Sell.
Trade Mode signals for buy and sell use with support and resistance levels.
Auto Support And Resistance..
Auto Fibonacci Levels...
BORSACA TRADER indicator is the best option for everybody in financial markets. Check my Profile Page for more information and follow me, like and favorite my indicator and support your positive response and take a message for 10 days trial.
Happy trading. Good luck :)
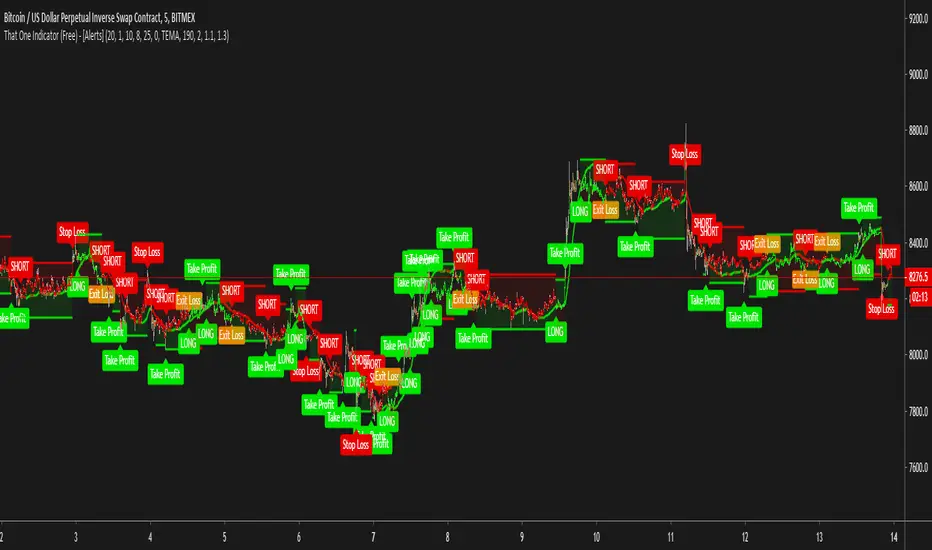
That One Indicator (Free) - [ALERTS]This script comes with the following indicators:
Bollinger Bands
Stochastic
Moving Average Trend Confirmation Filter (EMA, SMA)
Long/Short Alerts
Stop Loss Alerts
And a few more indicators in the back-end to increase accuracy
This script works really well as a scalper on lower Time Frames as well as on higher Time Frames. Besides that you can also trade it on pretty much any coin or asset.
This script is not repainting. We advise to use alerts on “Once Per Bar Close” .
If you’d like to automate this script you can do that by using AutoView, ProfitView, ProfitTrailer, CryptoHopper etc.
Alerts are set very clearly as Long and Short to avoid confusion.
A new script is being published soon with a lot more functionality, which includes noise filtering, all MA Types, RSI and other types of volatility measurements to filter out “less profitable” trades.
Feel free to leave a comment and share it with your friends.
GBPIndexGBP Index based on a basket of the following currencies
EURGBP, 49%
GBPUSD, 18%
GBPJPY, 3.4%
GBPCNH, 9.0%
GBPCHF, 3.2%
GBPCAD, 1.4%
GBPAUD, 1.4%
Use this index with a moving average to determine when to go long or short on GBP pairs, except for EURGBP. If index above Moving Average you have the green light to open Long positions. If below Moving Average you have green light to open Short positions.
For EURGBP you would open Long if index is below moving average and open Short when index is above moving average

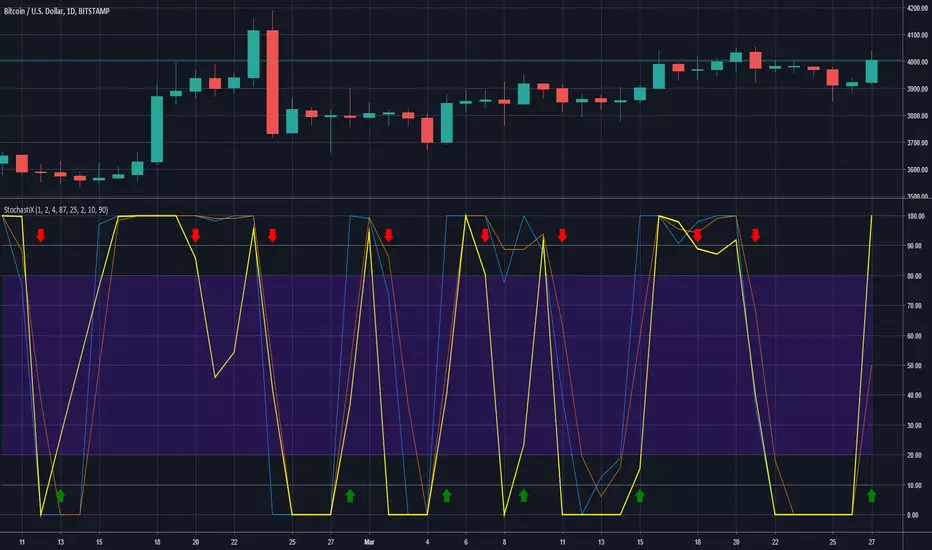
StochastiXThere ya go!!! You actually came to the best indicator there is out there. I hope you enjoy it. If you have any questions just hit me on the chat and i will answer you the best i can. Have a good one ;)
USD/JPY/GBP/EUR merged from BTCxFIATBTC market 24h 365D (data from BitFinex BTCxFIAT)
BitUSDJPY = BTCJPY / BTCUSD
BitEURJPY = BTCJPY / BTCEUR
BitGBPJPY = BTCJPY / BTCGBP
BitEURUSD = BTCUSD / BTCEUR
BitGBPUSD = BTCUSD / BTCGBP
BitEURGBP = BTCGBP/ BTCEUR
It may complement the holiday time of forex
this indicator need to apply on BTC chart(virtual currency cahrt)


Forex CorrelationsA utility tool to find linear relationships between different currency pairs and
specified symbols. This is another private indicator of mine.
Features
37 well known Forex pairs
3 correlation display modes ( Positive and Negative , Positive , Negative )
Ability to specify any symbol to see correlations
Ability to specify a preferred timeframe
Readable and optimized code
Supported pairs
USDCAD
USDMXN
USDBRL
USDCHF
USDRUB
USDTRY
USDZAR
USDJPY
USDCNY
USDHKD
CADCHF
CADJPY
EURUSD
EURCAD
EURGBP
EURCHF
EURRUB
EURTRY
EURJPY
EURCNY
EURAUD
EURNZD
GBPUSD
GBPCAD
GBPJPY
GBPCNY
GBPAUD
GBPNZD
AUDUSD
AUDCAD
AUDCHF
AUDJPY
AUDCNY
AUDNZD
NZDUSD
NZDJPY
NZDCNY

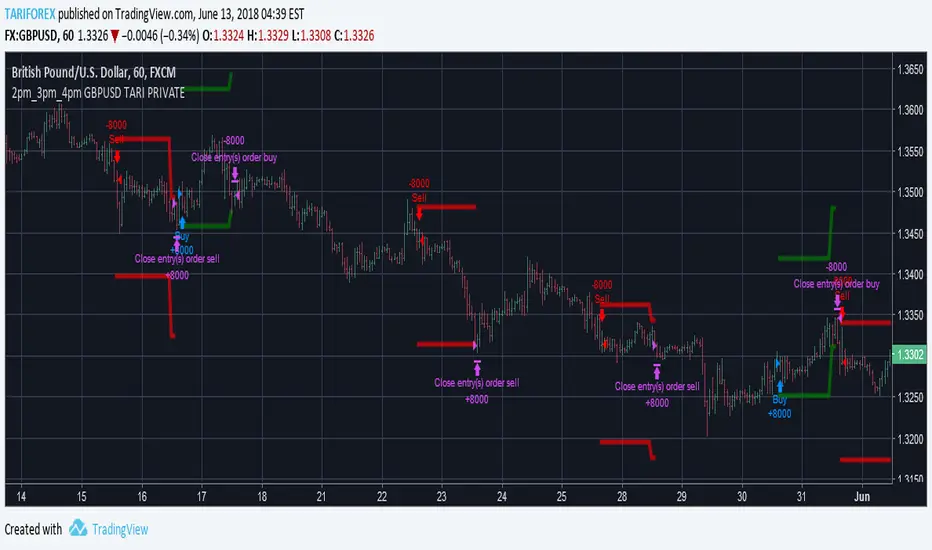
2pm_3pm_4pm GBPUSD TARI PRIVATEFX:GBPUSD
This strategy is only for GBPUSD on 1h chart.
You can get maximum 1 signal per day, so you have to watch the chart only a few minutes per day.
The signal to buy or to sell will apper at 2pm or at 3pm or at 4pm UCT+2 (Rome).
With the signal you will see 2 lines to set Take Profit and Stop loss.
If the position doesn't reach the TP or the SL you have to close the position at 1pm of the day after (TP and SL change to exit_trade)
The idea behind this strategy is to gain because of the afternoon volatility for this pair.
You can modify the amount to invest.
The standard version is set for a initial capital to invest on this strategy of 1.000 USD, and every trade is set to invest around 4,5% of the initial capiatl, so the SL is around 45 USD. This is very important for the Risk Management, and has a Risk/Reward ratio around 2.
Looking at the equity line we see a profit almost 3 times the initial capital, and a DD of 1 third of it.
To use this strategy subscribe at 40€/month. Find more on my FB page.
Wish you the best guys!
Tari.
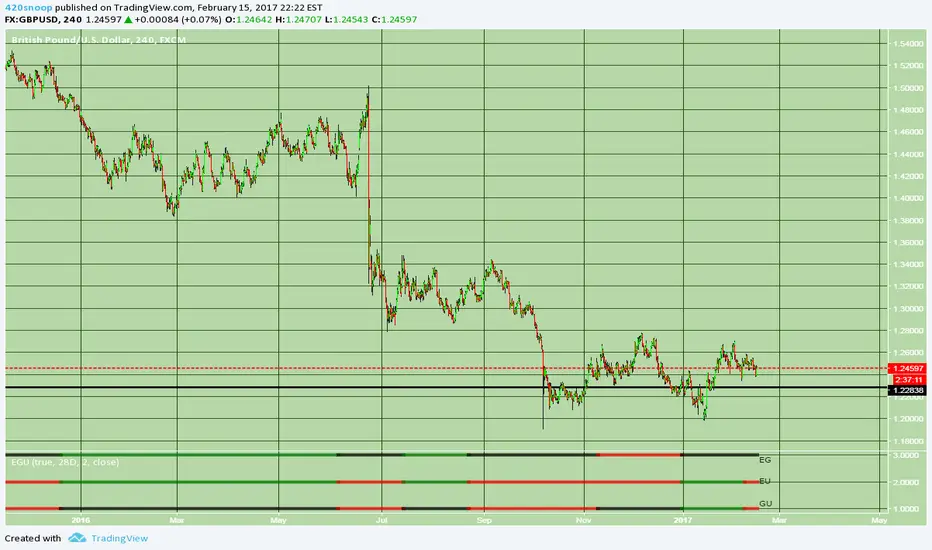
GBPUSD Strength [420]Similar to EU str but optimized for GU
This one has alerts and some other features
Msg me for access :)
xoxo
snoop
(link to euro/dollar old version no alerts etc)
HL2 - 22 EMA Cross for RenkoEURUSD
This is a simple strategy to use for those who like Renko bars. I ONLY use it on Renko.
Basic idea is that when the Renko bar closes above or below the 22 EMA, you go long or short.
However, some of the frustrations I've had with any strategy shared in Tradingview is so few folks put in the ability to set a stop or a profit target or the ability to set a specific time to trade. I have added those to this strategy. (And I for the life of me can not remember where I got the code for the the time, I need to find you!).
Special note: If you have never used the Renko bars in Tradingview, make sure you click the Format option next to whatever pair you are looking at and change it from Traditional to ATR. You can set it for a static pip amount if you want. But ATR at first will help you decide which amount of pips you should throw in.
This is my first published strategy so if I screwed up on anything or didn't explain it very well, please let me know!!

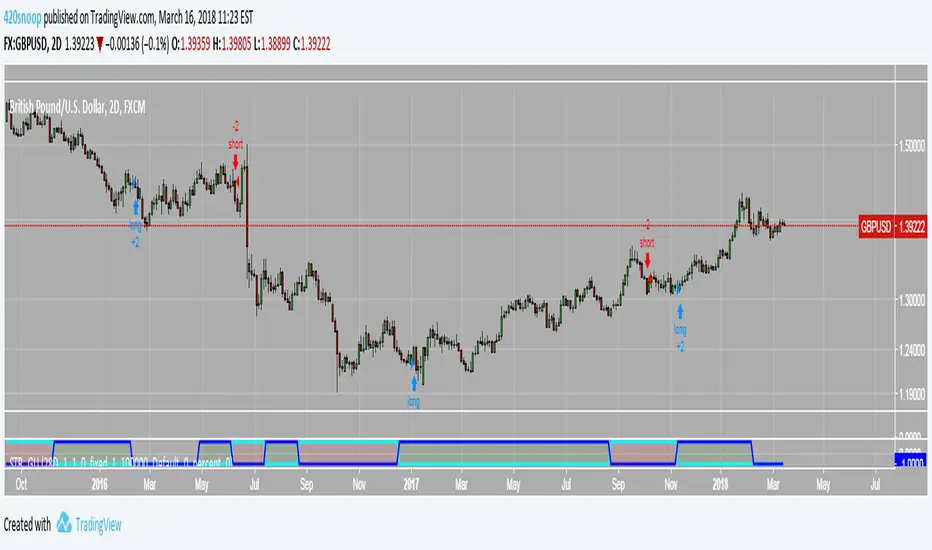
EGU TriageHey all snoop here with another basket idea: this time I'm tackling a triage trading system for EG EU and GU.
If you have been following the Euro Dollar strength script at all you would have seen that the last 2 or 3 trades that I was using it for were successful. Presented here is an indicator that is actually 3 of the same 'kind' of script that the euro dollar strength script was where the indicator essentially outputs that for the XXX/YYY pair if XXX gains against the basket and YYY loses against the basket green coloring and if XXX loses against the basket and YYY gains against the basket red coloring; the lines are plotted at 3 (the top line) as the Euro GBP strength, line at 2 as Euro Dollar strength, and the 1 line (bottom) as GBP dollar strength.
Essentially you can use this exactly the same as the EU strength script was used (go long on green of the corresponding line for the symbol or another way would be if all the signals were printing a 'clear' relationship.
example:
3 reads red, 2 reads red, 1 reads red ... meaning: EG, E>U, GU>G... we would want to long EG in this case.
another riskier way to use this script is to 'carry over' the last printed signal.
for example see how EG is printing black (E=G) well the last signal was red (E
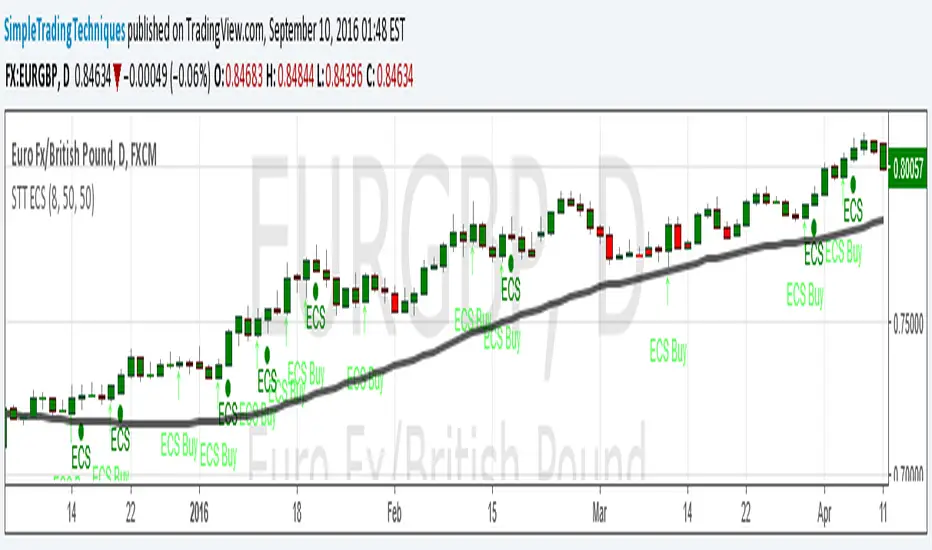
ENGULFING CANDLESTICK STRATEGY(i) Arrow represent trade setup
(ii) Circle represent triggering of the trade
--------------------------------------------------------------------
1. Where to place stop loss?
2. Where to exit the trade?
3. How to protect gains in your trade?
4. How to apply money management rule?
5. How to trade gap opening?