Ash_TheTrader: Institutional Truth / Volume ProfileSTOP GUESSING. See the Institutional Truth. (No Repaint)
Most retail traders are trading blind. You are looking at lagging moving averages and "magic" lines that disappear when the price moves against them.
The institutions? They are trading Liquidity.
For months, I have been developing a proprietary engine that strips away the noise and reveals the Statistical Truth of the market. This is not just another "buy/sell" indicator. This is an Institutional Liquidity Engine designed to show you exactly where the money is hiding.
Introducing: Ash_TheTrader: Institutional Truth
👁️ What is "The Truth"?
This script utilizes an Auto-Anchored Liquidity Engine that automatically detects the start of true market cycles. It builds a real-time profile of volume, delta, and imbalance to answer one simple question: Who is actually in control?
It features a "Black Box" Signal Engine that refuses to repaint. If it says BIAS ↑ , the institutional flow is bullish. Period.
🚀 Key Features
• 🚫 NO REPAINT Bias: Signals are mathematically locked. They never disappear. • 🏦 Institutional Logic: It filters out "Retail Traps." If price hasn't reclaimed the Value Level (POC), it won't signal a trade—saving you from buying the top. • ⚡ Dual-Core Engine: Switch between Swing Mode (Macro Trends) and Scalp Mode (M1/M5 Aggressive Algorithms). • 🧱 Liquidity Walls: Bright Neon blocks appear where 75%+ of volume is one-sided. This is where you place your limit orders.
📚 Step-by-Step: How to Trade "The Truth"
1. Choose Your Engine Go to Settings > Algorithm Mode. • Select "Normal (Swing)" for H1/H4 trend trading (Higher Winrate). • Select "Scalp (Aggressive)" for M1/M5/M15 (Faster Signals).
2. The "Green Light" Setup (Long) • Wait for the Dashboard: Look for the signal ✅ SWING BIAS ↑ or ⚡ SCALP BIAS ↑ . • Check the Trap: Ensure the text does NOT say "⚠️ TRAP." • Entry: Enter on the close of the candle. • Stop Loss: Place below the Yellow "Truth" Level (Point of Control) or the recent Swing Low.
3. The "Brick Wall" Scalp • If you see a bright NEON RED block appear on the profile, that is a Bearish Wall . • Price will often bounce off this level aggressively. • Strategy: Place a Sell Limit order at the Neon Red block for a quick reaction trade.
4. The Divergence Warning • Keep an eye on the bottom banner of the dashboard. • If you are Long, but you see a big RED "BEARISH DIV" warning, take profit immediately. The institutions are leaving the trade.
⚠️ A Warning This tool is powerful, but it reveals the reality of the market. Sometimes the Dashboard will say "⚠️ ACCUMULATING" or "⚠️ NEUTRAL." Do not force a trade. The secret to a high winrate is knowing when not to trade. Let the engine do the work.
Add it to your chart now. Stop guessing.
Cheers, @Ash_TheTrader
Gold

Ash_TheTrader Algo : Smart Structure & Liquidity🚀 The "Code" to Market Structure: How to Find the Real Trend with "Ash_TheTrader Algo"
Why do 90% of traders fail? Because they try to catch falling knives instead of riding the wave.
They buy support in a downtrend. They sell resistance in an uptrend. They get crushed by the "Trend."
But seeing the real Market Structure in real-time is hard... until now.
I have engineered the Ash_TheTrader Algo to solve the biggest problem in trading: Directional Bias. It automates Institutional Market Structure (SMC) so you never trade against the flow of money again.
Here is how to use the "Structure & Zones" engine to trade like a pro.
---
🧠 THE ENGINE: How "Ash_TheTrader " Maps the Market
Retail traders look at price. Institutions look at Structure . This Algo visualizes the institutional roadmap:
1. The Roadmap (Smart Structure): It automatically detects BOS (Break of Structure) for trend continuation and CHoCH (Change of Character) for trend reversals. No more guessing if the trend has changed.
2. The Fortress (Smart Zones): It draws High-Timeframe (HTF) Supply & Demand zones. Crucially, these are Auto-Flipping —if a Supply Zone is broken, it turns into Demand instantly.
3. The Verification (Dashboard): It doesn't just show one timeframe. It checks if the LTF (Lower Timeframe) and HTF (Higher Timeframe) structures align.
---
📉 THE STRATEGY: The "Zone & Structure" Play
Stop taking random trades. Use this "Structure-First" checklist.
🟢 SETUP 1: The "Trend Continuation" Buy
Step 1: Check the Bias.
Look at the Dashboard. Is the HTF Trend 🟢 ? If yes, we are only looking for Buys. Do not fight the big money.
Step 2: The Pullback to the Wall.
Wait for price to drop into a Blue Zone (HTF Demand) or a Flipped Support Zone .
Patience is key. Let the price come to your fortress.
Step 3: The Structure Shift (The Trigger).
Once inside the zone, we need proof that buyers are stepping in.
▪️ Look for a Bullish CHoCH or BOS label to print.
▪️ Watch the Dashboard Pace turn Green (▲▲) .
👉 ENTRY: On the close of the candle that creates the BOS/CHoCH.
🛑 STOP LOSS: Below the recent Structural Low or the Blue Zone.
🎯 TAKE PROFIT: The next unmitigated Red Zone (Supply) or the Weak High.
---
🔴 SETUP 2: The "Structural Reversal" Sell
Step 1: Identify the Exhaustion.
Price rallies into a major Orange Zone (HTF Supply) . The Dashboard shows Pace is slowing down or hitting extreme exhaustion.
Step 2: The Break of the Floor.
Do not sell just because it touched the line. Wait for the algo to print a Bearish CHoCH .
This confirms that the uptrend structure has been broken and bears are in control.
Step 3: Dashboard Confirmation.
Check the Dashboard:
▪️ Is the LTF Trend flipping to Red? 🔴
▪️ Is the Volume validating the move?
👉 ENTRY: On the retest of the broken structure or immediately after the CHoCH.
🛑 STOP LOSS: Above the Structural High or the Orange Zone.
🎯 TAKE PROFIT: The next Blue Zone (Demand) or Weak Low.
---
⚡ PRO TIPS: MASTERING THE ZONES
▪️ The "Zone Flip" is Powerful: If price smashes through an Orange Supply Zone with a strong BOS , that zone will turn Blue . This "Flip" is often the highest probability entry for a retest trade.
▪️ Full Alignment = Full Risk: When the Dashboard shows HTF 🟢 AND LTF 🟢 , you have "Full Alignment." These are your A+ setups. Increase confidence here.
▪️ Don't ignore the Sweeps: Even when trading structure, keep an eye on the Sweep 🧹 labels. A Sweep of a low followed by a CHoCH is the strongest reversal signal in existence.
---
📥 HOW TO START
Market Structure is the language of the banks. This tool translates it for you.
1. Add "Ash_TheTrader Algo : Smart Structure & Liquidity" to your chart.
2. Go to Settings -> Visuals. Ensure "Show BOS / CHoCH" and "Show HTF Zones" are ON.
3. Study the Flow: Look at how price respects the Blue/Orange zones. Notice how the Trend colors on the Dashboard predict the next leg.
Stop guessing the direction. Let the Structure guide you.
Trade Smart, Stay Disciplined.
~ @Ash_TheTrader

The Anh - Scalping 1M Pro V1 LOCKEDScalping 1M - Đánh nhanh, rút lẹ . Cần liên hệ chủ sở hữu để lấy Key kích hoạt .

Quantum EdgeQuantum Edge
DESCRIPTION:
Time-based cycle alignment scanner using fractal cycle theory to detect when multiple timing cycles converge at mathematically significant zones.
█ OVERVIEW
Quantum Edge is a time-based cycle alignment scanner built on fractal cycle theory. Markets move in nested cycles across multiple timeframes. This indicator detects moments when several of these cycles simultaneously reach mathematically significant positions, creating potential turning points.
The core concept: when multiple independent timing cycles converge at key zones, the probability of a reaction increases. The more cycles aligned, the higher the probability score.
█ HOW IT WORKS
The indicator tracks multiple time-based cycles of varying lengths. Each cycle is analyzed for its current position within its phase. When a cycle reaches a statistically significant zone (based on cycle theory), it contributes points to a composite probability score.
Shorter cycles contribute fewer points (they align frequently).
Longer cycles contribute more points (they align rarely).
Additional weighting is applied for:
- Specific days of the week known for higher volatility
- Specific times of day associated with market structure shifts
The final score represents how many timing factors are currently aligned.
█ SIGNALS EXPLAINED
👑 Rare multi-cycle convergence — Several long-duration cycles aligned simultaneously. Occurs a few times per month.
💎 Strong convergence — Multiple mid-to-long duration cycles aligned. Occurs a few times per week.
🌅 Daily cycle alignment — Daily-length cycle at a key zone with supporting factors. Occurs 1-2 times per day.
🔥 Short cycle alignment — Shorter-duration cycles aligned. Occurs several times per day.
🔮 Prediction — The indicator scans ahead and displays where future alignments are likely to occur based on the deterministic nature of time cycles.
█ TRADING MODES
The indicator includes preset modes that adjust sensitivity:
SNIPER — Only displays the highest-scoring alignments. For patient traders waiting for the best setups.
DAILY — Displays daily-quality alignments and above. Recommended starting point for most traders.
ACTIVE — Displays more frequent setups. For traders who want more opportunities and can filter with price analysis.
SCALP — Displays all qualifying alignments. Highest frequency, requires additional confirmation.
█ WHAT MAKES THIS UNIQUE
This indicator uses a proprietary weighted scoring system based on fractal cycle mathematics. The specific cycle lengths, zone calculations, and weighting factors are the result of extensive research into cyclical market behavior.
The predictive feature is deterministic — because time cycles are mathematical, future alignments can be calculated in advance. This allows traders to plan entries before setups occur rather than reacting after the fact.
The source is protected because the specific parameters and scoring logic represent significant research and development.
█ INTENDED USE
This is a TIMING tool, not a directional signal generator.
It answers: "When are multiple cycles aligned?"
It does NOT answer: "Which direction should I trade?"
Combine with your own price analysis (support/resistance, order flow, market structure) to determine direction. Use this tool to identify WHEN those setups have higher probability.
█ LIMITATIONS
- No indicator predicts the future with certainty
- Cycle alignments indicate probability, not guaranteed outcomes
- Past alignment results do not guarantee future performance
- This tool requires combination with price-based analysis for best results
- Not all alignments result in tradeable moves
█ SETTINGS
- Mode Selection: Choose your preferred sensitivity level
- Show Score: Toggle probability scores on/off
- Show Predictions: Toggle future alignment predictions on/off
- Prediction Range: How far ahead to scan for alignments
- Colors: Customize signal colors to your preference
█ MARKETS AND TIMEFRAMES
Works on any liquid market: Futures, Forex, Crypto, Stocks, Indices.
Optimized for intraday timeframes (1-15 minute charts) but can be applied to higher timeframes for swing trading applications.
█ ACCESS
This is an invite-only script. If you have questions about the methodology or would like to discuss access, you may send me a direct message.

Forexsebi - GOLD Psychological Levels - TrendflowPsychological GOLD levels every $50 with clear zones, highlighted $100 & $500 levels, SMA 50 & 200, and a multi-timeframe trend table. Perfect for structure, trend, and rejection trading on XAUUSD.
Psychologische GOLD-Levels in 50-Dollar-Abständen mit klaren Zonen, 100- & 500-Dollar-Highlights, SMA 50 & 200 sowie einer Multi-Timeframe Trend-Tabelle. Ideal für Struktur-, Trend- und Rejection-Trading auf XAUUSD.
Key Features
Psychological Gold Levels
Automatic levels every $50
Adjustable number of levels above and below current price
Highlighted zones around each level for clearer reaction areas
Special Level Highlighting
$100 levels (xx00) highlighted for medium importance
$500 levels (x000 / x500) marked as major psychological levels
Different colors and stronger line thickness for key zones
Price Labels
Clean price labels displayed on the chart
Special symbols for 100 and 500 dollar levels
Trend Analysis with SMAs
SMA 50 & SMA 200 plotted directly on the chart
Individually toggleable
Clear color separation for fast trend recognition
Multi-Timeframe SMA Trend Table
Trend status (BULLISH / BEARISH / NEUTRAL) across:
5M, 15M, 1H, 4H, 1D
Logic: Price relative to SMA 50 & SMA 200
Color-coded, easy-to-read table
Displays the current trading session (Asia, Frankfurt, London, NY)
Info Box
Current Gold price
Nearest psychological level above and below price
Alert System
Alerts when price approaches a psychological level
User-defined alert distance
Distinction between normal, $100 and $500 levels

GoldHook Reversal ProGoldHook Reversal Pro v7 is an advanced market structure indicator designed to identify high-probability turning points. It automatically detects where price is accumulating—and monitors for specific momentum shifts that signal a valid Breakout or Reversal. By filtering out market noise with its "Smart Adaptive" logic, it helps traders distinguish between false moves and genuine trend opportunities, providing clear entry signals with built-in risk management targets.

XAUMO MegaBar VSA by Mohamed Mahmoud XAUMO MegaBar VSA — Smart Money Breakout & Reversal Engine for XAUUSD
(Educational Use Only)
1) WHAT THIS INDICATOR DOES
XAUMO MegaBar VSA is an institutional-style smart money engine for XAUUSD designed to show you what professional money is doing, not just where price is moving.
It combines:
- MegaBar detection on 1H and 15m
- VSA (Volume Spread Analysis) events
- VPOC / WVPOC and volume clusters
- Liquidity sweeps, CHoCH, order blocks, FVGs
- Full Fibonacci leg mapping (retracements + extensions)
- Pre-built execution ladders (Entry, SL, TP1–TP4, Reverse Fib trades)
All in one dashboard with:
- Color-coded candles
- Clean, ATR-offset labels
- Optional tables and debug panels
So traders can quickly decide:
“Is this move driven by smart money, or is it just noise?”
2) CORE MODULES & FEATURES
A) SESSION + ACCUMULATION / DISTRIBUTION CONTEXT
- Session filter: London, New York, Overlap, or custom.
- Accumulation / distribution zones shaded on chart with adjustable colors/opacity.
- Quick legend so you always know if the market is in “smart money accumulation” or “distribution”.
HOW TRADERS USE IT:
Focus only on your trading session and instantly see if volume is building (accumulation), unloading (distribution), or flat. This helps you avoid trading in dead liquidity.
--------------------------------------------------
B) MEGABAR ENGINE + FIB MAP
- Automatically detects “MegaBars” (institutional candles) on 15m and 1H.
- Uses body size, range, and volume to pick only meaningful bars.
- Builds a full Fibonacci map from each active MegaBar:
• Retracements: 0, 13, 23.6, 38.2, 50, 61.8, 78.6, 86.2, 100, and -33.
• Extensions: 125% up to 600%+ (configurable ladder).
- Per-level style controls:
• Color, width, line style (solid/dotted/dashed).
• Optional price labels with ATR-based offsets.
- Main Fib legend that explains shallow / normal / deep reload zones.
HOW TRADERS USE IT:
You stop guessing where to buy or sell. You trade around the institutional leg:
- Buy dips into defined reload zones after bullish MegaBars.
- Sell rallies into extension zones after bearish MegaBars.
- Use clean, pre-mapped structure for both scalps and swings.
--------------------------------------------------
C) VSA ENGINE + CANDLE LABELING
- Detects a full set of VSA events such as:
• No Demand / No Supply
• Stopping Volume
• Absorption
• Springs / Upthrusts
• Buying Climax / Selling Climax
• Bullish / Bearish EVR
• Tests and confirmed VSA signals at S/R
- Enhances with:
• Body vs total range analysis
• Wick dominance for exhaustion vs aggression
• Momentum and volume confirmation filters
HOW TRADERS USE IT:
Each label becomes a “comment” from smart money on the chart:
- “No Demand” near resistance + weak RVOL = skip long entries.
- “Stopping Volume” + spring at Fib reload zone + VPOC cluster = potential high-quality long.
- Combine VSA with the MegaBar Fib map and volume profile for structured decisions.
--------------------------------------------------
D) SUPERSONIC BREAKOUT ENGINE
- Calculates a breakout strength score using:
• RVOL and volume expansion
• Spread expansion vs recent bars
• Body quality (body vs range)
• Bar progress (how much of the candle’s time has elapsed)
- Differentiates:
• Potential vs confirmed breakouts
• Strong, volume-backed moves vs weak spikes
- Optional debug label explaining:
• Momentum score
• Volume ratio and RVOL
• Spread behaviour
• Body quality
• Bar elapsed %
HOW TRADERS USE IT:
You avoid chasing every big candle.
You only act when:
- Breakout strength is high,
- Volume confirms the move,
- Structure (Fib / VPOC / CHoCH) is aligned.
--------------------------------------------------
E) VPOC / WVPOC CLUSTERS & DYNAMIC ZONES
- Tracks real-time VPOC and WVPOC.
- Identifies VPOC/WVPOC clusters as powerful S/R zones.
- Confirms bullish or bearish breaks when price clears these levels with volume.
- Provides dynamic SL and TP logic:
• SL near/behind VPOC with ATR buffer.
• TP ladders aligned with volume structure.
HOW TRADERS USE IT:
You anchor your risk to where the most volume traded, not random price points:
- Use VPOC as a rational stop placement.
- Treat VPOC/WVPOC clusters as “coiled springs” – zones where large moves often start.
--------------------------------------------------
F) SMART MONEY ENTRY ENGINE (1H + 15M MEGABARS)
- Uses MTF `request.security` logic to bring 1H MegaBars into lower timeframes.
- Identifies:
• 1H + 15m confluence entries (A-grade setups).
• Single-TF entries (B-grade setups).
- Pre-calculates for each scenario:
• Entry level (Fib-based within the MegaBar range).
• Stop loss (beyond range or leg-based).
• TP1–TP4 along Fib extensions / structure.
- Labels show:
• “Entry = …”
• “SL = …”
• “TP1 = … / TP2 = … / TP3 = … / TP4 = …”
with adjustable font size and ATR-based offsets.
- Optional “show only latest” mode to keep your chart clean.
- Alert-ready so you can receive notifications when conditions are met.
HOW TRADERS USE IT:
You get a fully defined execution ladder:
- The engine tells you where a logical entry is,
- Where a logical SL should be,
- And how to scale out with multiple targets.
You can use:
- Confluence setups for main trades,
- Single-TF setups for more frequent but lower conviction trades.
--------------------------------------------------
G) REVERSE FIB TRADING MODULE
- Triggers after extended moves when key TPs are hit.
- Looks for:
• Rejection candles at or beyond major extensions.
• Exhaustion + VSA confirmation.
- Builds a reverse (counter-trend) Fib plan:
• Counter-trend entry from extension extremes.
• TP ladder based on 0.618, 0.786, 1.236, 1.382, 1.5, 1.618, 2.0, etc.
• SL and TSL based on ATR and Fib distance.
- ATR timeframe adapts to chart timeframe.
HOW TRADERS USE IT:
You can fade overextended moves once structure and P/A agree:
- Trend traders can use it to tighten or exit.
- Counter-trend traders can structure “fade” setups with defined risk.
--------------------------------------------------
H) LIQUIDITY SWEEPS, CHoCH, ORDER BLOCKS, FVGs
- Detects sweeps above highs and below lows (liquidity grabs).
- Marks CHoCH (Change of Character) when structure flips with volume.
- Basic smart money order block detection (bullish / bearish).
- FVGs (Fair Value Gaps) shaded on chart, removed when filled.
HOW TRADERS USE IT:
Combine sweeps + CHoCH + MegaBar + VSA + VPOC:
- Join clean, volume-backed continuations.
- Fade obvious stop hunts when they reject into strong zones.
--------------------------------------------------
I) VSA + BREAKOUT DASHBOARD TABLE (OPTIONAL)
- Compact table with:
• VSA context
• Breakout score
• RVOL / volume status
• Spread and candle quality
• ATR regime
• Close position within the bar
• VPOC and elapsed bar percentage
HOW TRADERS USE IT:
Before pressing the button, glance at the table:
- Is volatility supportive?
- Is volume confirming?
- Is this a clean breakout or a tired move?
This pushes you toward rule-based execution and away from impulse.
--------------------------------------------------
3) TYPICAL TRADING WORKFLOW WITH XAUMO MEGABAR VSA
A) Pick timeframe and session
- Use 15m or 1H on XAUUSD.
- Align the indicator’s session inputs with your actual trading hours.
B) Read context first
- Check accumulation / distribution zones.
- Look at VSA events and the breakout engine.
- Note where VPOC / WVPOC are relative to price.
C) Find the active MegaBar and its Fib structure
- Identify the most recent bull/bear MegaBar.
- See if price is:
• Pulling back into reload zones,
• Breaking out of them,
• Or extending into high-risk zones.
D) Wait for smart money confirmation
- Look for:
• Confluence setups (1H + 15m MegaBars),
• Strong breakout score,
• Valid VSA signals,
• Helpful structure: CHoCH, FVG, sweeps.
E) Execute using the printed ladders
- Use the on-chart Entry / SL / TP labels as your execution framework.
- Adjust lot size and risk % according to your own plan.
F) Manage and exit
- Use ATR / VPOC logic to trail or lock profits.
- Rotate to reverse Fib setups if extensions look exhausted.
4) WHO THIS INDICATOR IS FOR
- Gold traders (XAUUSD CFD or spot) on 15m and 1H.
- Traders who prefer institutional structure (volume, VPOC, SMC, Fib) over simple indicators.
- Traders who want pre-structured entries, SL, and TP ladders without losing flexibility.
- Advanced students of VSA and smart money concepts who want everything in one tool.
5) FULL EDUCATIONAL DISCLAIMER (READ CAREFULLY)
- This indicator and all descriptions are for EDUCATIONAL PURPOSES ONLY.
- NOTHING in this script, its labels, tables, alerts, outputs, or documentation is:
• Investment advice
• Trading advice
• A recommendation to buy or sell any asset
• A signal service or portfolio management tool
- Markets are risky. Trading leveraged instruments such as CFDs, futures, or margin products involves a HIGH RISK of loss, including the possible loss of ALL invested capital.
- Past performance, backtests, or hypothetical examples DO NOT guarantee future results.
- Any probabilities, scores, or “quality levels” shown by the indicator are purely algorithmic and DO NOT represent guarantees or promises of profit.
- You are solely responsible for:
• Your position sizing
• Your leverage
• Your entries, exits, and risk management
• Compliance with local regulations and tax rules
- Before trading live with real money, you should:
• Thoroughly backtest and forward-test the indicator.
• Use a demo account to understand how signals behave in real time.
• Consult a licensed financial professional if you need personalised investment or trading advice.
- By using this indicator:
• You accept that the author and any associated entities or brands (including XAUMO, XAUMO indicators, and any promotional text) bear NO LIABILITY for any financial losses, missed gains, or decisions you make based on this tool.
• You agree that you are acting entirely at your own risk and that all outputs are informational and educational, not prescriptive trading instructions.
In short:
Use XAUMO MegaBar VSA as a powerful educational and analytical companion,
NOT as a substitute for your own independent judgment, testing, and risk control.
=====================================================
XAUMO MegaBar VSA — محرّك البريك آوت و الريفرسال بتاع السمارت ماني للدهب
( استخدام تعليمي بس)
1) المؤشّر ده بيعمل إيه؟
XAUMO MegaBar VSA معمول مخصوص للـ XAUUSD عشان يورّيك "الفلوس الكبيرة" بتتحرك إزاي،
مش بس السِعر رايح فين.
بيجمع في حتّة واحدة:
- رصد MegaBar على الساعة والربع ساعة
- VSA (Volume Spread Analysis) – سلوك الفوليوم جوّه الشمعة
- VPOC / WVPOC و تجمّعات الفوليوم المهمّة
- سويپس لليكويديتي + CHoCH + Order Blocks + FVGs
- خريطة فيبوناتشي كاملة (Retrace + Extensions)
- سلالم تنفيذ جاهزة (Entry, SL, TP1–TP4 + صفقات Reverse Fib)
وكل ده:
- بألوان واضحة على الشموع
- لِيبلات متظبّطة بـ ATR Offset
- Tables و Panels اختيارية
عشان المتداول يسأل نفسه:
"الحركة دي بتاعة سمارت ماني؟ ولا مجرد دوشة ملوش لازمة؟"
2) أهم الموديولات اللي جوّه المؤشّر
A) الكونتكست بتاع السيشن + تجميع/توزيع
- فلتر جلسات: لندن – نيو يورك – overlap – أو وقت تحطّه انت.
- مناطق Accumulation / Distribution متظلّلة بألوان أنت بتختارها.
- لچند بسيط يوضّح لك السوق دلوقتي: تجميع؟ توزيع؟ ولا نايم.
المتداول يستخدمه إزاي؟
تركّز بس في الجلسة اللي انت شغّال فيها، وتشوف فورًا:
فيه بناء مراكز؟ فيه تصريف؟ ولا مفيش فوليوم أصلاً؟
ده يقلّل دخولك في أوقات السوق فيها “ميت”.
--------------------------------------------
B) محرّك الـ MegaBar + خريطة الفيبوناتشي
- المؤشّر يلقط لوحده الـ MegaBars (شموع مؤسّسات) على 15m و 1h.
- بيعتمد على: حجم الجسم، مدى الشمعة، الفوليوم.
- يرسم خريطة فيبوناتشي كاملة من الرجل الأساسية:
• Retrace: 0, 13, 23.6, 38.2, 50, 61.8, 78.6, 86.2, 100, -33
• Extensions: من 125% لحد 600%+ (سلم قابل للتعديل)
- لكل مستوى:
• لون / سماكة / ستايل (سوليد – دوتيد – داشد)
• ليبل سِعر مع Offset بـ ATR
- لچند يشرح لك Reload Zones: ضحلة / عادية / عميقة.
المتداول يستخدمه إزاي؟
بدل ما “تخمّن” فين تشتري وتبيع:
- تشتري الدِپ جوّه مناطق Reload بعد MegaBar صاعد.
- تبيع الريبوند جوّه Extensions بعد MegaBar هابط.
- عندك هيكل واضح للسوينج والسكالب من غير فوضى.
--------------------------------------------
C) VSA + لِيبلات على الشموع
- يكتشف أحداث VSA زي:
• No Demand / No Supply
• Stopping Volume
• Absorption
• Spring / Upthrust
• Buying / Selling Climax
• EVR (شموع مجنونة فوليومًا)
• Tests و Confirmed Signals عند الدعوم/المقاومات
- مع تحسينات:
• تحليل Body vs Range
• مين اللي غالب؟ جسم الشمعة ولا الذيول؟
• فلتر Momentum + Volume
المتداول يستخدمه إزاي؟
كل ليبل على الشمعة = كومنت من السمارت ماني:
- No Demand عند مقاومة + RVOL ضعيف → بلاش تشتري.
- Stopping Volume + Spring جوّه Reload Zone + VPOC → فرصة قوية للشراء.
- توصل بين VSA + Fib + VPOC فتفهم “مين بيكسب المعركة”.
--------------------------------------------
D) محرّك البريك آوت Supersonic
- بيحسب Score للقوة بتاعة البريك آوت من:
• RVOL + Volume Expansion
• توسّع السبريد مقارنة بالشموع السابقة
• جودة جسم الشمعة (جسم ولا ذيل)
• نسبة الوقت اللي عدّى من الشمعة الحالية
- يفرّق بين:
• بريك آوت محتمل vs مؤكد
• حركة قوية مدعومة بفوليوم vs “شمعة شو”
- يقدر يطلع ليبل Debug يشرح:
• Momentum Score
• Volume Ratio / RVOL
• Spread Behaviour
• Body Quality
• % الوقت اللي فات من عمر الشمعة
المتداول يستخدمه إزاي؟
ماتجريش ورا كل شمعة كبيرة:
- استنَى لما يكون الـ Score عالي،
- والفوليوم مصدّق الحركة،
- والهيكل (Fib / VPOC / CHoCH) موافق.
ساعتها بس البريك آوت يستاهل المخاطرة.
--------------------------------------------
E) VPOC / WVPOC + مناطق الفوليوم
- يرقب VPOC و WVPOC في الوقت الحقيقي.
- يحدّد Clusters مهمة تتحوّل لـ Support / Resistance محترم.
- يراقب كسر المناطق دي بفوليوم واضح (بداية موجة جديدة).
- SL و TP ديناميك:
• SL حوالين VPOC مع Buffer من ATR.
• TP متوزع على مستويات فيبوناتشي و زونات فوليوم.
المتداول يستخدمه إزاي؟
بتربط مخاطرتك بأين اشتغل الفوليوم التقيل:
- VPOC = منطق منطقي للستوب.
- Clusters = زون ضغط ينفع يبدأ منها ترند قوي.
--------------------------------------------
F) محرّك الدخول بتاع السمارت ماني (1h + 15m MegaBars)
- يجيب MegaBars بتاعة الساعة جوّه فريمات أقل بالـ `request.security`.
- يميّز:
• Confluence بين MegaBar الساعة + MegaBar الربع ساعة (صفقة A-Grade).
• MegaBar على فريم واحد بس (B-Grade).
- يجهّز تلقائيًا:
• Entry
• SL
• TP1–TP4 على Extensions و مستويات هيكلية.
- اللّيبلات تكتب:
• Entry = …
• SL = …
• TP1 = … / TP2 = … / TP3 = … / TP4 = …
مع تحكّم في حجم الخط و ATR Offset.
- فيه اختيار “أظهر آخر سيناريو بس” عشان الشارت يفضل نضيف.
- جاهز للـ Alerts لما الشروط تكمّل.
المتداول يستخدمه إزاي؟
يبقى عندك Execution Ladder كامل:
- فين تدخل،
- فين تحط الستوب،
- إزاي تقسم الخروج على أكتر من هدف.
--------------------------------------------
G) موديل الـ Reverse Fib (صفقات عكس الاتجاه)
- بيشتغل بعد ما السعر يبالغ في الحركة و يوصل Extensions معيّنة.
- يدور على:
• شموع رفض عند/بعد Extensions.
• Exhaustion + إشارة VSA.
- يرسم خطة عكسية:
• Entry عكسي من Extension Extreme.
• TP سلم مبني على 0.618, 0.786, 1.236, 1.382, 1.5, 1.618, 2.0, … إلخ
• SL و TSL مبنيين على ATR و مسافة الفيبوناتشي.
المتداول يستخدمه إزاي؟
لو انت ترند تريدر:
- تستخدمه عشان تقفل/تخفف عند تمدّد مبالغ فيه.
لو انت Counter-Trend:
- يديك سيناريو “فِيد” منطقي بمخاطرة محسوبة.
--------------------------------------------
H) سويپس لليكويديتي + CHoCH + Order Blocks + FVGs
- يوسم مناطق ضرب الستوبات فوق الهاي وتحت اللو (Liquidity Grabs).
- يحدد CHoCH لما الاتجاه يغيّر شخصيته مع فوليوم.
- يرصد Order Blocks أساسية (Bullish / Bearish).
- يظلّل الـ FVGs و يشيلها لما تتعبّى.
المتداول يستخدمه إزاي؟
تجمع بين:
MegaBar + VSA + Fib + VPOC + Liquidity:
- يا إمّا تلحق موجة نظيفة،
- يا إمّا تفِيد Stop Hunt غبي اتكشف على الشارت.
--------------------------------------------
I) داشبورد VSA + Breakout (Table اختياري)
- Table صغيرة فيها:
• حالة VSA
• قوة البريك آوت
• RVOL / Volume
• Spread & Candle Quality
• حالة ATR
• مكان الإغلاق جوّه الشمعة
• وضع VPOC
• نسبة الوقت اللي عدّى من الشمعة
المتداول يستخدمه إزاي؟
قبل ما تدوس Buy / Sell:
- تبص على التابل ثانيتين:
الدنيا شغّالة ولا لأ؟
فيه فوليوم؟ فيه ترند؟ ولا حركة ميتة؟
ده يقلل قرارات “من غير plan”.
3) سيناريو شغل متداول على XAUMO MegaBar VSA
1) اختار الفريم + الجلسة
- 15m أو 1h على XAUUSD.
- ظبّط سيشن لندن/نيويورك زي وقت شغلك الحقيقي.
2) اقرأ الكونتكست
- السوق بيبنِي مراكز؟ بيصفّي؟ ولا نايم؟
- إيه إشارات الـ VSA و Score البريك آوت؟
- فين VPOC / WVPOC من السعر؟
3) دور على MegaBar النشط و خريطة الفيبوناتشي بتاعته
- السعر:
• بيرجّع جوّه Reload Zone؟
• بيكسر البرنچ؟
• ولا داخل على Overextension؟
4) استنَى تأكيد السمارت ماني
- Confluence بين MegaBar الساعة والربع ساعة.
- Breakout Score محترم.
- VSA منطقي (No Demand, Stopping Volume, Spring, …).
- Structure: CHoCH / FVG / Liquidity Sweep في اتجاه الصفقة.
5) نفّذ باستخدام السلم المطبوع على الشارت
- استخدم Entry / SL / TP1–TP4 كـ هيكل أساسي.
- عدّل اللوت / الريسك حسب خطتك انت.
6) الإدارة والخروج
- استعمل ATR + VPOC في Trailing/Lock.
- لما Extensions تبان مبالغ فيها → ركّز على Reverse Fib.
4) المؤشّر ده مناسب لمين؟
- اللي بيتاجر دهب XAUUSD (CFD أو Spot) على 15m و 1h.
- اللي بيحب شغل مؤسّسات: Volume, VPOC, SMC, Fib مش مؤشرات بسيطة.
- اللي عايز Execution Plan جاهز (Entry/SL/TP) بس لسه عنده حريّة تعديل.
- اللي عايز يتعلّم VSA و Smart Money Concepts بشكل تطبيقي على شارت واحد.
5) إخلاء مسؤولية كامل (مهم تقراه)
- المؤشّر ده وكل الكلام اللي حواليه للتعليم بس.
- مش:
• نصيحة استثمارية،
• ولا توصية شراء/بيع،
• ولا خدمة إدارة محافظ،
• ولا سيجنال سيرڤس.
- التداول في الأسواق (خصوصًا المشتقات، الـ CFD، الفيوتشر) فيه مخاطرة عالية جدًا،
وممكن تخسر جزء كبير أو كل رأس مالك.
- أي أداء سابق، باك تست، أو مثال افتراضي → مش ضمان لنتيجة مستقبلية.
- أي نسبة احتمالات، Scores، أو “Quality” بيطلعها المؤشّر:
• دي حسابات كود، مش ضمان ربح،
• مش وعد ولا تعهّد بأي نتيجة.
- انت المسؤول 100% عن:
• حجم العقود اللي بتدخلها،
• الرافعة اللي بتستخدمها،
• أماكن الدخول والخروج،
• وإدارة المخاطرة بتاعتك،
• والتزامك بالقوانين والضرائب في بلدك.
- قبل ما تستخدم المؤشّر على حساب حقيقي:
• جرّب كويس على باك تست و فورورد تست،
• اشتغل فترة على Demo،
• لو محتاج نصيحة مالية شخصية → ارجع لمستشار مالي مرخَّص.
باختصار:
XAUMO MegaBar VSA ده أداة تعليمية وتحليلية قوية تساعدك تفهم حركة الذهب،
مش زرار “اطبع فلوس”.
انت صاحب القرار، وانت صاحب المسؤولية، وانت اللي بتتحمّل أي ربح أو خسارة.

XAU BUY/SELL Scalping Strategy M5 PROFX:XAUUSD
This XAU/USD Pro Scalping Strategy is tailored specifically for the M5 timeframe , designed to capture rapid Gold price movements. Instead of relying on lagging indicators, this system utilizes advanced Price Action and Market Structure analysis to identify high-probability entry zones.
The core strength of this strategy lies in its built-in Money Management engine and Multi-threaded Trailing Stop system, ensuring capital preservation and profit maximization.
🚀 Key Features:
1. Smart Price Action Recognition:
The algorithm scans for specific market scenarios to apply dynamic Risk:Reward ratios (ranging from 1:1 to 1:3).
Filters out noise and false breakouts using multi-candle analysis.
Auto Position Sizing:
Calculates trade quantity automatically based on your defined Risk % per Trade .
Ensures consistent risk management regardless of the Stop Loss distance.
Intelligent Trailing Stop:
Uses a dynamic trailing mechanism based on "R" multiples (Risk Units).
Automatically secures profits by moving SL based on the specific setup type ("Case") of each trade.
Safety Filters:
Min SL and Max SL inputs prevent trades during periods of extremely low volatility or excessive risk.
⚙️ Settings:
Risk % per Trade: The percentage of equity to risk per trade (Recommended: 1.0% - 2.0%).
Min/Max SL Points: Dynamic boundaries for Stop Loss to adapt to current market volatility.
💡 Recommendations:
Symbol: XAUUSD / Gold - FXCM.
Timeframe: M5.
Best performance during London and New York sessions.

MACD Forecast Colorful [DiFlip]MACD Forecast Colorful
The Future of Predictive MACD — is one of the most advanced and customizable MACD indicators ever published on TradingView. Built on the classic MACD foundation, this upgraded version integrates statistical forecasting through linear regression to anticipate future movements — not just react to the past.
With a total of 22 fully configurable long and short entry conditions, visual enhancements, and full automation support, this indicator is designed for serious traders seeking an analytical edge.
⯁ Real-Time MACD Forecasting
For the first time, a public MACD script combines the classic structure of MACD with predictive analytics powered by linear regression. Instead of simply responding to current values, this tool projects the MACD line, signal line, and histogram n bars into the future, allowing you to trade with foresight rather than hindsight.
⯁ Fully Customizable
This indicator is built for flexibility. It includes 22 entry conditions, all of which are fully configurable. Each condition can be turned on/off, chained using AND/OR logic, and adapted to your trading model.
Whether you're building a rules-based quant system, automating alerts, or refining discretionary signals, MACD Forecast Colorful gives you full control over how signals are generated, displayed, and triggered.
⯁ With MACD Forecast Colorful, you can:
• Detect MACD crossovers before they happen.
• Anticipate trend reversals with greater precision.
• React earlier than traditional indicators.
• Gain a powerful edge in both discretionary and automated strategies.
• This isn’t just smarter MACD — it’s predictive momentum intelligence.
⯁ Scientifically Powered by Linear Regression
MACD Forecast Colorful is the first public MACD indicator to apply least-squares predictive modeling to MACD behavior — effectively introducing machine learning logic into a time-tested tool.
It uses statistical regression to analyze historical behavior of the MACD and project future trajectories. The result is a forward-shifted MACD forecast that can detect upcoming crossovers and divergences before they appear on the chart.
⯁ Linear Regression: Technical Foundation
Linear regression is a statistical method that models the relationship between a dependent variable (y) and one or more independent variables (x). The basic formula for simple linear regression is:
y = β₀ + β₁x + ε
Where:
y = predicted variable (e.g., future MACD value)
x = independent variable (e.g., bar index)
β₀ = intercept
β₁ = slope
ε = random error (residual)
The regression model calculates β₀ and β₁ using the least squares method, minimizing the sum of squared prediction errors to produce the best-fit line through historical values. This line is then extended forward, generating a forecast based on recent price momentum.
⯁ Least Squares Estimation
The regression coefficients are computed with the following formulas:
β₁ = Σ((xᵢ - x̄)(yᵢ - ȳ)) / Σ((xᵢ - x̄)²)
β₀ = ȳ - β₁x̄
Where:
Σ denotes summation; x̄ and ȳ are the means of x and y; and i ranges from 1 to n (number of observations). These equations produce the best linear unbiased estimator under the Gauss–Markov assumptions — constant variance (homoscedasticity) and a linear relationship between variables.
⯁ Regression in Machine Learning
Linear regression is a foundational model in supervised learning. Its ability to provide precise, explainable, and fast forecasts makes it critical in AI systems and quantitative analysis.
Applying linear regression to MACD forecasting is the equivalent of injecting artificial intelligence into one of the most widely used momentum tools in trading.
⯁ Visual Interpretation
Picture the MACD values over time like this:
Time →
MACD →
A regression line is fitted to recent MACD values, then projected forward n periods. The result is a predictive trajectory that can cross over the real MACD or signal line — offering an early-warning system for trend shifts and momentum changes.
The indicator plots both current MACD and forecasted MACD, allowing you to visually compare short-term future behavior against historical movement.
⯁ Scientific Concepts Used
Linear Regression: models the relationship between variables using a straight line.
Least Squares Method: minimizes squared prediction errors for best-fit.
Time-Series Forecasting: projects future data based on past patterns.
Supervised Learning: predictive modeling using labeled inputs.
Statistical Smoothing: filters noise to highlight trends.
⯁ Why This Indicator Is Revolutionary
First open-source MACD with real-time predictive modeling.
Scientifically grounded with linear regression logic.
Automatable through TradingView alerts and bots.
Smart signal generation using forecasted crossovers.
Highly customizable with 22 buy/sell conditions.
Enhanced visuals with background (bgcolor) and area fill (fill) support.
This isn’t just an update — it’s the next evolution of MACD forecasting.
⯁ Example of simple linear regression with one independent variable
This example demonstrates how a basic linear regression works when there is only one independent variable influencing the dependent variable. This type of model is used to identify a direct relationship between two variables.
⯁ In linear regression, observations (red) are considered the result of random deviations (green) from an underlying relationship (blue) between a dependent variable (y) and an independent variable (x)
This concept illustrates that sampled data points rarely align perfectly with the true trend line. Instead, each observed point represents the combination of the true underlying relationship and a random error component.
⯁ Visualizing heteroscedasticity in a scatterplot with 100 random fitted values using Matlab
Heteroscedasticity occurs when the variance of the errors is not constant across the range of fitted values. This visualization highlights how the spread of data can change unpredictably, which is an important factor in evaluating the validity of regression models.
⯁ The datasets in Anscombe’s quartet were designed to have nearly the same linear regression line (as well as nearly identical means, standard deviations, and correlations) but look very different when plotted
This classic example shows that summary statistics alone can be misleading. Even with identical numerical metrics, the datasets display completely different patterns, emphasizing the importance of visual inspection when interpreting a model.
⯁ Result of fitting a set of data points with a quadratic function
This example illustrates how a second-degree polynomial model can better fit certain datasets that do not follow a linear trend. The resulting curve reflects the true shape of the data more accurately than a straight line.
⯁ What is the MACD?
The Moving Average Convergence Divergence (MACD) is a technical analysis indicator developed by Gerald Appel. It measures the relationship between two moving averages of a security’s price to identify changes in momentum, direction, and strength of a trend. The MACD is composed of three components: the MACD line, the signal line, and the histogram.
⯁ How to use the MACD?
The MACD is calculated by subtracting the 26-period Exponential Moving Average (EMA) from the 12-period EMA. A 9-period EMA of the MACD line, called the signal line, is then plotted on top of the MACD line. The MACD histogram represents the difference between the MACD line and the signal line.
Here are the primary signals generated by the MACD:
• Bullish Crossover: When the MACD line crosses above the signal line, indicating a potential buy signal.
• Bearish Crossover: When the MACD line crosses below the signal line, indicating a potential sell signal.
• Divergence: When the price of the security diverges from the MACD, suggesting a potential reversal.
• Overbought/Oversold Conditions: Indicated by the MACD line moving far away from the signal line, though this is less common than in oscillators like the RSI.
⯁ How to use MACD forecast?
The MACD Forecast is built on the same foundation as the classic MACD, but with predictive capabilities.
Step 1 — Spot Predicted Crossovers:
Watch for forecasted bullish or bearish crossovers. These signals anticipate when the MACD line will cross the signal line in the future, letting you prepare trades before the move.
Step 2 — Confirm with Histogram Projection:
Use the projected histogram to validate momentum direction. A rising histogram signals strengthening bullish momentum, while a falling projection points to weakening or bearish conditions.
Step 3 — Combine with Multi-Timeframe Analysis:
Use forecasts across multiple timeframes to confirm signal strength (e.g., a 1h forecast aligned with a 4h forecast).
Step 4 — Set Entry Conditions & Automation:
Customize your buy/sell rules with the 20 forecast-based conditions and enable automation for bots or alerts.
Step 5 — Trade Ahead of the Market:
By preparing for future momentum shifts instead of reacting to the past, you’ll always stay one step ahead of lagging traders.
📈 BUY
🍟 Signal Validity: The signal will remain valid for X bars.
🍟 Signal Sequence: Configurable as AND or OR.
🍟 MACD > Signal Smoothing
🍟 MACD < Signal Smoothing
🍟 Histogram > 0
🍟 Histogram < 0
🍟 Histogram Positive
🍟 Histogram Negative
🍟 MACD > 0
🍟 MACD < 0
🍟 Signal > 0
🍟 Signal < 0
🍟 MACD > Histogram
🍟 MACD < Histogram
🍟 Signal > Histogram
🍟 Signal < Histogram
🍟 MACD (Crossover) Signal
🍟 MACD (Crossunder) Signal
🍟 MACD (Crossover) 0
🍟 MACD (Crossunder) 0
🍟 Signal (Crossover) 0
🍟 Signal (Crossunder) 0
🔮 MACD (Crossover) Signal Forecast
🔮 MACD (Crossunder) Signal Forecast
📉 SELL
🍟 Signal Validity: The signal will remain valid for X bars.
🍟 Signal Sequence: Configurable as AND or OR.
🍟 MACD > Signal Smoothing
🍟 MACD < Signal Smoothing
🍟 Histogram > 0
🍟 Histogram < 0
🍟 Histogram Positive
🍟 Histogram Negative
🍟 MACD > 0
🍟 MACD < 0
🍟 Signal > 0
🍟 Signal < 0
🍟 MACD > Histogram
🍟 MACD < Histogram
🍟 Signal > Histogram
🍟 Signal < Histogram
🍟 MACD (Crossover) Signal
🍟 MACD (Crossunder) Signal
🍟 MACD (Crossover) 0
🍟 MACD (Crossunder) 0
🍟 Signal (Crossover) 0
🍟 Signal (Crossunder) 0
🔮 MACD (Crossover) Signal Forecast
🔮 MACD (Crossunder) Signal Forecast
🤖 Automation
All BUY and SELL conditions can be automated using TradingView alerts. Every configurable condition can trigger alerts suitable for fully automated or semi-automated strategies.
⯁ Unique Features
Linear Regression: (Forecast)
Signal Validity: The signal will remain valid for X bars
Signal Sequence: Configurable as AND/OR
Table of Conditions: BUY/SELL
Conditions Label: BUY/SELL
Plot Labels in the graph above: BUY/SELL
Automate & Monitor Signals/Alerts: BUY/SELL
Background Colors: "bgcolor"
Background Colors: "fill"
Linear Regression (Forecast)
Signal Validity: The signal will remain valid for X bars
Signal Sequence: Configurable as AND/OR
Table of Conditions: BUY/SELL
Conditions Label: BUY/SELL
Plot Labels in the graph above: BUY/SELL
Automate & Monitor Signals/Alerts: BUY/SELL
Background Colors: "bgcolor"
Background Colors: "fill"

Best Metal to Sell → More BTCWhichever precious metal has outperformed Bitcoin the most over the last 21 days (by >4%) is showing short-term strength → sell a small slice of that metal and rotate into BTC.
Orange = trim some gold → buy BTC
Grey = trim some silver → buy BTC
Black = no clear edge → hold
This is a gradual, disciplined rebalancing tool for anyone holding physical gold & silver who wants to slowly increase their BTC exposure on relative strength spikes — without ever going “all-in”.
You decide the pace: 1% per signal, pause anytime, or stop when you’ve reached your personal comfort level of BTC allocation.
2020–2025 backtest (weekly 1% rotations):
$200k metals → 18.4 BTC + $0 metals left = $1.68 million
HODL metals only = $320k
HODL BTC from day one = ~$1.4 million
It’s not about beating BTC every cycle — it’s about turning stagnant metals into more sats, at your own pace.

Gold Thai CompassGold Thai Compass Indicator
Calculates Thai Gold Price (96.5%) by converting XAU/USD with the USD/THB exchange rate in real time
Displays the calculated gold_price_thb directly on the chart with a clean right-aligned label for easy price reading
Includes customizable reference lines — add, remove, rename, recolor, and adjust each line independently
Supports multiple editable lines (e.g., 4 levels) with price labels displayed beside each line
Provides user-friendly input settings (e.g., custom price sources, spread/adjustment options)
Updates dynamically with live market data — suitable for trading, analysis, and Thai gold price tracking
Designed for TradingView (Pine Script) and optimized for clarity and usability
Optional visibility controls to show/hide labels and reference lines for a cleaner chart layout

Anchor SafeSwing Gold StrategyOverview:
The Anchor SafeSwing Gold Strategy is designed for users who prefer structured, rule-based swing trading on XAUUSD. It focuses on identifying high-quality trade setups rather than frequent entries.
This strategy analyzes the market using multiple technical indicators and methods—including trend analysis, multi-chart confirmation, and support/resistance evaluation—to identify potential swing points. It also incorporates a dynamic approach to risk management through adaptive stop-loss and take-profit logic.
How the Strategy Works
1. Multi-Chart & Trend Analysis:
The strategy evaluates trend direction using several indicators and multiple charts. This helps determine whether the trend favors long or short setups.
2. Buy/Sell Conditions:
a. Buy Conditions: When the broader trend is identified as bullish, the strategy waits for the formation of a strong support zone before considering a long position.
b. Sell Conditions: When the trend is bearish, it waits for a confirmed resistance zone before initiating short positions.
3. Dynamic Take-Profit Logic
The strategy uses adaptive take-profit behavior based on evolving market conditions. It monitors new support/resistance structures and various overbought/oversold signals to dynamically exit trades.
4. Dynamic and Configurable Stop-Loss:
A flexible stop-loss system adjusts according to volatility and market structure.
Users can modify the stop-loss threshold in the settings based on their own risk tolerance and account size.
Trading Frequency :
This strategy focuses on select, high-quality setups. As a result, trade frequency is relatively low and may vary depending on market conditions. Backtesting may show roughly several trades per month, but actual live performance can differ.
Important Notes
All trading involves risk, and users should evaluate the strategy and adjust settings according to their own risk management preferences.

9/15 EMA Scalper 9/15 EMA Scalper — by uzairbaloch
This script is a price-action based scalping system built around the 9 EMA and 15 EMA trend structure.
It identifies short-term reversal points where the market pulls back into the EMAs and confirms direction with a strong candle signal.
The strategy looks for:
• A clear EMA trend (9 above 15 for buys, 9 below 15 for sells)
• Pullback into EMA9/EMA15 with candle bodies touching the fast EMA
• Strong confirmation candle (engulfing / strong momentum / controlled wick)
• Optional slope filter to avoid flat, choppy sessions
• Automatic trade labels showing Entry, SL and TP (based on R:R)
The script is designed for scalping on gold, indices, and high-volatility FX pairs.
It resets trade logic immediately after SL or TP is hit, so it can catch the next valid signal without delay.
This tool is meant as an indicator — not a full strategy — and can be used to visually mark high-probability EMA pullback setups with precise levels.
Author: uzairbaloch

Fear & Greed Oscillator - Risk SentimentThe Fear & Greed Oscillator – Risk Sentiment is a macro-driven sentiment indicator inspired by the popular Fear & Greed Index , but rebuilt from the ground up using real, market-based economic data and statistical normalization.
While the traditional Fear & Greed Index uses components like volatility, volume, and social media trends to estimate sentiment, this version is powered by the Copper/Gold ratio — a historically respected gauge of macroeconomic confidence and risk appetite.
📈 Expansion vs. Contraction Theory
At the heart of this oscillator is a simple macroeconomic insight:
🟢 Copper performs well during periods of economic expansion and risk-on behavior (industrials, construction, manufacturing growth).
🔴 Gold performs well during periods of economic contraction , as a classic risk-off, capital-preserving asset.
By tracking the ratio of Copper to Gold prices over time and converting it into a Z-score , this tool shows when macro sentiment is statistically stretched toward greed or fear — based on how unusually strong one side of the ratio is relative to its historical average.
⚙️ How It Works
The script takes two user-defined tickers (default: Copper and Gold) and calculates their ratio.
It then applies Z-score normalization over a user-defined period (default: 200 bars).
A color gradient line is plotted:
🔴 Z < -2 = Extreme Fear
🟣 -2 to 0 = Mild Fear to Neutral
🔵 0 to 2 = Neutral to Greed
🟢 Z > 2 = Extreme Greed
Visual guides at ±1, ±2, ±3 standard deviations give immediate context.
Includes alert conditions when the Z-score crosses above +2 (Greed) or below -2 (Fear).
🔔 Alerts
“Z-Score has entered the Greed Zone ” when Z > 2
“Z-Score has entered the Fear Zone ” when Z < -2
These are designed to help catch macro sentiment extremes before or during large shifts in market behavior.
⚠️ Disclaimer
This indicator is a macro sentiment tool, not a direct trading signal. While the Copper/Gold ratio often reflects economic risk trends, correlation with risk assets (like Bitcoin or equities) is not guaranteed and may vary by cycle. Always use this indicator in conjunction with other tools and contextual analysis.

[AutoZone_mrkim]- Use wisely
- The indicator will automatically draw the Order Block zone for each timeframe
- It will change color if a zone is broken out
- Each timeframe will have different zone levels depending on the timeframe used

Lot Size CalculatorLot Size Calculator for Gold (XAU)
This indicator helps traders calculate the proper lot size for Gold (XAU) based on their entry, stop loss, and risk amount in USD.
You can set your entry and stop levels directly on the chart, and adjust your dollar risk from the settings panel.
The indicator measures the distance between entry and stop to calculate the position size that matches your selected risk.
A clean, customizable table displays key values such as Risk, Entry, Stop, Target, Lots, and Pips.
You can easily hide specific rows, change colors, and adjust layout options to fit your chart style.
Designed specifically for Gold traders, this tool provides a simple and visual way to manage risk directly on the chart.

XenoSmooth Predictive Candles - Advanced Heikin Ashi CandlesXenoSmooth Predictive Candles
Summary in one paragraph
A synthetic candle engine for crypto, FX, equities, and futures on intraday to swing timeframes. It reduces noise and flip delay so structure is easier to read. The core novelty is a predictive open with inertia plus slope lead fused with a zero lag body filter and an overshoot based wick model normalized by the real range and capped by ATR. Add it to a clean chart, hide regular candles if desired, and tune lengths. Shapes can move while the bar is open and settle on close. For conservative workflows read on bar close.
Scope and intent
• Markets. Major FX pairs, index futures, large cap equities, liquid crypto
• Timeframes. One minute to daily
• Purpose. Faster and smoother visual structure than Heikin Ashi while keeping causality and realistic wicks
Originality and usefulness
• Unique concept. Predictive open with inertia and slope lead plus selectable zero lag body filter and ATR capped wick overshoot in percent of real range
• Failure mode addressed. Late flips in chop and unreal long wicks from raw extremes
• Testability. Every control is an input. Users can toggle body method, lengths, clipping, and percent modeling
• Portable yardstick. ATR based wick cap and percent of bar range scale across symbols
Method overview in plain language
Build a robust base price from O, H, L, and extra weight on Close. Smooth it with a chosen filter to produce the synthetic close. Drive a predictive open that follows the synthetic close with tunable inertia and a small lead from the last bar slope. Model wicks as the portion of the real extremes that extends beyond the synthetic body, smooth that overshoot, normalize by the bar range if selected, then cap by ATR to avoid tail spikes. Clamp synthetic values to the real high and low if enabled.
Base measures
• Range basis. True Range for the ATR cap and High minus Low for percent normalization
• Return basis. Not used
Components
• Body Base Blend. Weighted O H L with a close bias to stabilize the base
• Zero Lag Body Filter. ZLEMA or Super Smoother or WMA to set the synthetic close
• Predictive Open. Inertial follow of the synthetic close plus a slope lead term
• Wick Overshoot Model. Smoothed extension beyond the body, optional percent of real range, ATR cap
• Clamp Option. Keeps synthetic open and close inside the real bar range
Fusion rule
• Synthetic close equals filtered base
• Synthetic open equals previous open plus inertia times distance to synthetic close plus slope lead
• Wicks equal smoothed overshoot above and below the body, optionally percent of range then converted back to price and capped by ATR
Inputs with guidance
Setup
• Signal timeframe. Uses the chart timeframe
• Invert direction. Not applicable
• Session windows. Not applicable
Logic
• Body length. Core smoothing length for the synthetic close. Typical 6 to 14. Higher gives smoother and slower. Lower gives faster flips
• Body method. ZLEMA or Super Smoother or WMA. ZLEMA is fastest. Super Smoother is calmest
• Close weight in base. 0 to 1. Higher gives stronger emphasis on close and less noise
• Open inertia. 0 to 1. Higher makes the open follow the close more tightly
• Lead gain. 0 to 1. Higher adds more phase lead. Keep modest to avoid overshoot
• Clamp body to real range. On keeps synthetic body inside high and low
• Wick smooth length. Typical 4 to 10. Higher reduces jitter
• Overshoot as percent. On stabilizes wicks across regimes
• ATR length. Typical 10 to 20 for the cap
• Max wick equals ATR times. 0 disables. 1.0 to 2.0 contains extreme tails
Filters
• Efficiency or trend filter. Not used
• Micro versus macro range relation. Not used
• Location filter. Not used
Realism and responsible publication
• No performance claims
• Intrabar motion reminder. Shapes can move while a bar forms and settle on close
• Strategies must use standard candles for signals and orders
Honest limitations and failure modes
• High impact releases and thin liquidity can distort wicks and produce gaps that any smoother cannot predict
• Very quiet regimes can reduce contrast. Consider longer body length
• Session time on the chart controls the definition of each bar

Willy ORB for Gold – Session Presets (NY 5m)What it does:
Plots the opening-range high/low for the main Gold sessions (Shanghai, Tokyo, Sydney, Frankfurt, London, New York 5-minute OR by default). It projects TP1/TP2 expansion targets, supports a timezone offset so opens line up with your broker, and includes breakout alerts on confirmed closes.
⸻
Why it’s Gold-friendly
• New York (COMEX pit): 5-minute opening range at ~20:20 local (via your offset) to capture the most active burst.
• London / Frankfurt: strong European volatility windows for XAU/USD.
• Shanghai / Tokyo / Sydney: structure-setting sessions before momentum builds.
⸻
Features
• Session presets: SH, TK, SY, FR, LDN, NY (5m) — toggle individually
• 15m OR for all sessions except NY (5m) by default (editable per session)
• TP1 / TP2 expansion targets (user-defined multiples)
• Labels for 15m/5m range and targets; customizable styles
• Timezone offset control (aligns lines to your local clock)
• Daily auto-reset for clean levels
• Alerts: “Closed Above Range High” / “Closed Below Range Low” per session
⸻
How to use
1. Add to chart (best on 1–15m).
2. In settings → Gold Sessions, toggle the sessions you want.
3. Set “My time offset from chart (hours)” so session lines match your broker time.
4. Trade the breakouts: when price closes beyond the session high/low, TP levels plot automatically.
⸻
Parameters (quick guide)
• Targets: TP1/TP2 multiples (e.g., 1.0 and 2.0).
• Labels: left/right label placement, line styles/colors.
• Sessions: enable/disable + choose each session’s OR length (NY defaults to 5m).
⸻
Tips for XAU/USD
• London often gives the cleanest first breakout.
• New York tends to drive continuation after data releases.
• Consider pairing with volume/volatility or HTF trend for confluence.
⸻
Notes
• Built in Pine Script v6.
• Indicator (not a strategy). For backtests, use a companion strategy that trades the closes beyond the OR with SL at the opposite side and TP by R.
⸻
Disclaimer
For educational purposes only. Not financial advice. Always backtest and manage risk.

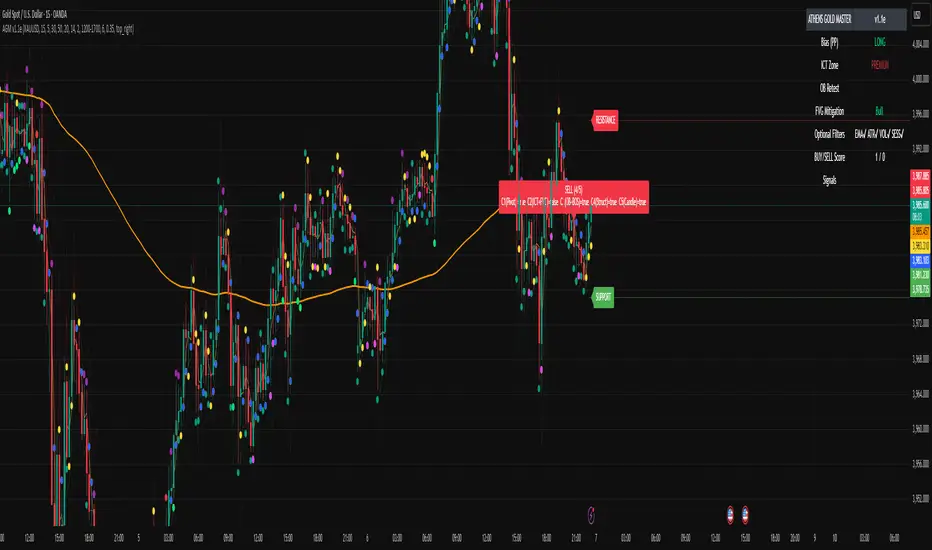
ATHENS GOLD MASTER v1.1e — by ATHENSATHENS GOLD MASTER v1.1e — by ATHENS
Professional Smart-Money-Based Gold Trading System
Built with institutional precision and ICT logic for XAUUSD traders.
⚙️ Core Strategy Components
✅ ICT Premium/Discount Model
✅ Daily Pivot Points & Price Bias
✅ Order Block & Break of Structure Detection
✅ Fair Value Gap (FVG) Mitigation Logic
✅ Dynamic Support & Resistance Recognition
✅ Candlestick + Chart Pattern Confirmation
✅ Multi-Timeframe Structure Alignment
💡 How It Works
The indicator scans real-time GOLD price action and generates Buy / Sell signals only when 3 or more confirmations align across smart money and technical confluence.
Each signal is visually marked on the chart with labels showing:
Confirmation count (1–5)
Key structure notes (Pivot, OB, FVG, etc.)
Support/Resistance zone tags
🧠 Optional Filters for Accuracy (90%+)
EMA-200 Trend Filter
ATR Volatility Filter
Volume Strength Filter
Session-Time Restriction (London–New York Overlap)
🟩 Buy Signal Example
Price above Pivot & in Discount Zone
Bullish Order Block Retest
FVG Mitigation Confirmed
Bullish Engulfing / Pin-Bar Confirmation
🟥 Sell Signal Example
Price below Pivot & in Premium Zone
Bearish Order Block Retest
FVG Mitigation Confirmed
Bearish Engulfing / Pin-Bar Confirmation
📊 Extra Features
Live Bias Table (Panel)
Selective Smart S/R Zones
Auto Session Filter
Alerts for Buy, Sell, and Strong Confluences
Best for: Gold Traders, ICT Students, Smart-Money Concepts Enthusiasts, and Professional Price-Action Analysts.
⚜️ Developed by ATHENS | Sahan Akalanka
📈 “Trade Smart. Think Institutional.”
15-Min Opening Range Indicator & Breakout Targets (ORB)- Willy
🔍 Overview
The **15-Min ORB (Opening Range Breakout)** indicator automatically identifies the **first 15-minute high and low range** after a market opens — and plots breakout targets based on user-defined expansion multiples.
It’s designed for traders who use **Opening Range Breakout (ORB)** strategies across multiple markets or sessions — and want **precise timing adjusted to their own timezone**.
---
⚙️ Features
🕐 **Time-Zone Offset (Local Adjustment)**
* Automatically shift your ORB window to match your **local timezone**.
* No more guessing when “09:30” happens in your region.
* Simply set the **offset (hours ahead or behind chart time)** and the indicator adjusts everything automatically.
⏱ **15-Minute Opening Range**
* Plots the high and low of your chosen 15-minute window.
* Works with any market or trading session (NYSE, London, Tokyo, Crypto, etc.).
* User can define **custom start hour and minute**.
🎯 **Breakout Targets (TP1, TP2)**
* Automatically calculates and draws **Take Profit levels** using customizable expansion multiples.
* Configurable TP1 / TP2 lines and labels with selectable styles (solid, dashed, dotted).
💬 **Visual Labels**
* Clear text labels showing:
* 15m High and Low levels.
* TP1 and TP2 targets.
* Label placement (left or right) adjustable for chart preference.
🧹 **Automatic Daily Reset**
* Resets all levels and targets at your midnight (or market day boundary).
* Ensures clean new ORB levels every day.
🔔 **Breakout Alerts**
* Built-in TradingView alerts for:
* **Closed Above 15m High**
* **Closed Below 15m Low**
---
🧭 How to Use
1. **Add to Chart**
* Click “Add to Favorite Scripts” and apply to your desired symbol.
* Works best on intraday timeframes (1m–15m).
2. **Set Your Market Session**
* Choose your **Range Start Hour and Minute** (e.g., 9:30 for NYSE).
* Set **My Time Offset from Chart (hours)** — for example:
* NYSE 9:30 New York → Bangkok (+12 hours)
* London 8:00 → Bangkok (+7 hours)
* The indicator adjusts automatically.
3. **Monitor the Range**
* The first 15-minute high and low are drawn as purple lines.
* When price breaks above or below, TP levels appear.
4. **Trade Your Plan**
* Alerts trigger when candles close outside the range.
* Manage targets using the expansion multipliers.
---
🧮 Example Settings
| Market | Local Open (Your Time) | Range Start (chart time) | Offset | Notes |
| :----------- | :--------------------------------- | :----------------------- | :----- | :----------------------- |
| NYSE (US) | 9:30 AM New York → 9:30 PM Bangkok | 9 | +12 | Typical for Thai traders |
| LSE (UK) | 8:00 AM London → 3:00 PM Bangkok | 8 | +7 | EU market overlap |
| Tokyo | 9:00 AM Tokyo → 7:00 AM Bangkok | 9 | +2 | Asian session |
| Crypto (UTC) | 0:00 UTC → 7:00 AM Bangkok | 0 | +7 | 24/7 markets |
---
📐 Parameters
### 15-Minute Range
* **Display 15-Minute Range** — toggles the range lines.
* **Show 15-Minute Labels** — toggles the range high/low labels.
* **Range Start Hour / Minute** — defines the start of your 15m window.
* **My Time Offset from Chart (hours)** — shifts the calculation to your local time.
* **Range Color / Style** — customize the look of your range lines.
### Targets
* **TP1 Expansion Multiple** — default `1.0` (equal to full range).
* **TP2 Expansion Multiple** — default `2.0`.
* **Show TP1 / TP2 Levels & Labels** — toggle individually.
* **TP Label Color** — customize breakout target visuals.
### Labels
* **Label Position (Left/Right)** — choose where labels appear on chart.
---
## 💡 Strategy Ideas
* Combine with volume or volatility filters for better confirmation.
* Use alongside VWAP, EMA, or session profiles for confluence.
* Apply on different markets:
* **Stocks (NYSE, NASDAQ)** — morning ORB strategy.
* **FX (London Open)** — volatility breakout.
* **Crypto (UTC 00:00)** — daily range breakout.
---
🧩 Technical Notes
* Built in **Pine Script v6**.
* Works on all intraday timeframes.
* Time calculations are local-adjusted using integer offset logic (avoids DST issues).
* No repainting — range values lock once 15m window completes.
---
🚀 Author Notes
Created for traders who want **simple, reliable ORB logic that respects your timezone**.
No unnecessary complexity — everything resets cleanly each day.
Tested and verified on:
* BTCUSD (Binance)
* ES1! (CME Futures)
* NAS100 / SPX500
* EURUSD / GBPJPY
* Thai SET50 index
---
🔔 Alerts
* “Closed Above 15m High”
* “Closed Below 15m Low”
You can configure custom alerts with your own messages.
---
## ⚠️ Disclaimer
This script is **for educational purposes only**.
It does not constitute financial advice or guarantee results.
Always backtest and trade responsibly.

Gold THB per Baht (XAU -> Thai baht gold)What it does
This indicator converts international gold prices (XAU) into Thai retail “baht gold” price (THB per 1 baht gold weight) in real time. It multiplies the XAU price (per troy ounce) by USD/THB and converts ounces to Thai baht-weight using the exact gram ratios.
Formula
THB per baht gold = XAU (USD/oz) × USDTHB × (15.244 / 31.1035) × (1 + Adjustment%) + FlatFeeTHB
1 troy ounce = 31.1035 g
1 Thai baht gold = 15.244 g
Conversion factor ≈ 0.490103

Empire OS Trading Fully Automated Prop Firm Ready💎 Prop-Firm-Ready Momentum System v3 — The Gold-Mine Algorithm 💎
Engineered for the same standards that top prop firms demand — minimal drawdown, consistent equity growth, and precision-based execution. This isn’t a basic indicator; it’s a refined momentum engine built for traders who scale capital and manage risk like professionals.
Performance Snapshot
• Profit Factor 2.26 • Win Rate 33 % • Max Drawdown 0.9 % • Total P/L + $447 • W/L Ratio 4.6 : 1
Stress-tested on Gold (XAUUSD) across live-market conditions, it stays composed under volatility and delivers structured, data-driven consistency.
⚡ See it. Test it. Scale it.
Built for prop-firm precision — from $10 K to $300 K and beyond.

EMA 9/50 News Confirmation Strategy v3 (Trend Aligned 3 bMin) “EMA 9/50 crossover strategy with trend filter and ATR-based targets”)
