HIFI BTC Daily Hashrate Momentum OscillatorThe "HIFI BTC Daily Hashrate Momentum Oscillator" indicator is an oscillator that analyzes the "health" and confidence of miners in the Bitcoin network. It measures the momentum of hashrate changes using its deviation from the 30-day and 60-day moving averages. A rising hashrate is often a leading or confirming bullish trend indicator for the price of BTC.
Main Idea
Hashrate is the total computing power involved in mining. Its growth indicates increased investment in network security and miners' confidence in future profitability.
Blue Oscillator (fast): Shows the short-term dynamics of hashrate growth.
Green Oscillator (slow): Indicates the long-term trend of hash rate changes.
Chart background: The green background signals the acceleration of the hash rate growth (short-term momentum is higher than long-term), which is a positive sign.
How to Read Signals
A Buy signal appears when two fundamental conditions coincide:
Growth acceleration: The short-term hashrate momentum becomes stronger than the long-term one (the blue line crosses the green one from bottom to top). This indicates that miners are actively building capacity.
Exit from stagnation: This acceleration occurs after a period of weak hashrate growth or decline (the green line is below the red dashed line).
This combination indicates the potential start of a new cycle of growth and confidence in the network, which historically has often preceded the rise in the price of Bitcoin itself.
Disclamer: This indicator is an analysis tool and should not be considered as a direct financial recommendation. Always do your own analysis before making trades.
Hashrate

BTC Price to Hashrate Delta Ratio with MAHistorically, Hashrate and Bitcoin prices have a strong correlation. When hashrate increases more than Bitcoin price, it indicates a rise in Bitcoin price soon.
This indicator uses the formula:
Price/hashrate delta ratio = period price delta / period hashrate delta
Whenever the ratio between the price and hashrate of Bitcoin is positive, it indicates that the price is increasing at a faster rate than the hashrate. This, in turn, means that Bitcoin is becoming more expensive compared to any variations occurring in the hashrate. Using the Price/Hashrate Delta ratio, we can determine whether Bitcoin is overvalued or undervalued in relation to the hashrate. This can be a helpful indicator for assessing the current market conditions.

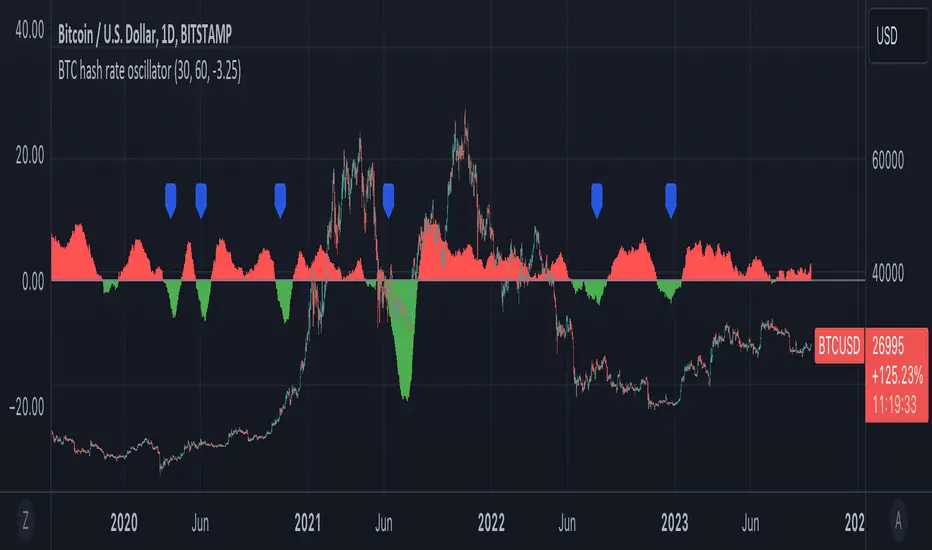
BTC hash rate oscillatorOVERVIEW:
This script looks to identify entry point opportunities when moving averages over Bitcoin's hash rate are indicative of Miner capitulation. The script implements an oscillator based on Charles Capriole's "Hash Ribbons & Bitcoin Bottoms" concept. It analyses the short-term and long-term moving averages of Bitcoin's hash rate and then identifies potential entry opportunities from this.
KEY FEATURES:
Signal Generation: The script identifies entry points when the short-term moving average crosses under the long-term moving average and the rate of change falls below a specified threshold. These conditions suggest potential trading opportunities.
Historical Signals: Optionally the script displays historical signals, indicating past instances where hash rate conditions suggested favourable entry points. Users can also assess the script's historical performance.
USAGE:
The generated opportunities can be used as potential entry points for BTC. The script provides visual cues on the chart (blue labels above the miner capitulation zones) for identification of signals. Customisable moving average lengths and threshold values are supported, which allow adaptation to various strategies.
CONSIDERATIONS:
Validation: It's recommended that careful backtesting over historical data be done before acting on any identified opportunities.
User Discretion: Trading decisions should not rely solely on this script. Users should exercise their judgment and consider market conditions.
Note: This script identifies opportunities based on historical data and should be used with caution, as past performance is not indicative of future results.
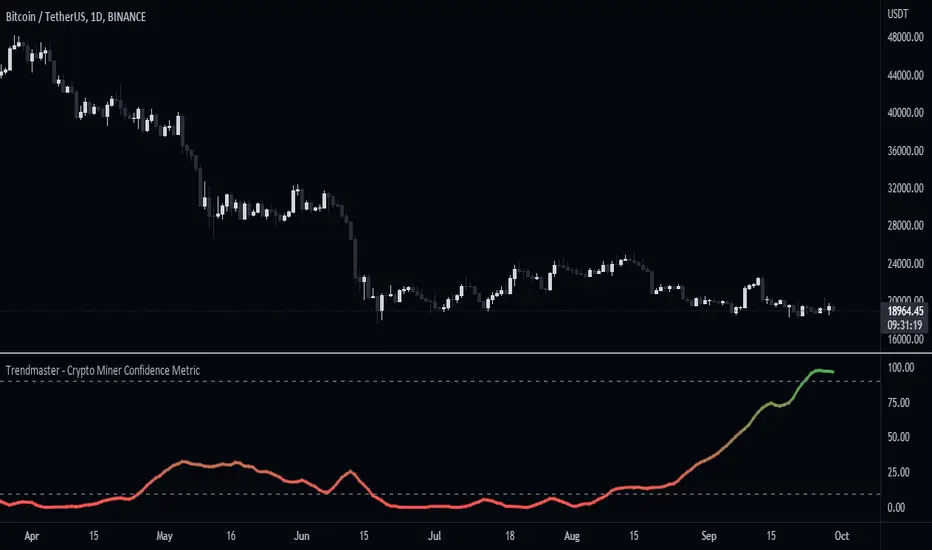
Trendmaster - Crypto Miner Confidence MetricWhat it is:
The Crypto Miner Confidence Metric analyses a handful of highly utilized Crypto networks to gain insight into the potential sentiment amongst those securing them and more specifically Crypto miners.
What it does:
It takes into account the overall trend in the increase or decrease of current computational power securing the networks, otherwise known as the hashrate - as well as the overall network inflows/outflows and holdings of those miners.
How to use it:
Using this data we can conclude whether their stance is currently Bullish or Bearish, with a value of 100 indicating an extremely positive future outlook from miners and a value of 0 representing a severe lack of confidence. Changes or pivots in the direction of miner confidence can indicate a shift in their Bullish or Bearish stance.
BTC Hashrate ribbonsBTC Hash Rate ribbons / Hash Rate cross
This strategy goes long when BTCs Hash Rate 30 day moving average crosses above the 60 day moving average, signifying that miner capitulation is over and recovery has started.
When the opposite signal is given, which signifies the beginning of miner capitulation, the strategy goes short (or flat, depending on configuration). This is generally considered the most popular Hash Rate related strategy.
The strategy is based on this medium article: medium.com
Thanks to the recent integration of IntoTheBlock data into Tradingview, we can now effortlessly show Hash Rate data on our chart,
keep in mind however, that IntoTheBlock doesn't provide Hash Rate data on timeframes below daily, so this strategy is based used on the daily, weekly or even monthly time frames.
Hash Rate definition:
The Bitcoin hash rate is the number of times per second that computers on the Bitcoin network are hashing data to verify transactions and perform the encryption that secures the network. The hash rate is an indicator of how healthy the Bitcoin network is at any given time, and is driven primarily by difficulty mining and the number of miners. Generally, a high hash rate is considered a good thing.
More precisely, the Bitcoin hash rate is the number of times per second that computers on the Bitcoin network are hashing data to verify transactions and perform the encryption that secures the network.

BTC Hashrate with smoothingBTC Hashrate with smoothing - thanks to the recent integration of IntoTheBlock data into Tradingview, we can now effortlessly show Hashrate data on our chart.
One popular use for Hashrate is to buy when the 30 day moving average crosses above the 60 day moving average, signifying that miner capitulation is over and recovery has started.
Definition
The Bitcoin hash rate is the number of times per second that computers on the Bitcoin network are hashing data to verify transactions and perform the encryption that secures the network. The hash rate is an indicator of how healthy the Bitcoin network is at any given time, and is driven primarily by difficulty mining and the number of miners. Generally, a high hash rate is considered a good thing.
More precisely, the Bitcoin hash rate is the number of times per second that computers on the Bitcoin network are hashing data to verify transactions and perform the encryption that secures the network.

HASHRATE and MINER REVENUEThis script uses daily data points from Quandl which measure Bitcoin mining hashrate, and miner revenue, and averages the two. The two data sets are fairly zigzaggy, so to smooth the data I am use a John Ehlers' filter to reduce the noise. Why did I combine the two? Both have correlation to BTC price action, and by combining hashrate and revenue, I believe it produces a stronger and more accurate signal. At times when the background is green (also displayed with a green square at the bottom), conditions are good in Bitcoinland with miner revenue/hashrate going up. No color in the background and no dot, means the combined miner revenue and hashrate indicator is dropping, but nothing to get worried about. Seeing red dots on the bottom along with a red background signals a rapidly dropping rate of hashrate/miner revenue, and with a fairly strong correlation to the Bitcoin price. Not every red zone foretells a drop in the Bitcoin price, but a significant number of them do. I wrote this script as an early warning system for when to move out of Bitcoin. Use at your own risk. Feel free to modify this code to suit your personal needs. Please only use on BTC /USD pairs with 1D bars. Since there is only one data point per day published by Quandl, it will not give accurate data for shorter timeframes. Enjoy.

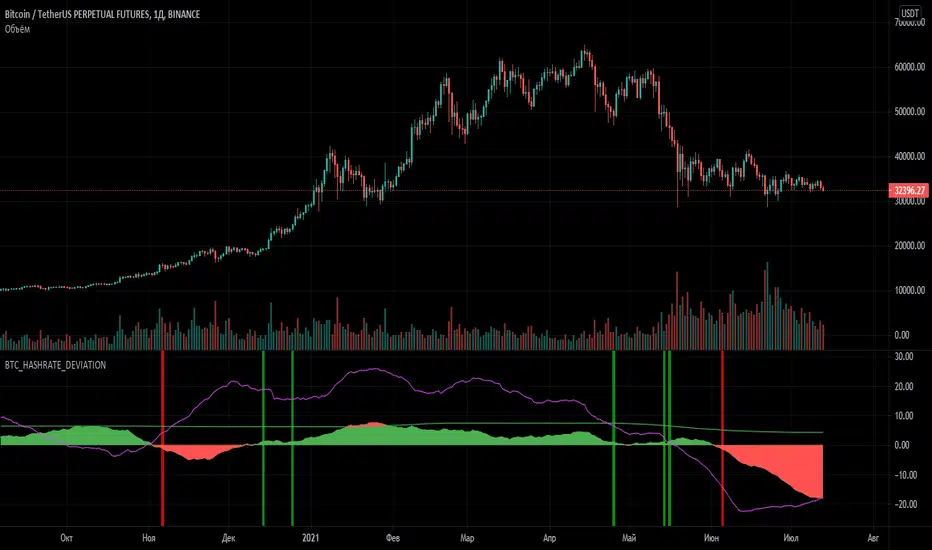
BTC_HASHRATE_DEVIATIONThe indicator shows the deviation of the hashrate in the Bitcoin network from its average value for the selected period. This indicator should be used on TF=1D.
When the hashrate drops below zero, you should look for points to buy Bitcoin , because after a decrease in the hashrate, the price of Bitcoin most often follows an increase.
Also in the indicator there is a line of deviation of the amount of remuneration of miners from its average value for the period that is set in the settings.
If we see a formed reversal in the part below the zero mark, we should buy bitcoin , since a low reward is not profitable for miners and its growth usually coincides with the rpost of the Bitcoin price.
Also on the chart there is a line of the average maximum by the value of the hashrate deviation and when the histogram intersects with this line, it indicates a likely "overheating" and you should closely monitor the price, since the hashrate is likely to fall, and with it the Bitcoin price.
If you have any questions, you can write to me in private messages or in Telegrams (the address is in my signature).
-----------------------------------------------
Индикатор отображает отклонение хэшрейта в сети Биткоин от его усредненного значения за выбранный период. Данный индикатор следует применять на ТФ=1день.
При снижении хэшрейта ниже нулевой отметки следует искать точки для покупки Биткоина, поскольку после снижения хэшрейта чаще всего следует рост цены Биткоина.
Также в индикаторе присутствует линия отклонения суммы вознаграждения майнеров от своего среднего значения за период, который задаётся в настройках.
Если мы видим сформировавшийся разворот в части ниже нулевой отметки, следует покупать биткоин, поскольку низкое вознаграждение не выгодно для майнеров и его рост обычно совпадает с ростом цены на Биткоин.
Также на графике есть линия среднего максимума по значению отклонения хешрейта и когда гистограмма пересекается с этой линией, это говорит о вероятном "перегреве" и следует внимательно следить за ценой, поскольку вероятно падение хэшрейта, а вместе с ним и цены Биткоина.
По всем вопросам Вы можете писать мне в личные сообщения, либо в Telegram (адрес в моей подписи).
Block Time AverageBitcoins network adjusts to maintain an average block time of 10 Minutes per block.
This chart uses the Hashrate and Difficulty to provide the average block time
< 10 Mins = Hashrate is increasing (Green)
> 10 Mins = Hashrate is decreasing (Red)

BTC Price to Hash scoreGrowing btc hashrate are associated with increasing btc price.
During speculative phase price growth is disproportionate to the hashrate.
On the opposite when the price fall to much in comparison to the hashrate, bitcoin could be undervalued.
This indicator identified 3 of 4 major tops and a lot of optimal buy opportunities.
Value under 0 signal overbought situations, value above 5.6 signal extremely oversold situations.
BIO

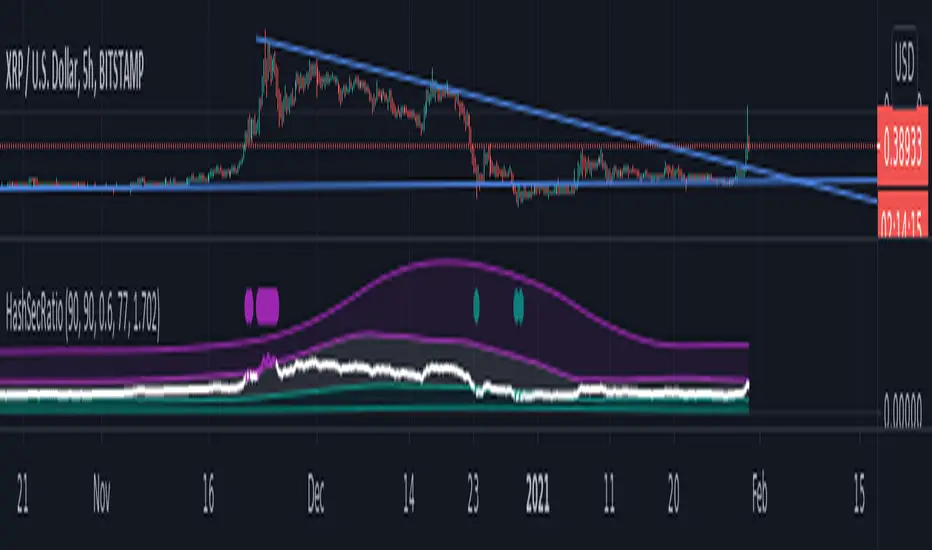
Hashrate to Securities RatioTMcV
HashSecRatio Original
January,30,2021
The Hashrate to securities ratio is a study to get a view on data flowing through the blockchain and can be applied to any asset available in Tradingview.
This indicator illustrates asset performance vs the moving average of BTC hash rate and accurately highlights price trend tops and bottoms allowing for excellent entry points in long and short trades highlighting overbought and oversold conditions in custom timeframes.
I will allow protected access for a short period of time to gather public opinion after that access will be limited to paid only.
For now if you would like to use this script please leave a comment and add to your favorite scripts.

[5F] Bitcoin Hash Rate + Miners revenue-═════════════════════════-
📋 Description :
This script display the Bitcoin' Hash Rate and the Miners revenue based on the data provided by Quandl.
Hashrate is displayed in TH/s : trillion hashes per second with an moving average.
Miners revenue is calculated by : (the number of bitcoins mined per day + transaction fees) * market price
The dates of previous halving are also displayed.
🛠 Note :
There is a multiplier on the miners revenue that you can configurate. It's only used to bring the 2 curves closer together for better visibility but the multiplier don't affect the revenue's data.
You can choose between different types of moving average for the hashrate's signal : SMA, EMA, DEMA, TEMA, WMA, VWMA or TMA.
You can show and hide each elements of the indicator
Thanks to all Pinecoders who share their work with the community.
-═════════════════════════-

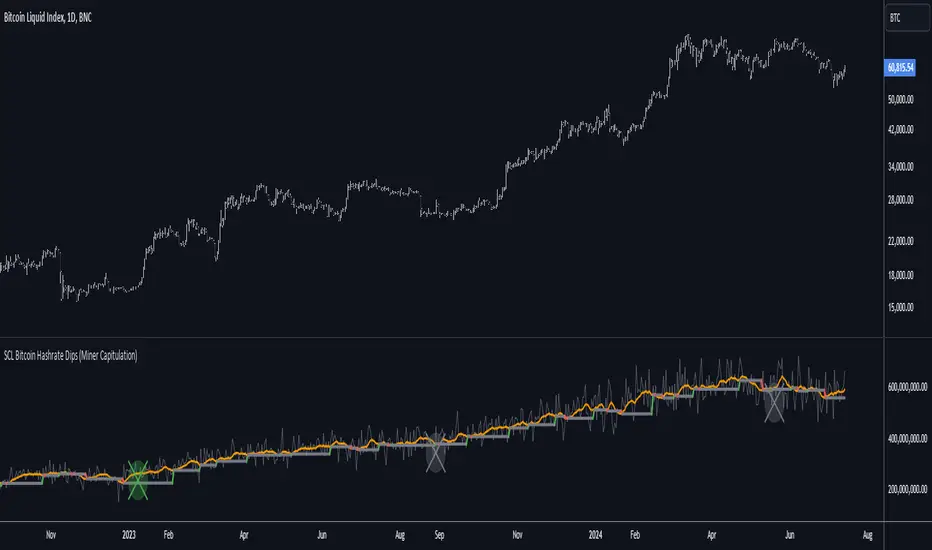
[SCL] Bitcoin Hashrate Dips (Miner Capitulation)Gives long-term buy signals for Bitcoin from dips and recoveries in the hashrate (the "miner capitulation" theory). It has an overlay and a standalone mode and is fully configurable. It uses Williams Lows and ATR instead of moving averages.
Features that might be interesting for Pinescripters:
+ Automatic (as far as is possible currently) adjustment of plots for overlay and standalone display modes.
+ A neat label function for debugging floats
+ Fully commented
+ The debug that I used to overcome problems in developing it is left in
+ Ideas for how to deal with a wildly oscillating and exponentially increasing data source
You need to run this indicator on the Bitcoin daily chart for it to make any sense. The best is a BTC/USD chart with a long history, such as BNC:BLX.
BITCOIN Miners Revenue VS Price Correlation OscillatorUse 3D(3-day candle) as timeframe for best reading.
------
original template for Correlation indicator was created by obaranova. credit goes to her.

Bitcoin Hash Rate (QUANDL:BCHAIN/HRATE)Simple script that graphically represents the bitcoin hashrate.
Blockchain data made available at QUANDL .
Its logic is simple, search the data in the QUANDL database and plot it in the graph.

Smooth Hash RibbonsSame as the popular hash ribbon indicator, but slightly more responsive and with a better smoothing kernel.

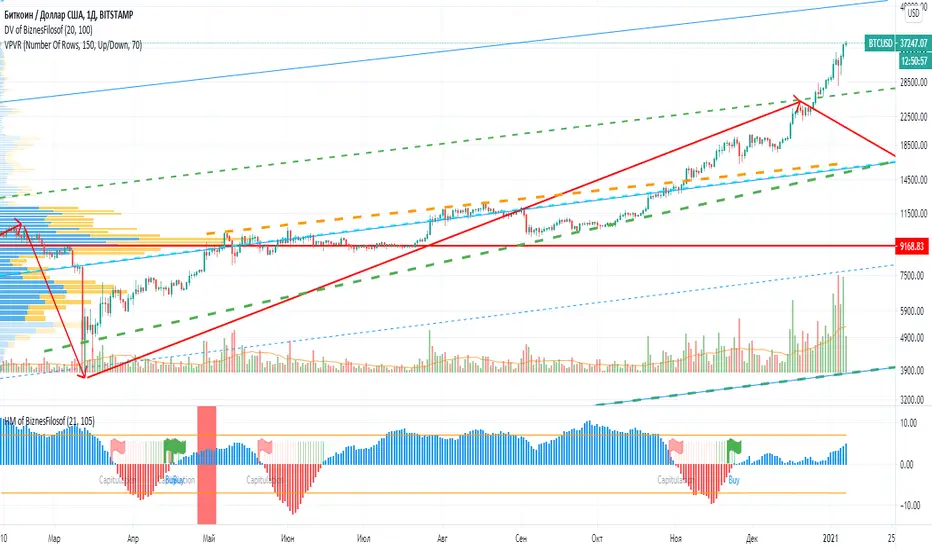
Hashrate Mining of BiznesFilosofIn addition to technical analysis, you also need to pay attention to fundamental analysis. Bitcoin has one of these indicators, it is the network hashrate. And it’s important to know when mining becomes disadvantageous. Those. when network participants turn off the equipment. And there are critical points that depend on the price and number of miners in the network.
When the blue bars of the indicator grow, then you can stand in long. When stools are reduced, then it is time to close positions or hedge risks in the derivatives market.
The vertical line indicates halving.
A red flag indicates a dangerous moment, and a green flag indicates the time of purchase.
The oscillator is based on fundamental indicators and the intersection of moving averages.
===
Кроме теханализа нужно ещё обращать внимание на фундаментальный анализ. У биткоина один из таких показателей, это хэшрейт сети. И важно зать, когда майнинг становится невыгоден. Т.е. когда участники сети отключают оборудование. И есть критические точки, зависящие от цены и количества майнеров в сети.
Когда синие столбики индикатора растут, тогда можно стоять в лонг. Когда столюики уменьшаются, тогда пора закрывать позиции или хеджировать риски на рынке деривативов.
Вертикальной линией обозначен халвинг.
Красный флаг показывает опасный момент, а зелёный флаг указывает на время покупок.
Осцилятор основан на фундаментальных показателях и пересечении скользящих средних.
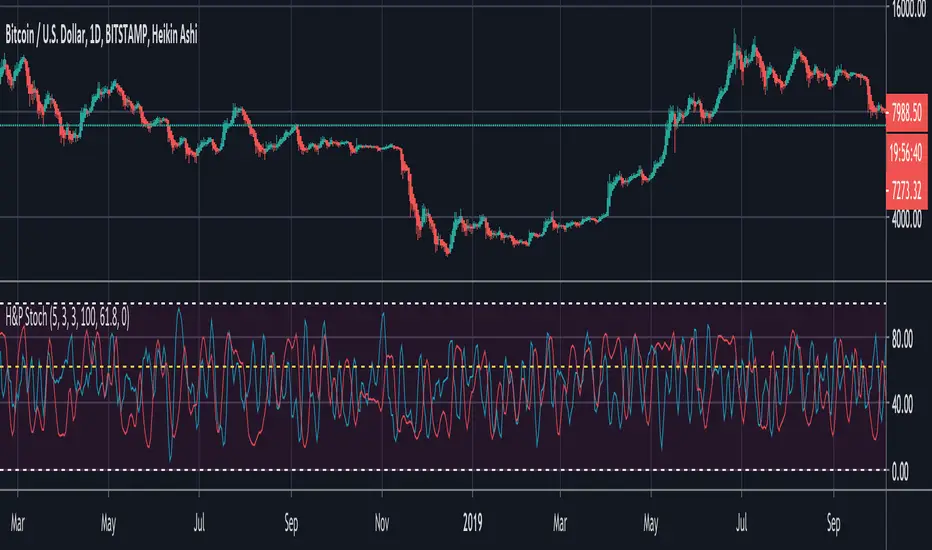
BTC Hash Rate & Price Stochastic IndiciatorFresh off the press, we have a new breed of indicators: Bitcoin's Hash Rate & Price.
As many of you have read, roughly 80% of BTC's price movements can be correlated to its changes in hash rate volume. I decided to make a stochastic indicator that utilizes this principle to track divergence of the price from the hash rate.
Let's break this down...
In red is the CLOSE of BTC's Price, which is then smoothed by a SMA, and smoothed again by a WMA.
In aqua is a STOCH of BTC's Hash Rate, which is then smoothed by a SMA, and smoothed again by a WMA.
The reason why I chose to use the CLOSE of the Price versus a STOCH as I did with the Hash Rate, is because the price tends to signal trends via divergence from the Hash Rate, and eventually converge with the Hash Rate at some point.
You will notice that anytime there is a significant divergence of the RED from the AQUA, a trend is closely aligned with it. This indicator does a remarkable job of indicating the beginnings and ends of both bullish and bearish price movements.
Example Strategy:
Enter long when RED (price) crosses over AQUA (hash rate), and close long when RED crosses under AQUA.
The inverse can be done for shorts, just RED diverges downwards from AQUA versus upwards.
Note:
Unlike a normal Stochastic Indicator, the upper and lower bounds do not appear to hold any significance. In other words, the lines do not seem to reverse at 20/80. As a result, I just set them to 0/100 for aesthetics.
DO NOT make trades based off of small divergences, or simply enter into positions based off the price divergences. Though this indicator times the start/end of movements very accurately, it also comes riddled with false breakouts .
Proceed at your own pace, and please, toy around with the inputs values. I experimented with a few combinations, but I'm sure there are better value combinations that yield sharper results with fewer false signals.
EASTER EGG:
Notice the "Golden Line"? Any avid user of TV knows that Fibonacci ratios show up everywhere in markets. With that said, I plotted a horizontal line at 0.618, which is 1/Phi, an important level in Fibonacci retracements.
Final Comments:
First, this is not investment, merely my experimentation and observation of happenings in the analytical world.
Second, please comment questions, improvements, etc. Dialogue opens up room for exploration!
Bitcoin Difficulty Ribbon - Best IndicatorHello everyone,
Today I programed the Bitcoin Difficulty Ribbon Indicator.
First of all, special thanks to:
Vinny Lingham
Willy woo
I just added a green background to clarify the buy signal.
Introducing the Difficulty Ribbon, signaling the best times to buy Bitcoin
Introducing the Bitcoin Difficulty Ribbon.
When the ribbon compresses, or flips negative, these are the best times to buy Bitcoin .
The ribbon consists of simple moving averages on mining difficulty so we can easily see the rate of change in difficulty.
How it the Difficulty Ribbon works
This visualisation of network mining difficulty speaks to the impact of mining on Bitcoin's price. As new coins are mined into existence, miners sell some of their mined coins to pay for production costs. This produces bearish price pressure.
The weakest miners sell more of their coins to remain operational. When it becomes unsustainable, they capitulate, hashing power and network difficulty reduces (ribbon compression), leaving only the strong, who sell less leaving more room for more bullish price action.
Typically we see this at the end of bear cycles, after miners capitulate, the lack of miner selling pressure allows the price to stabilise and then climb; the classic accumulation bottom.

Bitcoin Hash RateHello everyone,
An interesting indicator for Bitcoin : the hash rate.
What is the Hash Rate ?
The estimated number of tera hashes per second (trillions of hashes per second) the Bitcoin network is performing.


Hash RibbonsBuying during Miner Capitulation yields wonderful returns.
The best buy signals occur on Hash Rate "recovery", and when price momentum is also positive.
Historically, this strategy has yielded average returns to cycle peak of >5000%, with max Drawdown of -15%.
Follow me to learn more about this indicator.
