Pattern DetectorPattern Detector
Identifies and summarizes common chart patterns on any symbol/timeframe. Shows a compact table of the most recent confirmed patterns (up to 6), optional candle coloring that matches table row colors, and optional targets for context. Designed for analysis support only.
What it detects
Triangles and wedges, flags and pennants, head & shoulders (and inverse), rectangles, channels, broadening formations, double/triple tops & bottoms, cup & handle (and inverse), rounding tops/bottoms, diamonds, bump & run, island reversals, staircase patterns, V patterns, gaps (up/down), pipe/spike patterns, harmonic ABCD, Elliott (simplified), three drives, Quasimodo, dead cat bounce, tower top/bottom, shakeout, and Wolfe waves.
Inputs
Lookback Mode: Auto or Manual (Manual Lookback bars)
Min Confidence to Confirm: threshold for confirmation
Display: Show Pattern Table, Show Pattern Numbers, Color Pattern Candles
Style: table row colors; bullish/bearish direction colors
Notes:
Candle coloring uses the table’s row colors and requires Show Pattern Table to be enabled.
Targets are approximate and for reference only.
Alerts
Pattern Confirmed
Pattern Target Reached
Important
Educational/information tool only; not a signal generator and not financial advice.
No performance guarantees. Use with other analysis and risk management.
Calculations update in real time; confirmations happen on closed bars. Detected patterns can change intrabar; use closed‑bar alerts for greater reliability.
Results may vary by symbol, timeframe, liquidity, and volatility.
Headandshouldersformation

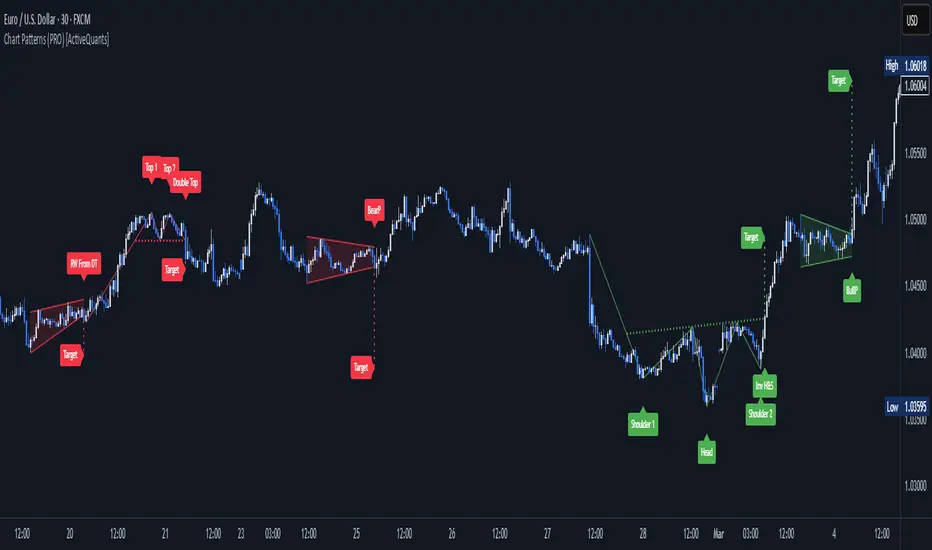
Chart Patterns (PRO) [ActiveQuants]Unlock the full potential of chart pattern trading with Chart Patterns (PRO) ! This advanced indicator goes beyond basic detection, offering a comprehensive suite of tools for serious traders. Automatically identify an extensive range of reversal and continuation patterns, complete with projected price targets , visually appealing pattern fills , and a sophisticated multi-status alert system .
How It Works
The indicator employs a sophisticated multi-stage process:
Precision Pivot Detection: At its heart, the indicator identifies significant swing highs and lows (pivot points) using an optimized internal period. These pivots are the fundamental building blocks for all pattern recognition. ( Users can toggle visibility of these pivots ).
Advanced Pattern Recognition Engine: Sequences of these pivot points are meticulously analyzed against a vast library of predefined geometric conditions to identify chart patterns. This includes checks for relative pivot heights/lows, slope analysis of trendlines, and ATR-based proportionality for patterns like Head & Shoulders.
Dynamic Status Tracking & Invalidation:
- Active: A pattern's initial structure is identified (e.g., two tops of a Double Top, or the converging trendlines of a Pennant). The pattern is developing.
- Confirmed: The pattern completes, and price breaks out/down from a key level (e.g., neckline, trendline) in the expected direction. Price targets are plotted upon confirmation.
- Invalidated: If price breaks out/down in the opposite direction of what's expected for an "Active" pattern, or if a new pivot forms that structurally compromises an "Active" Double Top/Bottom or Head & Shoulders before its confirmation, the pattern is marked "Invalid".
Price Target Projection: For confirmed patterns (excluding simple HH/LL structures), the indicator automatically calculates and plots potential price targets based on common technical analysis principles (e.g., pattern height projected from the breakout point).
█ DETECTED CHART PATTERNS
Chart Patterns (PRO) identifies a comprehensive list of 20 patterns, categorized for clarity:
I. Simple Market Structures:
Lower Low (LL): Indicates bearish pressure, potentially forming part of a larger downtrend.
Lower Low & Lower High (LL & LH): Stronger confirmation of a bearish trend.
Higher High (HH): Signals bullish strength, potentially part of an uptrend.
Higher High & Higher Low (HH & HL): Stronger confirmation of a bullish trend.
II. Reversal Patterns:
These patterns typically signal a potential end of the current trend and the beginning of a new one in the opposite direction.
Double Top (DT): Bearish reversal. Two distinct peaks at similar levels.
Double Bottom (DB): Bullish reversal. Two distinct troughs at similar levels.
Head and Shoulders (H&S): Bearish reversal. A central peak (head) flanked by two smaller peaks (shoulders).
Inverse Head and Shoulders (Inv H&S): Bullish reversal. A central trough (head) flanked by two smaller troughs (shoulders).
Rising Wedge From Uptrend (RW From UT): Bearish reversal. Converging trendlines with an upward slant during an uptrend.
Falling Wedge From Downtrend (FW From DT): Bullish reversal. Converging trendlines with a downward slant during a downtrend.
Bearish Ascending Triangle (Reversal): Bearish reversal. A horizontal resistance line with rising support, typically occurring after a downtrend.
Bullish Descending Triangle (Reversal): Bullish reversal. A horizontal support line with falling resistance, typically occurring after an uptrend.
III. Continuation Patterns:
These patterns typically suggest a temporary pause in the prevailing trend, after which the trend is likely to resume.
Rising Wedge From Downtrend (RW From DT): Bearish continuation. An upward-slanted consolidation during a downtrend.
Falling Wedge From Uptrend (FW From UT): Bullish continuation. A downward-slanted consolidation during an uptrend.
Bearish Pennant: Bearish continuation. A small symmetrical triangle (converging trendlines) after a sharp downward move.
Bullish Pennant: Bullish continuation. A small symmetrical triangle (converging trendlines) after a sharp upward move.
Bearish Flag: Bearish continuation. A short, rectangular consolidation (parallel trendlines, often upward sloping) after a sharp downward move.
Bullish Flag: Bullish continuation. A short, rectangular consolidation (parallel trendlines, often downward sloping) after a sharp upward move.
Bearish Descending Triangle: Bearish continuation. Horizontal support and a descending resistance line during a downtrend.
Bullish Ascending Triangle: Bullish continuation. Horizontal resistance and an ascending support line during an uptrend.
█ KEY FEATURES
- Automatic Price Target Projection:
Once a pattern is "Confirmed," a price target is automatically plotted on the chart.
Targets are calculated based on established technical methods, typically measuring the height of the pattern and projecting it from the breakout point.
Includes a label displaying the target price level. Toggle with Show Price Targets .
- Advanced Multi-Status Alerts:
Never miss an opportunity with highly configurable alerts.
Receive notifications when a pattern is:
- Developing (Active): Get an early heads-up.
- Confirmed: Act on breakout signals.
- Invalidated: Re-assess your strategy quickly.
Alerts automatically include the pattern type and its status (e.g., "Double Top - Confirmed ✅").
Additional contextual information included by default: Ticker Symbol, Chart Timeframe, Current Price, and Projected Target Price (for confirmed patterns).
Enable/disable all alerts via the Enable Alerts setting.
- Comprehensive Pattern Validation & Invalidation:
Patterns like Wedges, Triangles, Pennants, and Flags are monitored for breakouts. A breakout in the expected direction confirms the pattern; a breakout in the opposite direction invalidates it.
Double Tops/Bottoms and Head & Shoulders have pre-confirmation invalidation logic: if a new pivot forms that compromises the pattern's structure before the neckline breaks, the pattern is marked "Invalid". This helps filter out weaker setups.
ATR is used internally for proportional checks in patterns like Head & Shoulders, ensuring more reliable formations.
- Superior Visualizations:
Pattern Fills: Wedges, Triangles, Pennants, and Flags are visually enhanced with a semi-transparent fill between their trendlines, making them easy to spot.
Clear Necklines & Trendlines: Critical lines for patterns are drawn clearly.
Distinct Labels: Each pattern receives a main label (e.g., "H&S", "BullP"). Double Tops/Bottoms and H&S also get individual component labels (Top 1/2, Shoulder 1/Head/Shoulder 2).
Customizable Colors: Set distinct colors for bullish and bearish patterns.
- Pattern Display Control:
Toggle visibility for each of the 20 individual pattern types.
Filter displayed patterns by their status: All , Active , Confirmed , or Invalid .
Control historical depth with Show Last History (Bars) .
- Pivot Point Engine:
The indicator uses an optimized internal lookback period for robust pivot detection.
Optionally display these pivot high and low markers on your chart, with customizable colors.
█ USER INPUTS
Visibility and Common Styling
- Show Last History (Bars):
Number of recent bars the indicator will analyze and plot patterns on.
Default: 3000. Min: 10.
- Patterns (Visibility Filter):
Filters displayed patterns based on their status.
Options: All, Active, Confirmed, Invalid.
Default: All.
- Show Price Targets:
Toggles the display of calculated price targets for confirmed patterns.
Default: Enabled.
- Bearish Color:
Sets the color for bearish patterns and their components.
Default: Red.
- Bullish Color:
Sets the color for bullish patterns and their components.
Default: Green.
Pivot Points
- Show Pivot Highs:
Toggles the visibility of detected pivot high markers.
Default: Enabled.
- Show Pivot Lows:
Toggles the visibility of detected pivot low markers.
Default: Enabled.
- Pivot Highs Color:
Color for pivot high markers.
Default: #ff5252 (Reddish).
- Pivot Lows Color:
Color for pivot low markers.
Default: #089981 (Greenish).
Pattern Toggles (Grouped by Type)
- Simple Structures:
Lower Low (Default: Enabled)
Lower Low & Lower High (Default: Enabled)
Higher High (Default: Enabled)
Higher High & Higher Low (Default: Enabled)
- Reversal Patterns:
Double Tops (Default: Enabled)
Double Bottoms (Default: Enabled)
Head and Shoulders (Default: Enabled)
Inverse Head and Shoulders (Default: Enabled)
Rising Wedges From Uptrend (Default: Enabled)
Falling Wedges From Downtrend (Default: Enabled)
Bearish Ascending Triangles (Reversal context) (Default: Enabled)
Bullish Descending Triangles (Reversal context) (Default: Enabled)
- Continuation Patterns:
Rising Wedges From Downtrend (Default: Enabled)
Falling Wedges From Uptrend (Default: Enabled)
Bearish Pennants (Default: Enabled)
Bullish Pennants (Default: Enabled)
Bearish Flags (Default: Enabled)
Bullish Flags (Default: Enabled)
Bearish Descending Triangles (Continuation context) (Default: Enabled)
Bullish Ascending Triangles (Continuation context) (Default: Enabled)
Alerts
- Enable Alerts:
Master switch to enable or disable all alert notifications from this indicator.
Default: Enabled. ( Alert messages are pre-configured to include Pattern Type, Status, Symbol, Timeframe, Price, and Target Price when applicable and confirmed ).
█ UNDERSTANDING PATTERN INVALIDATION
Trendline Patterns (Wedges, Triangles, Pennants, Flags): An "Active" pattern is invalidated if price breaks its trendlines in the direction opposite to the expected breakout before a confirmation occurs. E.g., an Active Bullish Pennant is invalidated if price breaks below its lower trendline.
Neckline Patterns (Double Tops/Bottoms, H&S): An "Active" pattern can be invalidated before a neckline break if a new pivot point forms that violates the pattern's structural integrity.
Example (Double Top): If Top 1, Neckline (P5), and Top 2 form (Active status), but before price breaks below P5, a new swing low forms at or above P5, the Double Top is invalidated. This indicates a failure to break support and potential renewed strength.
█ ALERTS GUIDE
Add the " Chart Patterns (PRO) " indicator to your chart.
Ensure Enable Alerts is checked in the indicator settings.
In TradingView, click the "Alert" icon (clock) in the right toolbar or press ALT + A .
In the "Create Alert" dialog:
- Condition: Select " Chart Patterns (PRO) ".
- For the condition dropdown below it, choose " Any alert() function call ". This will trigger for any alert generated by the script.
- Interval: Choose whatever interval you want the alert to be triggered.
- Expiration: Choose the expiration date.
Customize your alert notification preferences (popup, email, webhook, etc.) and click " Create ".
You will now receive alerts for pattern status changes (Developing, Confirmed, Invalidated) with detailed information.
█ CONCLUSION
The Chart Patterns (PRO) indicator is an indispensable tool for traders aiming to optimize their workflow. By automatically identifying and drawing classical chart patterns, it eliminates the need for manual chart analysis, thereby enabling users to dedicate substantially less time to chart monitoring. Its comprehensive detection, coupled with actionable insights like price targets and a meticulous status tracking system with alerts, provides a significant analytical edge. Automate your pattern recognition and drawing, and concentrate on making informed trading decisions with enhanced efficiency.
█ IMPORTANT NOTES
⚠ Confirmation is Crucial: While "Active" patterns provide early warnings, always await "Confirmed" status (e.g., neckline/trendline breaks) and consider volume and broader market context.
⚠ Non-Repainting Logic: Pattern detection and status updates are based on confirmed price bars and pivot points. Once a pattern is fully formed and its status set (Active, Confirmed, Invalid), it will not repaint its historical state. Initial drawing of "Active" patterns extends to the current bar and updates dynamically.
⚠ Combine with Other Tools: No indicator is a standalone solution. Use Chart Patterns (PRO) in conjunction with other forms of analysis (e.g., fundamental analysis, other indicators, volume analysis) and robust risk management .
⚠ Historical Data: Ensure sufficient historical data on your chart for patterns to form and be detected accurately. The Show Last History (Bars) setting can manage this.
⚠ Lagging Nature: By their very definition, chart patterns are lagging indicators as they require a sequence of price action and several pivot points to complete their formation.
█ RISK DISCLAIMER
Trading involves substantial risk of loss and is not suitable for all investors. The Chart Patterns (PRO) indicator and its generated information are for educational and informational purposes only. It does not constitute financial advice or a recommendation to buy or sell any security. Chart patterns and projected targets indicate potential price movements based on historical tendencies but do not guarantee future results. Always conduct your own due diligence, consider multiple factors, and consult with a qualified financial advisor before making investment decisions. Past performance is not indicative of future results.
📈 Happy trading! 🚀
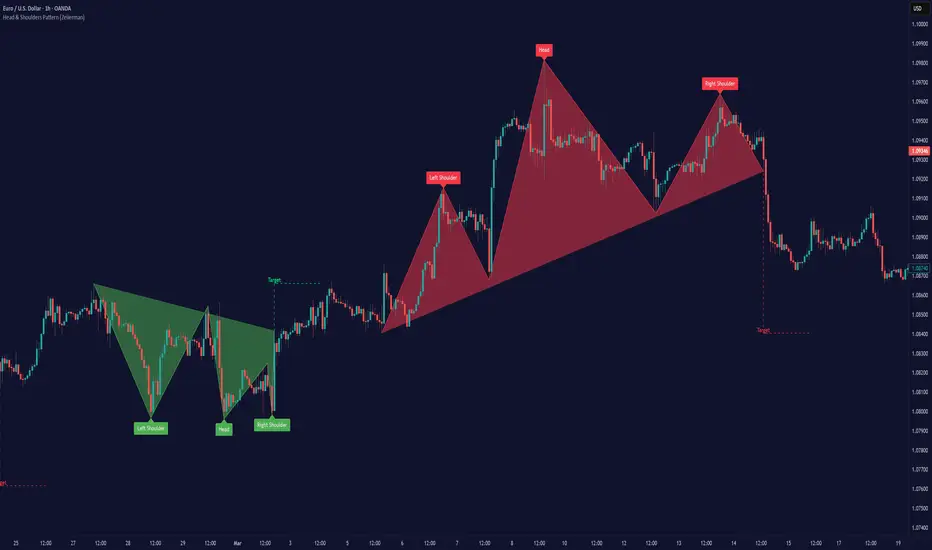
Head & Shoulders Pattern (Zeiierman)█ Overview
The Head & Shoulders Pattern (Zeiierman) is an advanced pattern recognition tool that automatically detects and visualizes one of the most powerful reversal patterns in technical analysis — the classic Head & Shoulders and Inverse Head & Shoulders formations .
This indicator brings structure clarity directly onto the price chart, allowing traders to instantly spot potential major reversal zones without manually drawing or searching for patterns.
It doesn't just draw lines — it intelligently scans price action for symmetry, pivot behavior, and neckline structures — then projects realistic price targets based on the pattern's height.
⚪ In simple terms:
▸ Standard Head & Shoulders → Bearish Reversal Pattern
▸ Inverse Head & Shoulders → Bullish Reversal Pattern
▸ Target Projection → Estimated Move from Neckline Break
▸ Labels → Clear annotation of Left Shoulder, Head, and Right Shoulder
█ How It Works
The indicator combines multiple technical detection layers into a clean visual model:
⚪ Dynamic Pivot Engine
Automatically detects pivot highs and lows based on user-defined Period.
Longer Period = Broader, higher-confidence patterns
Shorter Period = Smaller, more frequent patterns
⚪ Pattern Detection Logic
Scans pivot structures in real-time to identify valid:
Bearish Head & Shoulders (H&S)
Bullish Inverse Head & Shoulders (iH&S)
Conditions include:
▸ Symmetry validation
▸ Head above (or below) Shoulders
▸ Neckline structure
▸ Minimum price conditions met
█ How to Use
⚪ Reversal Trading
Look for Head & Shoulders at the top of an uptrend
Look for Inverse Head & Shoulders at the bottom of a downtrend
⚪ What makes our tool truly unique is that it goes beyond the traditional textbook definition.
Our custom Head & Shoulders algorithm is built with flexibility and adaptability in mind. It dynamically responds to real-time price action, allowing it to detect valid patterns not only at major trend reversals — but also within trending environments.
That means you can spot Head & Shoulders formations at:
Consolidation zones
Trend continuation areas
Corrective phases within established trends
It doesn’t have to be the absolute top or bottom of a move — and that’s the real power of this tool. It adapts. It evolves. It finds structure where most indicators stay blind.
█ Common Real-World Stop Loss Strategies with Head & Shoulders Patterns
Not all Head & Shoulders patterns are created equal — and neither are the stop loss strategies used to trade them.
Depending on your trading style, risk tolerance, and market context — here are the 3 most common ways traders manage stop placement when trading Head & Shoulders (H&S) or Inverse Head & Shoulders (iH&S) patterns:
⚪ Conservative Stop Placement
Maximum Safety — Minimum Chance of Being Stopped Prematurely
Stop Placement:
Above the Head (Bearish H&S)
Below the Head (Bullish iH&S)
Pros: Safest approach. Provides maximum protection against false breakouts and noise.
Cons: Often results in very large stop losses, especially on bigger patterns or higher timeframes. Risk-to-Reward (RR) can be poor unless the target is far.
⚪ Aggressive Stop Placement
Tighter Risk — Faster Invalidations
Stop Placement:
Above the Right Shoulder (Bearish H&S)
Below the Right Shoulder (Bullish iH&S)
Pros: Smaller stop losses. Improved RR. Ideal for traders who want tighter control over risk.
Cons: Higher chance of getting stopped on retests or minor volatility around the neckline zone.
⚪ Neckline Reclaim Invalidation
Dynamic & Price-Action Based Exit
Stop Placement:
Exit the trade if price closes back above (bearish) or below (bullish) the neckline after breaking it.
Pros: Dynamic approach based on market behavior rather than static levels. Allows more flexibility.
Cons: Requires active trade management. Not suitable for fully automated or set-and-forget trading styles.
█ Why It's Useful
This is not a basic pattern drawing tool — it's a complete detection system built for traders who want to:
Automatically detect powerful reversal patterns
Avoid the subjectivity of manually drawing H&S structures
Trade with clear target projections
Identify high-probability reversal zones
Visually map structure shifts in real-time
█ Settings
Pivot Detection
Period → Number of bars used to scan for pivots (Higher = Bigger patterns)
Pattern Detection
Enable Bullish Head & Shoulders
Enable Bearish Head & Shoulders
Visualization
Customize Colors (Lines, Fills, Labels)
Enable/Disable Labels
Pattern Style: Closed / Open
Custom Label Colors
Target Projection
Enable/Disable Target Projection
Customize Target Colors
-----------------
Disclaimer
The content provided in my scripts, indicators, ideas, algorithms, and systems is for educational and informational purposes only. It does not constitute financial advice, investment recommendations, or a solicitation to buy or sell any financial instruments. I will not accept liability for any loss or damage, including without limitation any loss of profit, which may arise directly or indirectly from the use of or reliance on such information.
All investments involve risk, and the past performance of a security, industry, sector, market, financial product, trading strategy, backtest, or individual's trading does not guarantee future results or returns. Investors are fully responsible for any investment decisions they make. Such decisions should be based solely on an evaluation of their financial circumstances, investment objectives, risk tolerance, and liquidity needs.
Consolidation & Head and Shoulders ScannerHello Traders!
The Consolidation & Head and Shoulders Scanner utilizes a unique swing-based pattern recognition to pinpoint consolidation and (inverse) head and shoulders patterns in real-time with unparalleled precision.
The rectangle pattern, also known as a trading range or a consolidation pattern, is characterized by horizontal lines that act as support and resistance levels, creating a rectangular shape.
The head and shoulders chart pattern is a technical analysis pattern used to identify potential trend reversals in financial markets. It consists of three swing highs (peaks), with the middle peak being the highest and the two outside swing highs being slightly lower. The middle peak is referred to as the "head" and the two outside peaks are referred to as the "shoulders."
The pattern typically forms after an uptrend and is in most cases a bearish signal. The neckline is a support level that connects the lows of the two shoulders. Once the price breaks below the neckline, the pattern is confirmed, and a new down trend starts. Conversely, an "inverse head and shoulders" pattern forms after a downtrend and is a bullish signal.
The Consolidation & Head and Shoulders Scanner is designed to operate in a fully automated manner, detecting consolidation patterns, head and shoulders patterns and inverse head and shoulders patterns across the symbol and timeframe that you select. It grants you the ability to simultaneously scan for patterns across as many as 20 distinct symbols.
Feature List
Real-time consolidation and (inverse) head and shoulders pattern detection
Breakout alerts
Customizable pattern size and accuracy
Customizable look and feel
The value of this indicator is to support traders to easily identify consolidations and (inverse) head and shoulders patterns in an automated way and across many different markets at the same time. The special swing-based pattern recognition makes this indicator unique. The trader saves a lot of time scanning the markets for consolidation and head and shoulders patterns, since finding the pattern and alerting for a breakout is done automatically for the trader.
For a visualization of the detected patterns, you can add the TRN Consolidation and Range Pattern and the TRN Head and Shoulders Pattern indicators to your chart.
How does Consolidation & Head and Shoulders Scanner work?
On the right side of the chart, you can find a table displaying the symbols monitored by our scanner for pattern and breakout detection (first column). The table provides information on the status of each symbol.
ACTIVE – Pattern building up
UP – Upside Breakout
DN – Downside Breakout
UP CONF – Upside Breakout confirmed
DN CONF – Downside Breakout confirmed
FAILED – Pattern failed to get confirmed
This visual representation allows you to quickly identify the evolving pattern dynamics across different symbols, helping you stay informed and make timely trading decisions.
In the second and fifth column, the status of consolidation patterns with two different consolidation sizes gets displayed. In the third and fourth column, the status of detected long and short head and shoulders patterns is displayed. The same goes for column seven and eight but with a different head and shoulders size which is customizable in the settings.
The scanner operates specifically on the timeframe you have selected in TradingView, ensuring that the detected patterns and breakouts align precisely with your trading perspective. F If the scanner displays a pattern or a breakout, you just can switch to this instrument and start trading it if you like what you see.
Follow these instructions to discover how you can utilize the scanner for seamless and simplified chart pattern detection like never before:
Add Symbols
Go to indicator settings and scroll down to the "Symbols" section. The enabled symbols can be recognized by the check marks. Click on one of them and use the search function to add the symbol of your choice to the scanner. You can search for up to 20 different Symbols at the same time.
Use Alerts (optional but recommended)
You can also use the built-in alerts to easily get notified when a pattern occurs. In the indicator settings in the "Alerts" section you can choose whether you want to get notified when a pattern is
in the making (Pattern active),
confirms an up breakout (B/O Up Confirmed)
confirms a down breakout (B/O Down Confirmed)
(Unconfirmed) in case a pattern breakout occurs, even if the pattern is not yet confirmed
This allows you to stay informed about potential breakout opportunities that are still awaiting confirmation.
Customization and Settings
The indicator can scan for smaller and larger patterns at the same time. Adjust the consolidation and head and shoulders sizes in the indicator settings to align them with your preferences. A larger size results in larger patterns. Depending on the asset class, the market or the market phase, different sizes can be used for pattern detection.
To detect more patterns, increase the tolerance level, even though it may result in lower accuracy. However, be mindful that a higher tolerance level may result in more patterns hitting their stop-loss.
Risk Disclaimer
The content, tools, scripts, articles, and educational resources offered by TRN Trading are intended solely for informational and educational purposes. Remember, past performance does not ensure future outcomes.

Head and Shoulders PatternHello Traders!
The Head and Shoulders Pattern indicator utilizes a unique swing-based pattern recognition to pinpoint head and shoulders patterns in real-time with unparalleled precision.
The head and shoulders chart pattern is a technical analysis pattern used to identify potential trend reversals in financial markets. It consists of three swing highs (peaks), with the middle peak being the highest and the two outside swing highs being slightly lower. The middle peak is referred to as the "head" and the two outside peaks are referred to as the "shoulders."
The pattern typically forms after an uptrend and is in most cases a bearish signal. The neckline is a support level that connects the lows of the two shoulders. Once the price breaks below the neckline, the pattern is confirmed, and a new down trend starts. Conversely, an "inverse head and shoulders" pattern forms after a downtrend and is a bullish signal.
Feature List
Real-time pattern detection
Visualization of entry, stop-loss and take-profit levels
Pattern performance statistics
Calculation of risk-rewards ratio
Risk Management
Breakout alerts
Customizable pattern size and accuracy
Customizable look and feel
The value of this indicator is to support traders to easily identify the Head and Shoulders pattern in an automated way. The special swing-based pattern recognition and the numerous built-in premium features make this indicator unique. The trader saves a lot of time scanning the markets for head and shoulders patterns, since everything is done automatically for the trader: Finding the pattern, looking and alerting for a breakout, computing the entry, stop loss and take profit levels as well as handling the risk management and computing the optimal order quantity.
How to Trade with the TRN Head and Shoulders Indicator
Identify the Pattern
Add the Head and Shoulders Pattern Indicator to your chart and look for the pattern on the asset and timeframe of your choice. The pattern is detected in real-time. If the pattern develops further in the next bars, then the indicator updates the pattern accordingly until a breakout is confirmed or the pattern becomes invalid.
You can also use the built-in alerts to easily get notified when a pattern occurs. In the indicator settings in the "Alerts" section you can choose whether you want to get notified when a pattern is
1. in the making (Pattern active),
2. confirms an up breakout (B/O Up Confirmed)
3. confirms a down breakout (B/O Down Confirmed)
4. (Unconfirmed) in case a pattern breakout occurs, even if the pattern is not yet confirmed
This allows you to stay informed about potential breakout opportunities that are still awaiting confirmation.
Check Pattern Statistics
The pattern statistics make it easy for you to see how successful a pattern is on the asset and timeframe you are watching. You should always check the statistics before entering a trade. The chart displays the statistics in the upper right corner. These statistics are categorized into two sections: "long" for inverse head and shoulders patterns and "short" for head and shoulders patterns.
In the initial columns, labeled as "short" and "long", the identified breakouts are further divided based on whether the risk-reward ratio (R) is below a specified value (< x) or equal to/greater than the specified value (>= x). The following columns represent the count of the events:
1. Occ. (Occurrence) categorized according to the values of R from the first column
2. TP1, TP2, TP3 (Take Profit) - targets 1, 2 and 3
3. SL (Stop Loss)
4. T/O (Time Out) - neither stop loss or targets where hit in a certain amount of time
Breakout – Entry, Stop Loss and Targets
The indicator automatically displays the entry price line (EP) in grey at the point where the price breaks through the neckline, indicating a breakout. Once a breakout has been confirmed, place a buy order near the EP level for a long position, or a sell order for a short position. Set your stop-loss at the price level of the red stop-loss line (SL) and set your take-profits at the price level of the green take-profit-lines (TP1, TP2, TP3).
Risk Management
The Head and Shoulders Pattern Indicator comes with a built-in risk management feature. Just go to the settings and scroll down to the section "Risk Management". Here you can enter your Account Size and the percentage you want to Risk when you enter a position after a pattern breakout.
In the "Trade Management" section, you have the option to define the minimum accepted risk-reward ratio for confirmed rectangles. This means that breakouts of patterns failing to meet the minimum risk-reward ratio will not be considered as confirmed signals. If a breakout gets confirmed, the indicator automatically calculates the position size (Quantity). You can read the quantity from the gray entry point line (EP), which is located to the right of the risk-reward ratio (R). Note that your risk-reward ratio (R) is calculated based on TP1.
Customization and Settings
The indicator can scan for smaller and larger patterns at the same time. Adjust the Head and Shoulders Sizes in the indicator settings to align them with your preferences. A larger size results in larger patterns. Depending on the asset class, the market or the market phase, different sizes should be used for the Head and Shoulders pattern detection.
To detect more patterns, increase the tolerance level, even though it may result in lower accuracy. However, be mindful that a higher tolerance level may result in more patterns hitting their stop-loss. Look for a tolerance level that leads to favorable statistics and focus on trading patterns with a proven performance history.
Finally, you have the flexibility to customize various visual elements, such as the color of the pattern and whether to display values like price, target, or risk-reward ratio on your chart. You can also choose where these values appear.
Computation Details
The real-time detection of the Head and Shoulders Pattern Indicator utilizes a unique swing-based pattern recognition. The difference to other swing-based computations is that the pivot points are identified without a look-ahead value. The result is a faster and better real-time detection. Furthermore, the detection of the ratios between the single swings is based on a dynamic volatility measurement similar to the ATR. The tolerance level unites several internal parameters into one and results in a user-friendly setting.
Risk Disclaimer
The content, tools, scripts, articles, and educational resources offered by TRN Trading are intended solely for informational and educational purposes. Remember, past performance does not ensure future outcomes.

Pro Trading Art - Head And ShouldersHow the Script Works:
1. The script identifies potential Head and Shoulders patterns by searching for specific pivot highs and pivot lows in the price data.
2. It checks for the presence of a left shoulder, head, and right shoulder based on the conditions defined in the script.
3. If a valid Head and Shoulders pattern is found, the script plots lines and labels on the chart to visualize the pattern.
4. The script also identifies Inverted Head and Shoulders patterns using similar logic but with different conditions.
5. It plots lines and labels for the Inverted Head and Shoulders pattern.
6. The script generates short and long conditions based on the patterns. Short conditions trigger when the close price crosses below the neck level of a Head and Shoulders pattern, while long conditions trigger when the close price crosses above the neck level of an Inverted Head and Shoulders pattern.
7. It plots sell and buy signal shapes on the chart when the short and long conditions are met, respectively.
8. The script can also trigger alerts to notify the user when a valid Head and Shoulders or Inverted Head and Shoulders pattern is detected.
9. The script provides visual cues on the chart to help users identify potential trading opportunities.
10. The logic and parameters of the script can be modified by the user to customize the behavior and adapt it to different trading strategies.
How Users Can Make Profit Using This Script:
1. Identify potential short-selling opportunities: When a valid Head and Shoulders pattern is detected and a short condition is met, it indicates a potential trend reversal. Traders can consider opening short positions to profit from a downward price movement.
2. Identify potential long-buying opportunities: When a valid Inverted Head and Shoulders pattern is detected and a long condition is met, it suggests a potential trend reversal. Traders can consider opening long positions to profit from an upward price movement.
3. Combine with additional analysis: Users can utilize this script as a tool in their overall trading strategy. They can combine the signals generated by the script with other technical indicators, fundamental analysis, or market sentiment to make more informed trading decisions.
4. Define appropriate entry and exit points: Traders can use the lines and labels plotted by the script to determine entry and exit points for their trades. For example, they may choose to enter a short position after the price crosses below the neck level and exit when the price reaches a predetermined target or when the pattern is invalidated.
5. Set risk management measures: It is important for users to implement proper risk management strategies when trading based on the script's signals. They should define stop-loss orders to limit potential losses if the trade goes against them and consider setting profit targets to secure profits when the trade moves in their favor.

Chart pattern - Head and ShouldersThis script identifies the Head and Shoulders chart pattern as well as the reversed Head and Shoulders chart pattern.
It has many settings. For example, you can choose by what points you want to identify patterns - along the edges of wicks (tails, shadows), or along the edges of candle bodies .
In addition, there are several settings with which you can determine the parameters of the detected patterns - the length and ratio of the lines included in it.
The "Sensitivity" parameter will allow you to control the frequency of detected patterns , depending on whether you want the patterns to be detected more often, or if they cover a larger number of candles and thus be more reliable.
You can also customize your styles.
All key settings are accompanied by tooltips.
Pivot Pattern Boundaries [cajole]
This script automatically detects horizontal support / resistance levels based on user-programmable criteria.
For example, you can detect boundaries with >3 touches within 200 days, allowing a tolerance of 1/4*ATR.
"Touches" are defined from pivots on the chart. The best way to search for larger/smaller patterns is to increase/decrease the pivot size.*
Future versions will allow "exceptions (i.e. keep drawing the horizontal line even if it is breached once or twice).
*TradingView's Pine script defines a Pivot as the highest point in a group. So, entering "2" means that a day's high needs to be above 2 days before and after (xxYxx) to be considered a high pivot.
This script can be an aid in drawing multiple patterns with horizontal boundaries (rectangles, triangles, head and shoulders, cup & handles, VCPs). I have intentionally avoided trying to code detection of the "other side" of these patterns, as that is where the craft of charting becomes an art.
