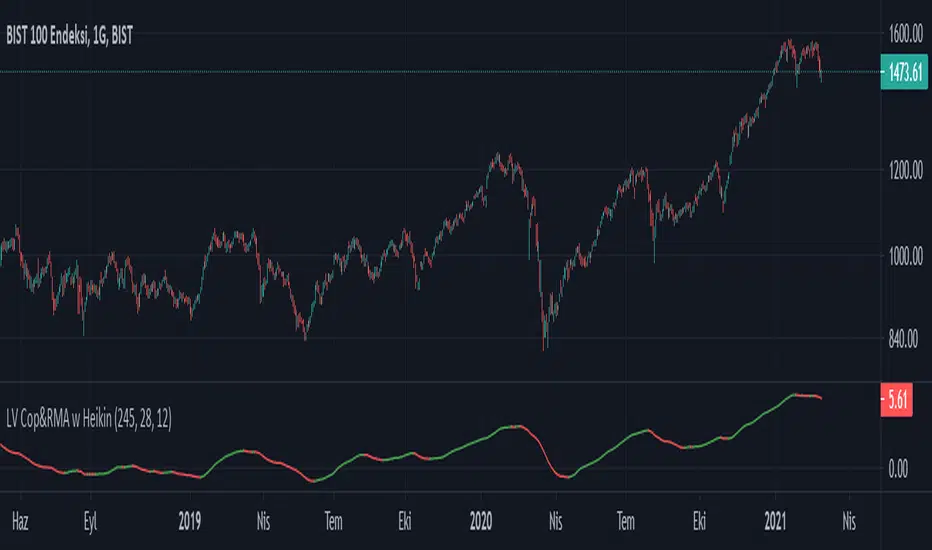
LV Cop&RMA w HeikinA buy signal is generated when the indicator turns upwards from previous indicator level.
A sell signal is generated when the indicator turns downwards from previous indicator level.
The indicator is trend-following, and based on averages, so by its nature it doesn't pick a bottom, but rather shows when a rally has started.
It is designed for daily period use.
Frequent buy/sell signals can occur on low and high levels.
It is designed with the mentality of Coppock curve. Rma is used instead of Wma and Heikin-Ashi closing price is used instead of standard closing price.
Heikin-ashi
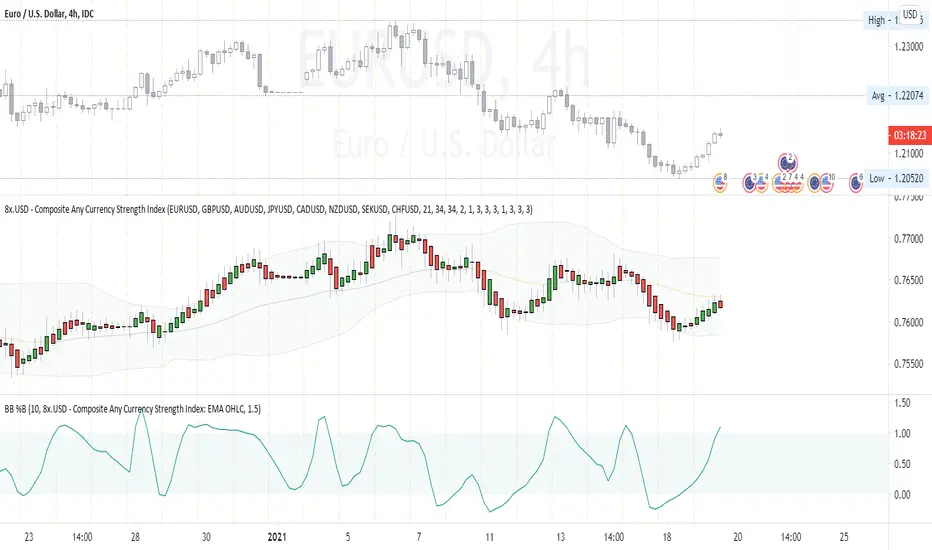
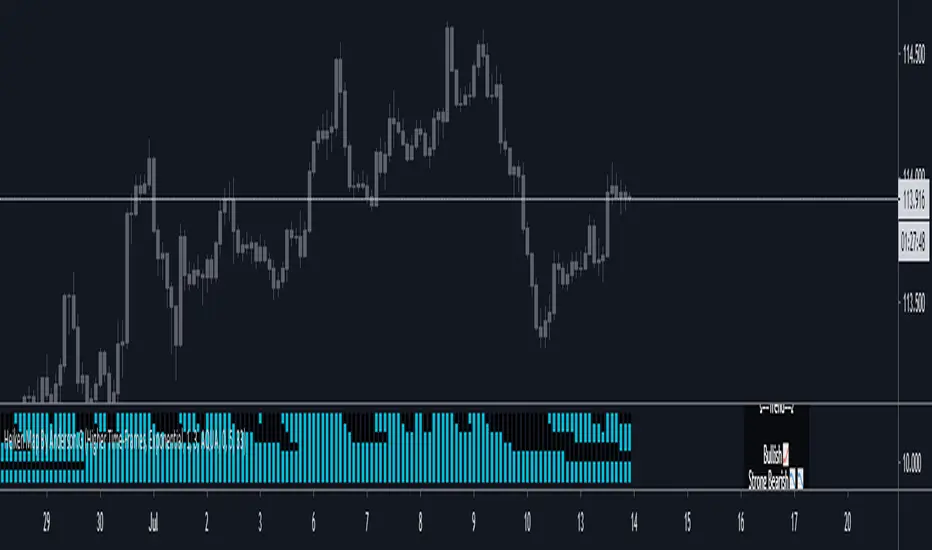
Composite Any Currency Strength IndexThis is a flexible currency strength indicator and you can adjust it to any currency you wish 'to measure'. By default, it is set to measure USD major pairs. Indicator calculates every pair you list, and plots one composite chart in the form of Heikin Ashi candles. Basically, you will get USD index in this case. Similarly, you can get AUD, EUR, CAD, JPY, CHF, etc indexes by specifying corresponding symbols. Remember about base and quote currencies and location of each for correct calculations. Simple adjustments in the script needed if you want to value USD by using USD in both base and quote (counter) currencies.
For example, when calculating USD strength by looking into USDJPY (not into JPYUSD) symbols, you will need to add minus "-" before corresponding security in the script itself, not in the Settings Inputs.
Default study script (with JPYUSD):
// Inputs
...
string sec3 = input(defval="JPYUSD", type=input.symbol, title="Symbol")
...
h_sec3 = security(heikinashi(sec3), timeframe.period, high)
l_sec3 = security(heikinashi(sec3), timeframe.period, low)
o_sec3 = security(heikinashi(sec3), timeframe.period, open)
c_sec3 = security(heikinashi(sec3), timeframe.period, close)
Adjusted study script with USDJPY:
// Inputs
...
string sec3 = input(defval="USDJPY", type=input.symbol, title="Symbol")
...
h_sec3 = -security(heikinashi(sec3), timeframe.period, high)
l_sec3 = -security(heikinashi(sec3), timeframe.period, low)
o_sec3 = -security(heikinashi(sec3), timeframe.period, open)
c_sec3 = -security(heikinashi(sec3), timeframe.period, close)
Unfortunately, I am not a coder specialist and perhaps someone here could improve this indicator for easier and more friendly adjustments. But thanks to variety of symbols on TradingView , you can ignore any changes in the script, and just use symbols with corresponding counter currency offered by this great platform.
Bollinger Bands, 2 x RMA, 4 x SMA/EMA were added for deeper analysing of the index. Other indicators with ability to select data sources (like CCI, StochRSI, Momentum etc) can be separately added to a current chart, but use Composite Any Currency Strength Index data as the source for analysing displayed pair, i.e. by selecting source - Composite Any Currency Strength Index: SMA Close or EMA HLC.
Thank you and good luck everyone!
Modified Smoothed Heiken AshiThis code is based on Smoothed HA candle which will work on all chart types
condition for BUY:
1. When close crosses Smoothed HA
2.Close should be in side upper band
3.BBW must be greater than the average
vice versa for sell
this code takes data from HA chart so that it can be applied on all chart type.
Bollinger band and Bollinger band width conditions added for removal of unwanted signals
Alert added so that you can apply alert and check it in real time performance
thanks to The Secret Mindset You tube channel from where I got the idea to convert this into a pine script indicator
smooth HA taken from "Smoothed Heiken Ashi Candles v1" at //@jackvmk

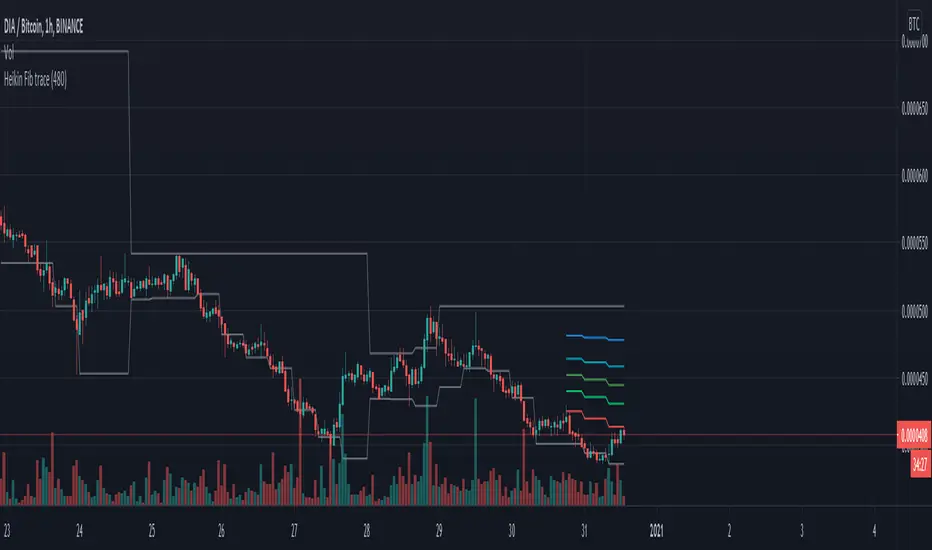
HeikinAshi Fibonacci Retracement v2It draws Fib retracements based on the highest high measured when HeikinAshi candles are green, and lows based on when HeikinAshi candles are red.
The idea is that you can see the fib retracements based on HeikinAshi trends on a larger timeframe to help trade in smaller timeframes.
for v2 I reset the fib trace when a new high is set and also at the second green heikin candle. And I only show the last 20 bars of fib lines to avoid confusion and focus on the current trade.
Happy trading!
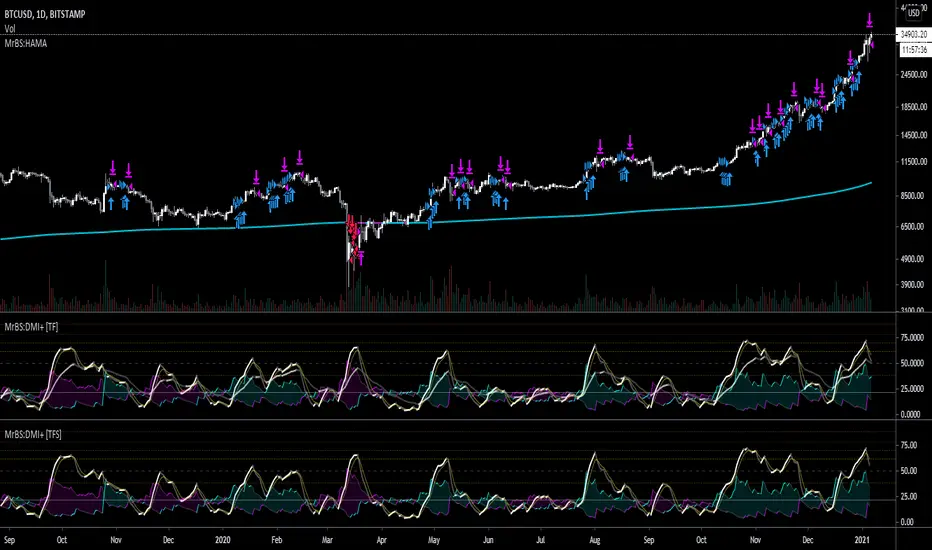
MrBS:EMA/SMA/HMA (Heikin Ashi Calc)This indicator allows you to base the MA calculation from Heikin Ashi values on normal charts and/or the real OHLC values while looking at Heikin Ashi.
There are 3 MA types you can select - EMA / SMA / HMA
The colour is based on the slope.
I made this to help me visualize my DMI+ strategy, when I was looking at taking signals from Heikin Ashi but looking at candlesticks. Turns out, I was going down the wrong road. Now I'm looking into using the real OHLC values for generating signals but watching the Heikin Ashi chart as I find it easier to see trends on it.
Hopefully its useful to some people, and if you have any suggestions for improvements I'd love to know.
HEINKI ASHI SUPERTRENDHi friends....publishing Heikin ashi supertrend strategy... which shows the movement of price over time and how strong those movements are/will be, regardless of the direction the price moves, up, or down. Indicator specifically useful, as it helps traders and analysts spot points where the market can and will reverse by providing signals long (buy) and short (sell). Show the relative strength of price movements but leave out the directionality of the price movements, best utilized in combination with other technical indicators – such as trend lines and moving averages – which show price trends and directions. Having an alert feature to make aware market players from signals provided by strategy.
HA charts are a great way to help those who can be spooked by the chaos of the markets (I'm one!), but they have a big drawback in that the price you see on a HA candle is often significantly different from the real price that you would trade on. This brings issues of unrealistic expectations of profits/losses, and also makes back testing a strategy very difficult. I still wouldn't recommend ever using TradingView's "strategy" tool when using HA charts, but using this indicator you can do accurate back tests.
***************This uses Heikin Ashi Candles as source on normal chart..dont use it on heikin ashi chart*****************************
There is an option for use normal japanes candle supertrend..so we can compare how this heikin ashi prevent false trades.
some tips for new traders to become successful trader
1: always follow risk management...
2: every stock/ forex / crypto has it own cycle.. So pls dont jump from one stock / forex pair to another when u hear some stock / crypto has
made new high or low... Bcs after that consolidation period starts.. During consolidation we can not make more profit as in trending market.. So be patient when u had made some position or tarde in one stock/ pair...
3 : we dont require to trade in every stocks / forex/crypto.. Just one stock and pair trading daily make u profitable beyond ur expection.. Bcs
trading in one stock / forex pair.. make u very comfortable and u may always know its movement... And u also trade in every cycle of this
stock/ pair.. So u also trdae its trend days which made highest profit. We dont know when is trend of any stock... Compare with it
business... Trading is business not one day rich game... Its business... It takes time and u have to do same thing agian and again to become
sucessfull trader for this u can use tradingview alerts. .for that u dont need to seat infrot of ur terminal screen.. u can also do algo trading
by using tradingview alerts
4 : By following risk management and incerase lot size as profit increased... This is the key 🔑 of sucess in stocks / forex / crypto market.
I thinks this tips may help new trader. U can modified according to ur trading style..
You can personal message me if u want to use this strategy
******************if u want to use this indicator u can personal message me********************************************************

Heiken Ashi MTF Strategy- IndicatorHello, this is both a strategy and indicator that revolves around Heikin Ashi candles.
In this case we take 3 different time frames, in this example we use daily , weekly and monthly.
The conditions for entry are :
For long : we check that we have a green daily candle, at the same time we check that the weekly and monthly candles are also green.
For short : We check that all candles, daily, weekly and monthly and red.
For exit of long : as soon as 1 of the 3 candles, daily or weekly or monthly converts to red, we exit.
For exit of short : as soon as 1 of the 3 candles converts to green, we exit.
This strategy- indicator can be adapted to any type of market.

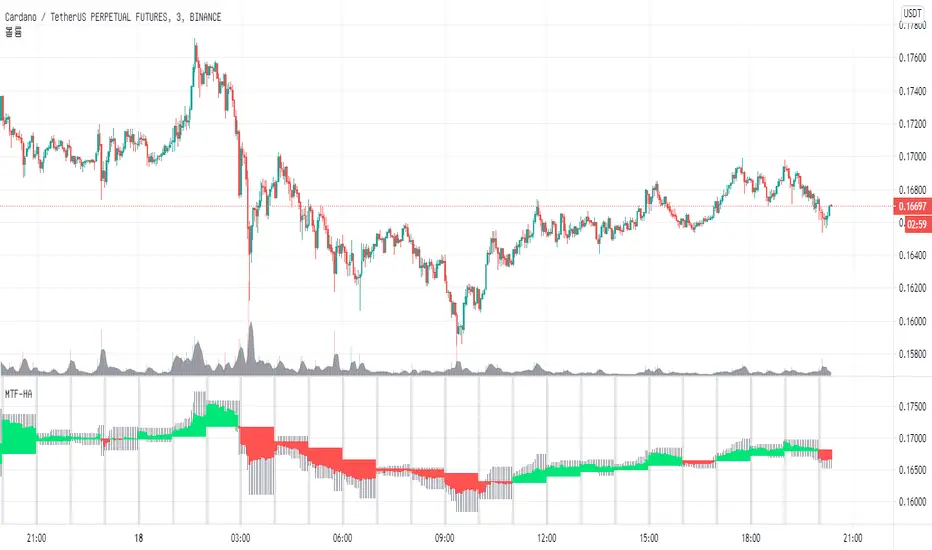
MTF_HA & CANDLE [by coral1213]Hi traders.
This is a multi-timeframe Heikin-Ashi candle chart script.
There is no repaint.
This is used when you want to see a high time frame Heikin-Ashi candle on the candlestick chart.
1. HTF RESOLUTION = Frame of output candle... 1H=60, 4H=240, 1D=1D, 1W=1W...
2. HTF SOURCE TYPE = Selects the target chart mode for the output candle... Candlestick of HighTimeFrame or Heikin-ashi of HighTimeFrame
3. HTF RESOLUTION HIGHLIGHT = Marks the beginning of the selected resolution.
For better visibility, it is recommended to turn off the optional border color.
Enjoy Trade
CRYPTO HA Strategy money maker long termToday I bring you another amazing strategy.
Its made of 2 EMA in this case 50 and 100.
At the same time, internaly for candles we calculate the candles using the HA system ( while still using in live the normal candles). This way we can assure that even if we use HA candles, we avoid repainting, and its legit.
We first calculate the HA candles based on the EMA 50 values, and after that , we use that candle properties to apply to EMA 100.
Once we have that, for entries we have the next conditions :
sell = o2 > c2 and o2 < c2 and time_cond
buy = o2 < c2 and o2 > c2 and time_cond
For sell : Our open from HA 100 is bigger than Close from ha 100, and the previous open is smaller than previous close
For long : Our open from ha 100 is smaller than close from ha 100 and the previous open is bigger than previous close.
Then we have 2 options :
If we wnat to go only long , which is my prefered version ,or the original one where we go both long and short.
I found that the best results are in general around bigger timeframes, 1h+ , 3h works the best so far on my tests.
For exit we have 2 versions :
1 lets say we had a long signal, as soon as we have a short signal we close the trade. Viceversa for short.
2. Is based on price % movement. In this case I use 7.5% price movement of asset.
We have no TP in use for this system.
For the purpose of this test I use 10.000 $ account. For test I use 100% of it, without any leverage.
I use the SL based on price movement , which is a very risky tool, since it can fluctuate even at 20-30% of our capital.
For comission I used 0.1% for each deal, and a slippage of 5 points.
Be cautious with this system !
If you have any questions , message me.

MACD Trend CandlesThe script combines 2 indicators (MACD and Stoch-RSI) and puts them visually directly on the candles - can be used with normal OHLC candles or Heiken Ashi candles. Furthermore, you can derive divergences exremely easy directly visually from the candles as well. Lastly, a SMA 20 high and a SMA 20 low line build a trend channel.
Script is best used in trending markets to trade with the trend.
1) SMA trend channel:
* uptrend: close above
* downtrend: close below
* aggressive entry (uptrend) closing inside channel from below
* conservative entry (uptrend) closing above channel from inside
* hold (uptrend) until close below channel
* can be used accordingly for the downtrend
2) MACD candles
* visualization of the MACD histogram directly on the candles
* dark blue: histogram > 0 and histogram > histogram of previous candle
* light blue: histogram > 0 and histogram < histogram of previous candle
* orange: histogram < 0 and histogram < histogram of previous candle
* light blue: histogram < 0 and histogram > histogram of previous candle
* hold uptrend (dark/light blue candles) - combined with trend channel (above channel)
* hold downtrend (orange /yellow candles) - combined with trend channel (below channel)
* Color divergence: light blue candle > dark blue candle (price and MACD show divergence (bearish)
* Color divergence: yellow candle < orange candle (price and MACD show divergence (bullish)
* Trend change (0 line cross to upside) yellow or orange to dark blue
* Trend change (0 line cross to downside) dark or light blue to orange
3) Stoch RSI diamonds
* visualization of the STOCH-RSI as diamonds above or below the candle
* k, d line > 80: diamond above the candle
* k, d line < 20: diamond below the candle
* divergence caldle without diamond above > candle with diamond above (bearish divergence)
* divergence caldle without diamond below < candle with diamond below (bullish divergence)
Feel free to test each part individually and combine it with other indicators, e.g. BBands and Ichimoku Cloud - you will see it is a powerful visualization script
HAVE FUN

Trendy Bar Trend Color LiteLite version of the original Trendy Bar Trend Color
This will only color the candlestick body of your chart
Can be used with solid, hollow, renko, or any other chart type
Custom coloring for Highs, Lows, and consolidation is removed

Impulse Guage Indicator for HA CandlesThis script uses Heikin Ashi candles to smooth out the candles, then counts how many consecutive candles in a row are the same colour (red or green). It then takes each count and multiples it by the difference between close and open, to provide a weighted movement.
Where larger moves create greater impulses.

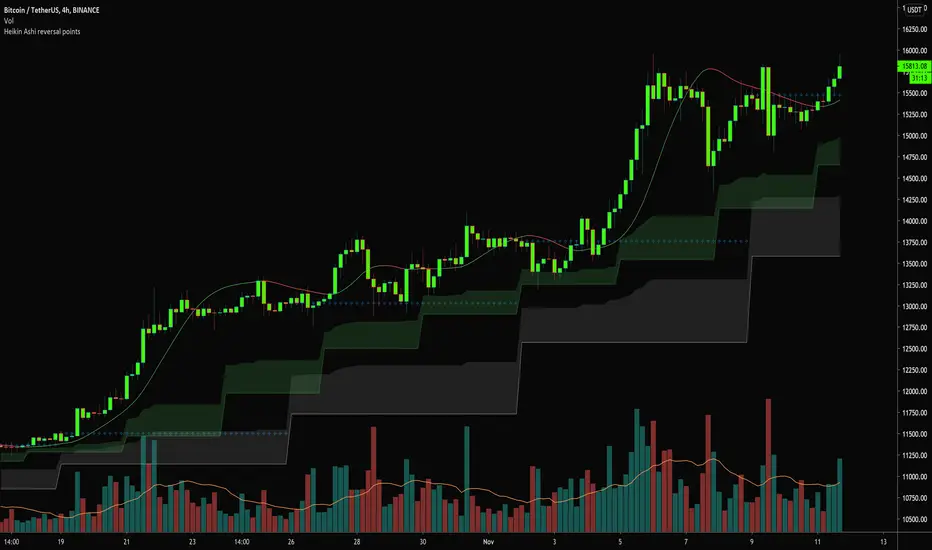
Heikin Ashi reversal pointsThis study plots higher time frames Heikin Ashi candles open values and creates clouds above/below those value. When lower timeframe candles enters this cloud - that is the turning point, where HTF Heiking Ashi candle change its color.
Script uses ALMA smoothing of current selected time period. When ALMA enters area, where HTF candles changes its color, then current candle is colored based on the possible next trend.
Script can be used for any time periods, but default values 4H ALMA , 3D (fast) and 1W(slow) Heikin candles.
Green candle = ALMA above both faster and slower HA candle reversal point.
Red candle = ALMA below both faster and slower HA candle reversal point.
Gray candle = indicision points - ALMA is between faster and slower HA candle reversal point.
To add further details - hull moving averages might be displayed, to support prediction of the next price trends.
Script was developed mainly for crypto
HA StudyShows trends based on 1W and 3D heikin ahsi candles and moving averages crossing next possible close prediction on 1W and 3D heiking ashi candles

Heikin Ashi Candles - Actual CloseHeikin Ashi Candles - Actual Close is a simple script that instead of displaying Heikin Ashi Close it displays the actual close.
This script is a handy tool for anyone that wants to use Heikin Ashi candles that displays the real close. The coloring of the candles is still based on the Heikin Ashi calculations.
Enjoy.

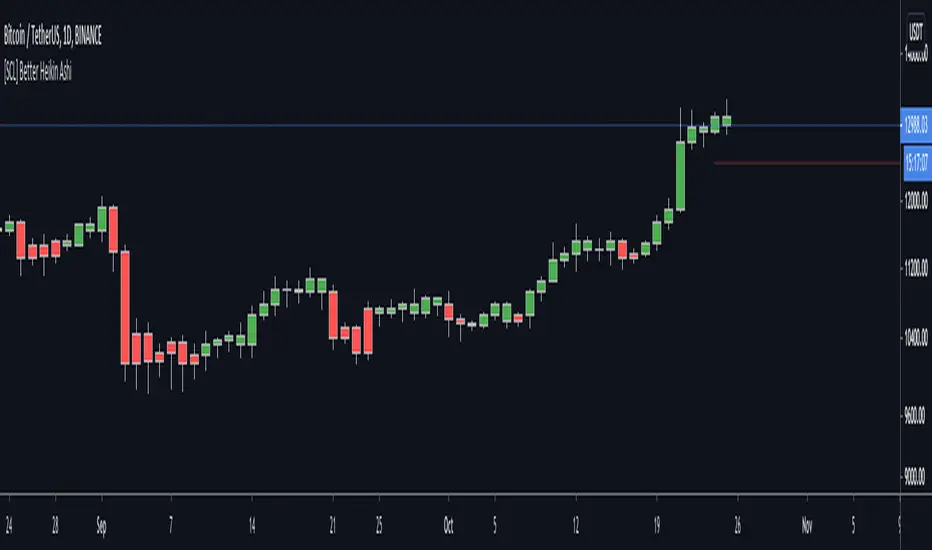
[SCL] Better Heikin AshiTo display the Heikin Ashi candle direction on your normal chart, using this script is better than switching between layouts. It includes different display modes so that you can use it alongside other indicators without clashing visually (bar colour/plotted shapes/shapes on flip only), and alerts on changes in direction. Many scripts include some or other of these features; here I've included them all in one for flexibility. One feature that AFAIK is unique is the "predictive close", which shows you where the current candle needs to close in order to change the Heikin Ashi direction.
Heikin Ashi is a different method of calculating candlesticks. It has several advantages:
+ It can help to show the dominant trend in a smoother way than normal candles.
+ Flips in direction can show either trend reversal, or a pause and continuation, which can be a place to join a trend.
Disadvantages of using Heikin Ashi include:
+ Having to change to a different chart layout
+ Difficulties working directly with Heikin Ashi values, because the values of the Open, Low, High, and Close displayed are different to the "real" prices.
This indicator solves this problem by bringing trend information from Heikin Ashi candles (whether they're bullish or bearish) onto your normal candle chart. It displays in the main chart pane.
Support and Resistance-Heiken Ashi-Swing Index System-alertsThis is a breakout system that has pivot swing lines and a trailing stop built in. Many people try to use different ways to find out what a swing point is such as, zig zags, lookbacks, fractals, hand-drawn chart lines, or other subjective indicators. This looks at the heiken ashi price to objectively find the swing pivots. Many would agree that the color changes in the heiken ashi bars are signs of price reversals. This indicator tells where the significant swing points will be based on this concept. A lookback for a specific number of bars is then done to make sure the lowest low or the highest high is the actual swing point by looking at all possible combinations where it could be after finding the color change in the heiken ashi bar. After the swing points are found, the pivot lines can act as support and resistance levels, as trailing stops, as a confirmation of a breakout, or any other use that S/R lines might have. The colored zone filling is included along with the pivot top and bottom lines to show that the price has broken above/below the pivot lines and has remained above/below them. This trailing stop can be used as a final indication of an exit for trend following, breakout system, or any other system that it might benefit from by sometimes reacting before other trailing stop to give off a more reliable exit signal. It works similarly to other trailing stops such as ATR based ones and Supertrend, but instead of being used for an exit or stop, it is meant more for an entry or confirmation signal. A breakout of a price pattern or S/R levels can be confirmed when the colored red/green zone changes color. Other trailing stops or exit strategies can be combined to give off a better exit.
I made this indicator so that instead of using a trailing stop line to show the direction of the breakout or trend, a colored zone is used so that it doesn't get in the way of the upper and lower lines. It can be turned off in the settings if only the support and resistance lines are needed. Other than that, this indicator doesn't need any inputs whatsoever to find out where the swing pivots points might and are found objectively using heiken ashi. I also included several alerts to signal whenever the trend direction color zone changes, when the price breaks support or resistance, or when it breaks the previous support and resistance levels.

Heikin Ashi Trend IndicatorMy own implantation of Heikin Ashi which i call HAT.
The Heikin Ashi Trend Indicator (HAT) used to determine the price direction of an asset, as well as draw attention to when the price direction is changing.
The HAT indicator translates the current close/open/high/low into Heikin Ashi and smooths them a bit using Tilson T3 formula.
Buy signal when Heikin Ashi Close is bigger than Heikin Ashi Open with Tilson T3 smoothing.
Sell signal when Heikin Ashi Open is bigger than Heikin Ashi Close with Tilson T3 smoothing.
Set the 'percentSqueeze' percentage to display possible reversal with light Red/Green crosses.
Green - Up Trend
Light Green - Possible reversal is near
Red - Down Trend
Light Red - Possible reversal is near
Follow for more indicators: www.tradingview.com

QuantNomad - Heikin-Ashi PSAR AlertsUsing this script you can create alerts for my Heikin-Ashi PSAR Strategy:
When creating alerts use "Once Per Bar Close" in parameters.
####################
Disclaimer
Please remember that past performance may not be indicative of future results.
Due to various factors, including changing market conditions, the strategy may no longer perform as good as in historical backtesting.
This post and the script don’t provide any financial advice.
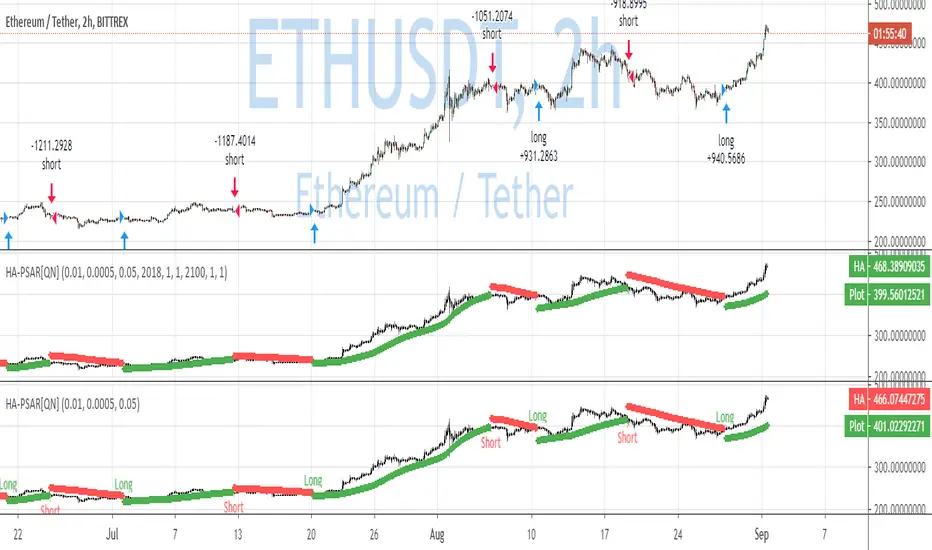
QuantNomad - Heikin-Ashi PSAR StrategyContinue experimenting with different combinations of strategies.
Here is the PSAR Strategy calculated based on HA candles. HA is already calculated inside the script, do not apply it to HA candles.
Strategy is calculated based on 25% equity invested with 0.1% commission.
####################
Disclaimer
Please remember that past performance may not be indicative of future results.
Due to various factors, including changing market conditions, the strategy may no longer perform as good as in historical backtesting.
This post and the script don’t provide any financial advice.

Trend trader StrategyFirst I would like to thank to @JustUncleL since this strategy started from one of his scalper strategies
This strategy can be adapted to all time charts .
First it has the session where we want to trade, for this example I choosed the EURUSD so I only take in consideration london/neywork session.
Its made from 3 EMA :
normal
slow
ultra slow
It has has the capacity to use HA candles into consideration if its needed.
At the same time we have a price channel made from faster MAs, that act like a bollinger band .
Together with all of them, we establish which trend we have if its uptrend or downtrend
Then we check the candles if they are below or above the MA , and based on the condition if they crossed recently we can suggest if its a buy or a long condition
At the same time we have 2 options of stop conditions:
Through a trailing stop made from ATR or % based
And second, a SL/TP made from pip points or % based.
For this example I used % based.
Let me know what you think about it, and if you found some nice settings for it. So far I only adapted to EURUSD 1 min time.

|AG| Heiken Ashi Scanner|AG| Heiken Ashi Scanner
Heiken Ashi shares some characteristics with standard candlestick charts but differs
based on the values used to create each candle.
Instead of using the open, high, low, and close like standard candlestick charts,
the Heikin-Ashi technique uses a modified formula based on two-period averages.
This gives the chart a smoother appearance, making it easier to spots trends and reversals,
but also obscures gaps and some price data.
Heikin Ashi in my perspective is one of the best trend detectors in long term scenarios.
The use of Heiken Ashi Smoothed could be determined by the use of a moving average.
The use of Smoothed with Simple, Exponential, and Hull Moving Average are included in this script.
Script Explanation:
This Script is going to plot us different Heikin Ashi when they are up ( Bullish ) is going to be colored.
7 different Time-Frames are going to be taken into account.
Also is possible to modify the Length Setting and the MA calculation.
Setting Options:
↪Scanner TIME:
↪This Script (Scanner) is going to show us different Heiken Ashi Time-Frames
↪7 in total.
↪Higher Time-Frames
60 - 120 - 240 - 480 - 1D - 3D -1W
↪Lower Time-Frames
1 - 5- 15 -30 -60 - 120 -240
↪Smoothed?:
↪Select Turn On/Turn Off
↪Is going to select or deselect Smoothed Heiken A. or change in base our configuration.
↪Select Type:
↪This option let us select between:
↪ Exponential and Hull Moving Average.
↪Length Options
↪Length 1
↪Length 2
↪ In EMA and SMA I prefer 1:3 and 1:5
↪And In Hull MA. I prefer 10:1
↪Design Settings
↪Color Options
↪ U can select different color options.
↪ My Favorites are Orange, Aqua, and Purple.
↪Transparency
↪Set Transparency 0 is 100% visible and 100 is invisible.
↪LineWidth (defval= 5)
↪Set the thickness
↪Show Information Panel
↪ We are going to have a little informative panel in the right so we could
have a quick look at the trend.
↪Panel Position Offset (defval= 33)
Examples Of Color Options:
Examples Of Configurations:
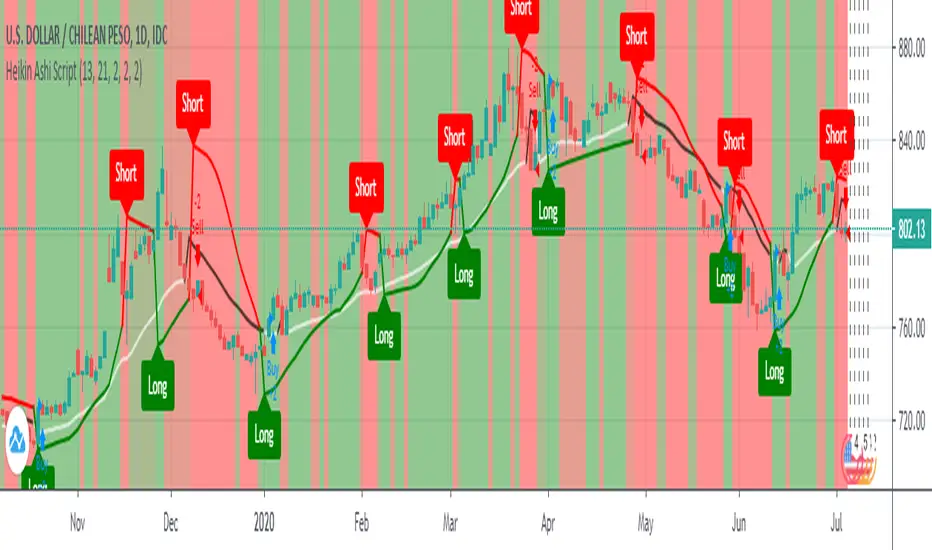
Heikin Ashi ScriptThis is a backtested Heikin-Ashi candles color change strategy.
You have to use this strategy on normal candles and not Heikin-Ashi!!!
Why normal candles? :- Because if you'll apply this strategy on Heikin Ashi candles then your backtesting won't be valid.
Here's how to use it.
Go LONG in case of ALL of the condition matches:-
1) When Buy arrow appeared under the last daily candle.
2) Candle background color should be green.
3) When the MA line changes the color from red to green.
Go SHORT in case of ALL of the condition matches:-
1) When Sell arrow appeared above the last daily candle.
2) Candle background color should be red.
3) When the MA line changes the color from green to red.
This strategy work in all the asset and all the timeframe.
Happy Trading!!!