DailyDeviationLibrary "DailyDeviation"
Helps in determining the relative deviation from the open of the day compared to the high or low values.
hlcDeltaArrays(daysPrior, maxDeviation, spec, res) Retuns a set of arrays representing the daily deviation of price for a given number of days.
Parameters:
daysPrior : Number of days back to get the close from.
maxDeviation : Maximum deviation before a value is considered an outlier. A value of 0 will not filter results.
spec : session.regular (default), session.extended or other time spec.
res : The resolution (default = '1440').
Returns: Where OH = Open vs High, OL = Open vs Low, and OC = Open vs Close
fromOpen(daysPrior, maxDeviation, comparison, spec, res) Retuns a value representing the deviation from the open (to the high or low) of the current day given number of days to measure from.
Parameters:
daysPrior : Number of days back to get the close from.
maxDeviation : Maximum deviation before a value is considered an outlier. A value of 0 will not filter results.
comparison : The value use in comparison to the current open for the day.
spec : session.regular (default), session.extended or other time spec.
res : The resolution (default = '1440').
High
Daily DeviationShows you the normal deviation from the OPEN based upon historical data.
Levels measured:
Normal range (1 standard deviation) of the CLOSE (vs the OPEN).
Normal daily HIGH +1, +2, +3, and +4 standard deviations.
Normal daily LOW -1, -2, -3, and -4 standard deviations.
Configuration:
Always shows you the normal CLOSE vs OPEN range for the current session.
Can display previous day's ranges (extra days) based upon the calendar (not trading days).
Normally displays which levels have been exceeded (to reduce noise and keep auto-scale to a minimum), but can show all the ranges for the current session.
The default number of days to measure (50) will affect the accuracy but outliers are cleaned to avoid dramatic variance.
Note:
These are only statistical representations of what has occurred in the past. You can interpret the current price as oversold or overbought for the day (and only that day) relative to the OPEN. Gaps high or low are not considered in the equation.

DailyLevelsLibrary "DailyLevels"
Functions for acquiring daily timeframe data by number of prior days.
openD(daysPrior, spec, res) Gets the open for the number of days prior.
Parameters:
daysPrior : Number of days back to get the open from.
spec : session.regular (default), session.extended or other time spec.
res : The resolution (default = '1440').
Returns: The open for the number of days prior.
highD(daysPrior, extraForward, spec, res) Gets the highest value for the number of days prior.
Parameters:
daysPrior : Number of days back to get the high from.
extraForward : Number of extra days forward to include.
spec : session.regular (default), session.extended or other time spec.
res : The resolution (default = '1440').
Returns: The high for the number of days prior.
lowD(daysPrior, extraForward, spec, res) Gets the lowest value for the number of days prior.
Parameters:
daysPrior : Number of days back to get the low from.
extraForward : Number of extra days forward to include.
spec : session.regular (default), session.extended or other time spec.
res : The resolution (default = '1440').
Returns: The low for the number of days prior.
closeD(daysPrior, spec, res) Gets the close for the number of days prior.
Parameters:
daysPrior : Number of days back to get the open from. 0 produces the current close
spec : session.regular (default), session.extended or other time spec.
res : The resolution (default = '1440').
Returns: The close for the number of days prior.
hlc3D(daysPrior, extraForward, spec, res) Gets the HLC3 value for the number of days prior.
Parameters:
daysPrior : Number of days back to get the HLC3 from.
extraForward : Number of extra days forward to include. Determines the closing value.
spec : session.regular (default), session.extended or other time spec.
res : The resolution (default = '1440').
Returns: The HLC3 for the number of days prior.
Daily HIGH/LOW strategyThis is a DAILY High/LOW strategy combined with a moving average and volume for more accuracy.
The rules are simple :
For long if we had a cross of the high with the previous high and close of the candle is above moving average and chaikin money flow volume is positive we have a long entry.
We exit when we cross down the moving average with the close of the candle.
For short if we had a crossdown of the low with the previous low and close of the candle is below moving average and chaikin money flow volume is negative we have a short entry.
We exit when we cross above the moving average with the close of the candle.
This strategy has no risk management inside so use it with caution.
If you have any questions, let me know

High Low Open Mid Ranges & Levels (Multi-Timeframe)This indicator automatically plots the chosen timeframe's high, low, mid point and open. These levels on higher timeframes act as support and resistance levels on lower timeframes, helping find entries, stoploss and profit targets.
Most common timeframes to choose are Daily, 1W, 1M, and 3M. Other timeframes that are good include, 2D, 2W and 2M.
For example, you can see in the snapshot below, we are on the 4hr TF showing those levels from the 2W. This historical 2W zone (open and mid) was (and currently still is) resistance. You can see it also provided a good entry to go short.
This is also useful for intraday scalping. Below, we are on the 15min TF with levels set on the 2D timeframe. You can see how the Open and Mid levels acted as resistance, providing good entries on range trades, with take profit set at the previous 2D low.
There is also a table which tells you all the main TFs high, low, open, and mid levels. They are the most important ones to look out for.
This indicator should not be used in isolation; it is best to pair it up with other TA such as orderblocks, S/D zones, S&R or overlay indicators.

Pivot TrackerThis script finds swing lows and swing highs based on input criteria for lookback and lookforward periods, and plots letters accordingly.
Helps identify trend or lacktherof
HH = higher high
LH = lower high
HL = higher low
LL = lower low

ICHIMOKU Crypto Swing StrategyThis is a crypto swing strategy designed for timeframes bigger than 1h.
The main components are
ICHOMOKU
KDJ
Average High
Average Low
Rules for entry
For long: we have the ichimoku crosses between tenkan and baselines, we have a rising kdj line and at the same time we have a increase in the average high
For short: we have the ichimoku crosses between tenkan and baselines, we have a falling kdj line and at the same time we have an increase in the average low
Rules for exit
We exit when we have inverse conditions than the initial ones used for entry.
Caution
This strategy does not use a risk management, so be careful with it !
If you have any questions let me know !

Poor ReversalsPoor Reversals Indicator
This indicator finds Poor Reversals. Poor reversals are reversals in price with consecutive highs or lows that are close together. Look for the different types of highs and lows. Some say candle patterns don't matter, but they forget it's the orderflow that makes the pattern. Find poor, tweezer, and 1 tic rejections and study what happens next. We don't need to read the depth of market to see what the orderflow is saying. They are called poor because the auction didn't run its course. It didn't continue the direction until all activity in that direction was exhausted. Proper reversals create excess. Excess is a long tail/wick. A proper reversal leaves a long tailed excess unfilled.
The different highs and lows give clues to what kind of orderflow happened there. The difference between them is which high or low happened first. Price does often come back to these areas and clears them up with a proper reversal. We can see them on all timeframes. Knowing what they mean in the orderflow helps with reading charts.
The Poor Reversals are:
Poor
1 Tick Rejection
Tweezer
When looking at 2 bars that have very close high or lows, there are a few different types. They are each poor and can be further defined as each are price action clues.
If next low is higher, it's a poor low
If next low is lower, it's 1 tic rejection
If next low is equal, it's tweezer bottom
If next high is lower, it's a poor low
If next high is higher it's 1 tic rejection
If next high is equal it's tweezer bottom
Poor Highs and Lows:
The high or low comes first. The next bar does not go past it. Poor highs and lows are often created from price exhaustions. This means at poor highs buyers are trapped. At poor lows sellers are trapped. Price ran out of steam to continue in that direction. There wasn't enough activity and participation to continue the auction in that direction.
Poor lows are defined when 2 lows are very close, and the 1st bar is lower. The 2nd comes very close to a new low. It happens most when shorts, at the moment, "run out of steam". They were "too aggressive" and got themselves "short in the hole". When a poor low is made, price will bounce because shorts are buying to protect profits.
Poor highs are defined when 2 highs are very close. The 1st bar is higher. The 2nd comes very close to a new high. It happens most when longs, at the moment, "run out of steam". They were "too aggressive" and got themselves "long in the tooth". When a poor high is made, price will pullback because longs are selling to protect profits.
1 Tick Rejections:
The high or low comes last. The next bar goes just a little bit beyond it. A "1 tic rejection" happens when a new low is made and quickly rejects. The name is misleading. It doesn't have to be "1 tic". Different markets have different measurements. For ES, it's less than 8 tics. For NQ, it's about 5-20 points. It varies depending on relative market volatility.
1 Tick highs are defined when 2 highs are very close, and the 1st bar is lower. This happens when longs are aggressive and drive price up. Price makes a newer high and longs rapidly start taking profits. Their selling activity drives price lower. In the orderflow, longs likely closed at the same time new shorts sell. This competition to sell drives price lower. At the high, it says longs saw it wouldn't go higher and they took rapid exit.
1 Tick lows are defined when 2 lows are very close, and the 1st bar is lower. This happens when shorts are aggressive and drive price down. Price makes a newer low and shorts rapidly start taking profits. Their buying activity drives price higher. In the orderflow, shorts likely closed at the same time new longs buy. This competition to buy drives price higher. At the low, it says shorts saw it wouldn't go lower and they took rapid exit.
Tweezer Tops and Bottoms
The highs or lows of the bars are equal. Tweezers most often mean that an aggressive trader is influencing price. They drove price in one direction and then quickly reversed sentiment. Tweezers most often happens in stop hunts. An aggressive trader found where the stops were located and then entered an aggressive order to turn the market.
Tweezer Tops are defined when 2 highs are equal. The first bar sets the high. The second bar matches the high. This happens when there is an active seller entering. It could be simple profit taking from longs or new aggressive shorts. In bull trends, price will move up to find short stop. When the stops are found, the market reverses sharply lower.
Tweezer Bottoms are defined when 2 lows are equal. The first bar sets the low. The second bar matches the low. This happens when there is an active buyer entering. It could be simple profit taking from shorts or new aggressive longs. In bull trends, price will move up to find long stops. When the stops are found, the market reverses sharply higher.
Poor Reversals can be poor, 1 Tick Rejections, or Tweezers. They are all considered poor and upon further investigation we can see they are created from different conditions in the orderflow. They are not called Poor Reversals because they are weak. They are called poor because of the action that happened there. One side got caught in a bad position. Other sharks in the market smelled blood and ripped them apart.
This indicator is a work in process. While the concepts are great for real time trading, this indicator is not designed to be used in real time trading. It will repaint based on the bar close. The purpose of this indicator is to train our brains to see these nuances on candle charts. Some say candle patterns don't matter, but they forget it's the orderflow that makes the pattern. We must make split second decisions and knowing the context behind the orderflow reduces response time. These poor reversals don't have to retest, and the best ones won't come back. I use these concepts to find exits, where my trades might be wrong, confirmation I'm on the right side. It's amazing how these simple nuances can turn the markets. But sure enough, they do. Check them out in all time frames.
It's a fun indicator to play with. Some markets do require tweaks to the “Ticks” setting. Too big and charts will be noisy. Too low and not much will show up. A general rule of thumb is more volatile markets need higher tick values while less volatile need lower Tick values. Higher timeframes are also more reliable than lower time frames. I've included some customizable settings and I plan on adding more in the future. Enjoy!

Michigandolf's 30min Opening RangeThis script plots the 30min Opening Range as well as the previous day's high & low.
Description:
Blue Line = Top of the 30min Opening Range for the session
Pink Line = Bottom of the 30min Opening Range for the session
White Line = Mid-Point of the 30min Opening Range for the session
White Transparent Area = The full range of the 30min Opening Range
Green Line = Yesterday's High for the session
Red Line = Yesterday's Low for the session
Use:
The Opening Range will continue to expand until the first 30minutes of trading has passed, at which point the range will lock in place for the remainder of the trading session. Many traders use these important levels to gauge trade entries and exits (e.g. Mark Fisher's ACD strategy).
This script does not work currently work for futures (e.g. ES, NQ, RTY) due to the session start time. Will configure for futures trading in a future update.

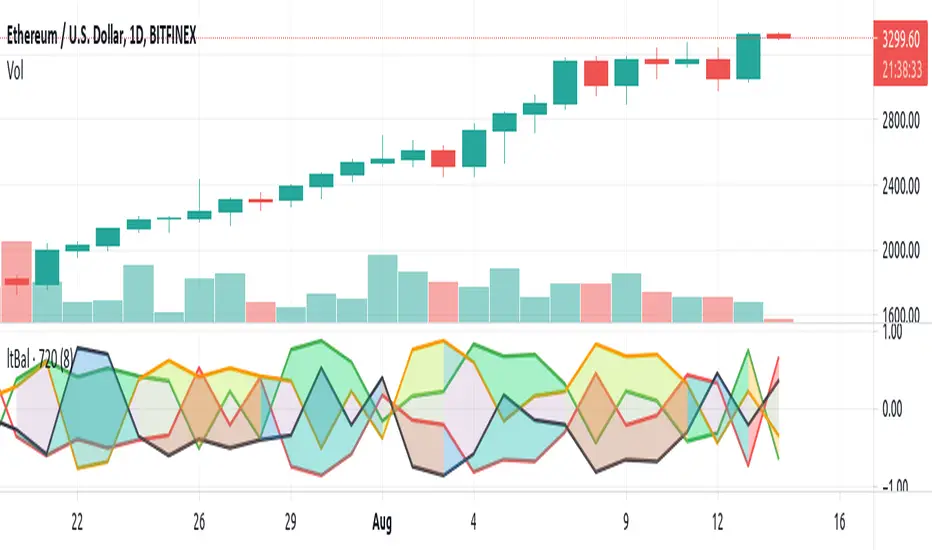
Light BalanceThe script is simple, going for a color scheme logic which tenderly avoids rigorous signals processing.
For the script to remain simple, logical derivatives are also out; as such, there are no secondary relations built off of primary ones. And it also ignores (unless you do this yourself) the logic in a varying order of lines.
Coloring has been done according to a limited set of relations between the four (4) plotted lines.
Quite a bit of information is capture, as you'll see when looking at line order, crossings, and transparency transitions and their patterns.
The approach makes the relations ones which can be learned over time; you become the algorithm to sort out signals. Ha ha. I know that sounds like a cop out doesn't it. Did I mention it's a simple script?
One thing you might want to play with right away are fills having red and green, and lime and fuchsia. It would be cool to reduce it all down to two (2) colors, but all the boolean relations might have to be listed, and it also may not be possible to cumulatively combine transparency overlays of the same value. Visually, that approach may not result to awaken a useful feature anyway. Also, fill() has its limitations in that it cannot be in a local scope; this includes function wrapped calls to fill(), or calls made using branching logic statements if/elseif, iff(), and var = (cond) ? t_val/exp : f_val/exp. So, to my knowledge, a fill() can not be made to be logically on/off.
Please, enjoy getting some use out of it.
Extremely high win rate FOREX swing strategyTHis is a very simple yet extremely efficient FOREX strategy .
In general it tends to work the best against NZD and AUD pairs, however other major pairs and crosses can work as well.
It's made of a time management, together with MACD , moving average , a price action rule and a risk management.
THe logic behind is the next one :
For LONG:
We have 3 ascending candles.
Histogram of MACD is positive.
Last close of a candle is was above moving average.
If all those previous condition happened before 17/18 UTC time depending if its summer time or not, we enter the trade.
For Short:
We have 3 descending candles.
Histogram of MACD is negative.
Last close of a candle is was below moving average.
If all those previous condition happened before 17/18 UTC time depending if its summer time or not, we enter the trade.
RIsk management
For risk management, since we aim to have a 95%+ win rate, we aim to have a 5:1 or 10:1 risk to reward ratio. Meaning that for each $ we can win, we can lose 5-10$.
THats why I recommend to be extremely careful when playing with leverage with this strategy.

Pivot Points High Low MTF [Anan]█ OVERVIEW
Pivot Points High Low with Multi Time Frames support and bull/bear signal depends on pivot average
█ FEATURES
- Fully control of pivot (Source / Length Left / Length Right)
- Show HH, LL, LH, HL price on candles
- Show Avg Pivot High Low.
- Show Bull/Bear Labels.
- Control of signal accuracy (default: 0.5%)
- Show Pivot High Low Levels as a Fractal Chaos Channel.
- Multi-timeframe Table with support of Pivot High Low and pivot Average.
- BreakOut and BreakDown Labels in the table.
- Full control of displaying any row or any column.
- Full control of Table position and Size and Colors.

Fib High Low PointsThis is a simple indicator which plot high and lows based on Fibonacci sequence.
Best part of this indicator is it don't rewrite itself once it got plotted on the chart, which make it unique from other High low indicators.

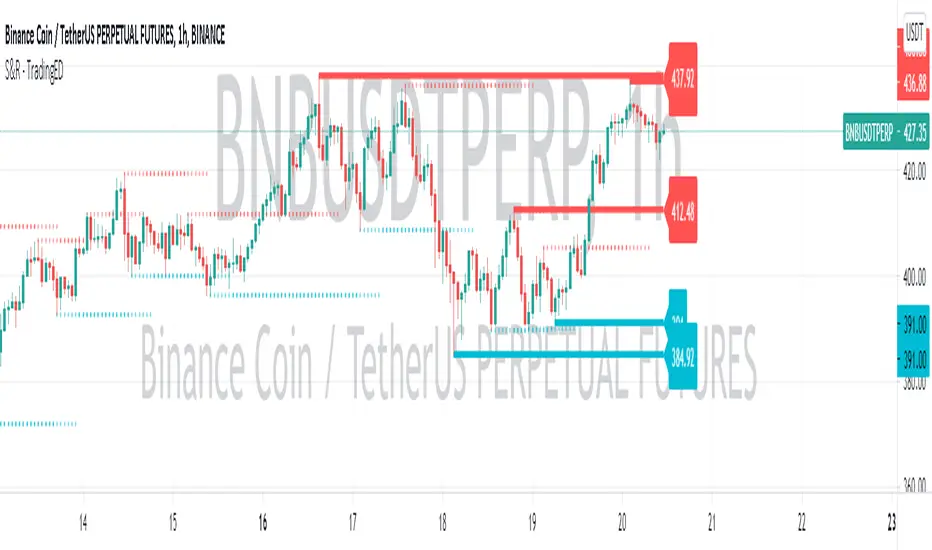
Support & Resistance - TradingEDThe use of this indicator is restricted to private use, and it can be used only by invitation. Different functionalities have been added, such as alerts and signals that seek to make trading much easier to interpret by any type of trading operator of any experience level, from beginner to intermediate and advanced.
This indicator will help you identify support and resistance levels over a previously determined range, whether from a count by candles , by minutes , hours or days . These support and resistance levels are calculated thanks to the highest and lowest points that will be painted along the chart, from the levels that you have previously selected .
You will even have a way to identify the most recent levels , thanks to the fact that they will be painted in a darker tone , as well as some price labels to quickly identify each of the levels on the chart . Identifying these levels sometimes seems like a pretty difficult task, but with this indicator you will discover that it will be much easier than you think to be able to master these levels.
As part of the analysis of chart patterns, traders use these price levels on charts that tend to act as barriers, preventing the price of an asset from being pushed in a certain direction. Support and resistance levels serve to identify the points where the price can favor certain probabilities for a stagnation or reversal of a prevailing trend.
Main functions of this indicator:
1) The MEASURE can be based on a CANDLES count if you are trading OHLC Charts from 1D onwards , or if your trading is intraday, you can also select counts by MINUTES , HOURS or DAYS , depending on your trading style.
2) LENGTH , by default it will be loaded as in the STRATEGY , but considering the previous point, you can modify it according to your convenience.
3) You have the option to hide or show the EXTENDED LEVELS the way to identify the most recent levels.
4) You have the option to hide or show a LABEL at the right of the chart, with respect to the price levels.
Main functions to customize the style of this indicator:
a) You can select the COLOR for Support and for Resistance, with the colors that best suit you.
b) In the case of the LABELS that appear at the right, the text, type of label and default color is not modifiable.
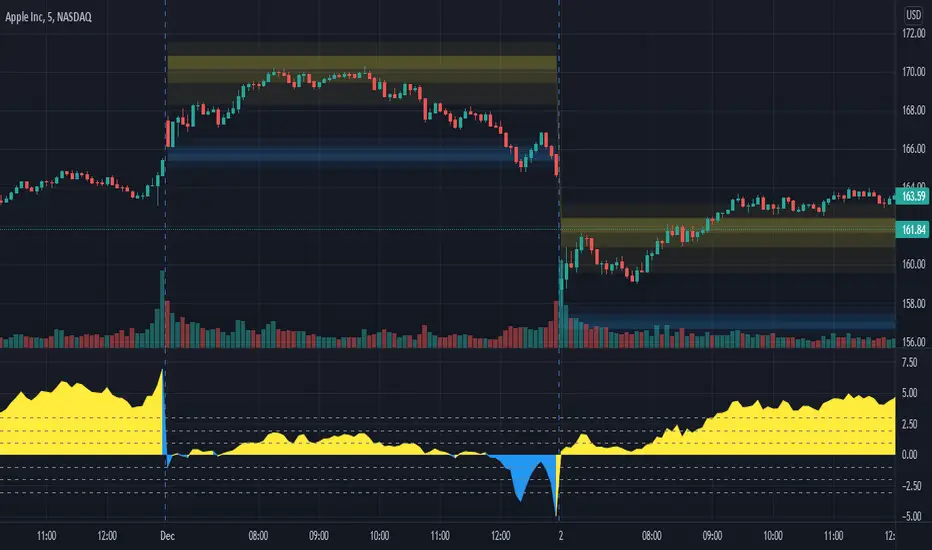
nonoiraq indicator it's very strong i edit this indicator to connect it with my bot to auto trading and he take the info from the volume, so when he is give me a single the bot take just 0.50% to 1% for 3 - 5 trade in day and this perfect, if u use a manual trading this indicator can reach to from 10% to 80% in some point .
the indicator have 3 line
(Red , Purple, Yellow)
1- The yellow line it's high sensitivity this mean it's when rich to the -3 or 3 you can open the order when the bar is close and the signal be sure
and u need to watch the your order because in some case he is reach to 0.30% to 2% and the price reflected to loss and when you wait the price reflected to but my advice you take profit and close the order directly.
2- The purple circles it's medium sensitivity this mean when the purple hit the 2.5 or 3 from down or up in indicator with yellow line you open the order when bar close and the signal is be sure , like example in the photo
3- The red circles it's low sensitivity and this one when reach to 3.0 with any line (yellow or purple) you open directly short or long , like the example in the photo
i am sorry for my english it's not very good
please support me to share other idea or script

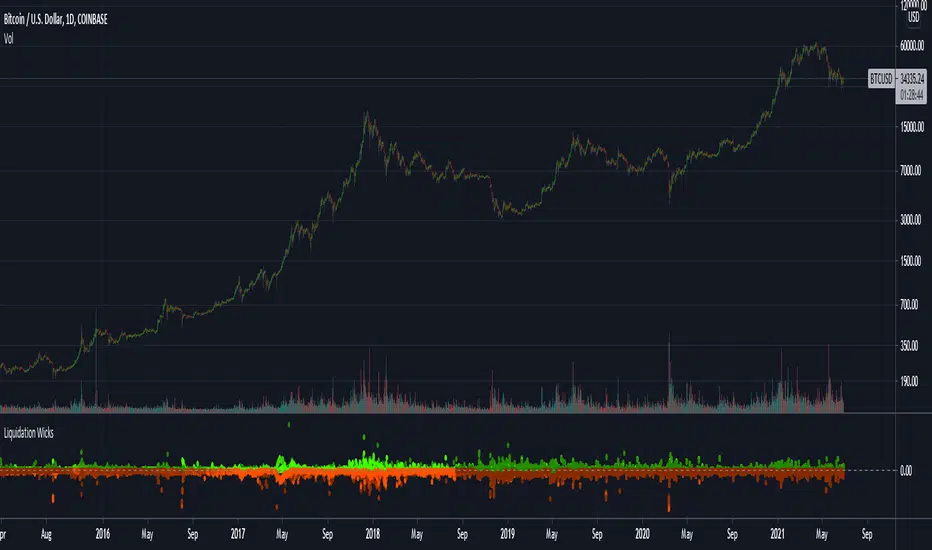
Liquidation Wicks BTCThis script shows the variance between the various btc intruments to find when liquidation cause extreme wicks and price disparity between exchanges
The red dots indicate the difference of the LOWS
and the green dots indicate the difference of the HIGHS
The indicator only works for BTC but it doesn't matter what chart its used on
Example - Custom Defined Dual-State SessionThis script example aims to cover the following:
defining custom timeframe / session windows
gather a price range from the custom period ( high/low values )
create a secondary "holding" period through which to display the data collected from the initial session
simple method to shift times to re-align to preferred timezone
Articles and further reading:
www.investopedia.com - trading session
Reason for Study:
Educational purposes only.
Before considering writing this example I had seen multiple similar questions
asking how to go about creating custom timeframes or sessions, so it seemed
this might be a good topic to attempt to create a relatively generic example.

OBV High / LOW (On-Balance Volume )This is a simple application of OBV indicator (On-Balance Volume ), to visually determine when a given stock current obv is near the highest or lowest based on the number of lookback bars.
Indicator examples:
### OBV value is near an all-time high ##
breakthrough , stock value could set new all-time highs.
rejection , stock value could come down or consolidate.
Example
Inputs
OBV High Lookback -> numbers of bars to look back for the obv high.
OBV LowLookback -> numbers of bars to look back for the obv low.
OBV EMA Length -> Ema length
Notes:
This script also comes with an ema indicator based on obv for smoothing the obv signal since it gets noise at lower timeframes (by default comes disabled)
OBV information
www.investopedia.com
Comments:
This is my first script any ideas, suggestions, or detected errors (language/script) don´t hesitate to send a message.
Best regards, Mauro.

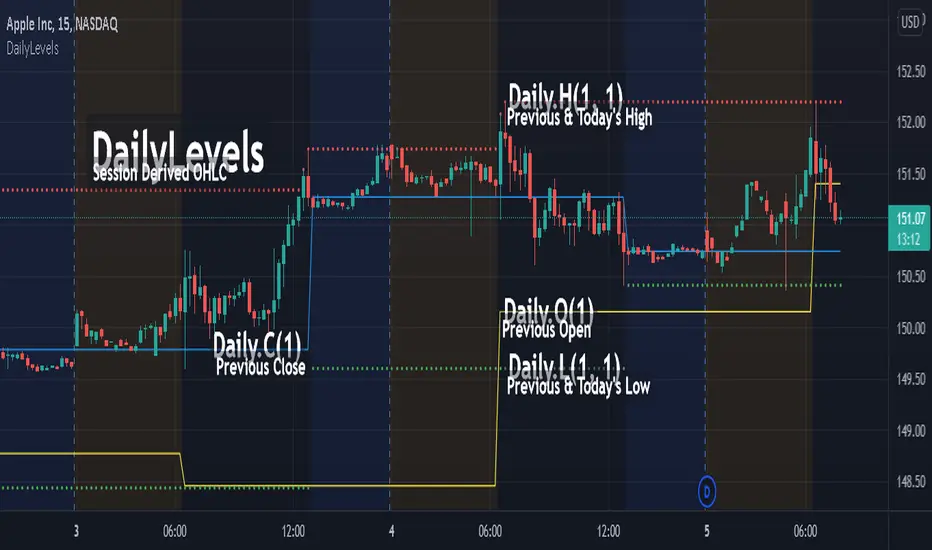
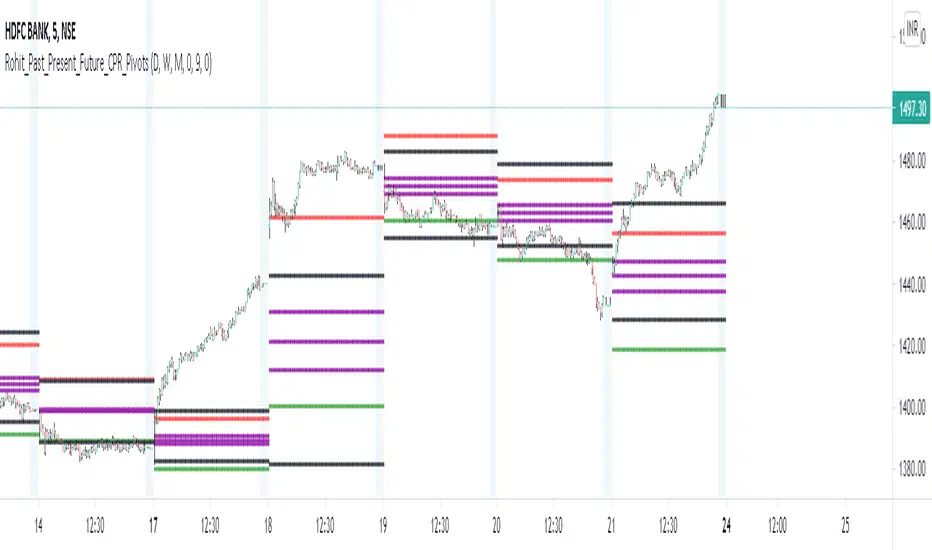
Rohit_Past_Present_Future_CPR_PivotsThis script is for all market types, one could see historical, present and future pivots and CPR at the same time. Also one could apply daily, weekly and monthly pivot levels all together,. Further, daily/weekly/monthly high and low support could be seen as well.... Good Luck with your trading!!!!
Magic Band MA20 High LowMA 20 period Magic Band - based on Highs and Lows (as opposed to Close), can be used on any time frame for a better grip on price action.

ORTI Swing High Low / Support Resistance (Static TFM)The "ORTI Swing High Low / Support Resistance (Static Timeframe Multi-Period)" is based into existing studies that shows support and resistance levels taking as reference the highest and lowest points of certain periods, as a redesigned and recalculated set of the common plotted lenght.
The cherry on the top for this version is, when you want to get a predetermined count in (ranges) units of time, as: minutes, hours or days, in any a intraday graph you could get a static lenght, and this count will be automatically respected. For example, an average could be configured to know a high or low levels per hour, day, week or month ... or whatever comes to mind, and at every single chart that you move through (5m, 15m, 1h, 4h, etc), you will see the same lenght to make your own "support and resistance analysis" into a micro / macro market view.
Remember that part of analyzing chart patterns, the support and resistance levels are undoubtedly two of the most highly discussed attributes of technical analysis. Part of analyzing chart patterns, these terms are used by traders to refer to price levels on charts that tend to act as barriers, preventing the price of an asset from getting pushed in a certain direction.
With the new features, you will get a little help to identify in your technical analysis some signals to identify price points on a chart where the probabilities favor a pause or reversal of a prevailing trend. Support and resistance areas can be identified on your charts using this indicator.
For more technical information look at Investopedia.
Note: The previous calculation example is not the default, the parameters can be adjusted according to the criteria of the merchant.

R-HL-PDWThis script doesn't give buy or sell signals. It gives a reference point to the previous day's high and low as well as the previous week's high/low. This will be helpful for intraday trading decisions.

High Low Reversal This bot makes use of an algorithm which detects new highs and lows. When doing long trades, the bot will trigger a buy order on a newly made low. When making shorts, the bot will trigger a short trade on new highs.
Currently, the bot is optimized for cryptocurrencies on the M15 time frame. With the right amount of leverage and portfolio optimization this bot can obtain very strong results.
Feel free to optimize it to your own liking on different assets and/or time frames.
This bot performs exceptionally well in trending markets. Currently, it's only making long trades, but you can make it do short trades in the control panel.
The settings of the back test as follows:
starting capital = 100k
leverage = 1
commission = 0.2%
Equity per trade = 50%. Since the bot only makes one trade at a time you can allow it to use a bigger portion of your balance per trade.
I've also made a study-script for easy implementation on the exchange. You get that script once you get access to this bot.
