Higher Highs & Lower Lows Stochastics - Vitali ApirineThis is my modified "Higher Highs & Lower Lows Stochastics" employing PSv4.0, originally formulated by Vitali Apirine for TASC - February 2016 Traders Tips. Reading through a TASC magazine of mine, behold, I found a little known indicator that I can't find anywhere on all of Tradingview. That was a tragedy I felt I had to resolve... This indicator is best described as a dual momentum indicator, being helpful with anticipating reversals, spotting emerging trends, and defining correction periods. I felt it worthy of justice to unveil this for all TV members to utilize and also learn from. It's uniqueness is beyond past due for the honor it deserves on Tradingview.
As always, I have included advanced Pine programming techniques that conform to proper "Pine Etiquette". For those of you who are newcomers to Pine Script, this code release may also help you comprehend the "Power of Pine" by employing advanced programming techniques while exhibiting code utilization in a most effective manner. This script's uniqueness displays that we can now override built-in Pine functions. Firstly, you may have noticed that I replaced ema(), sma(), highest(), and lowest(). If you weren't aware of this Pine capability, well, here is a prime example... Now you know! Just heed caution when doing so to ensure your replacement algorithms are 100% sound. Lastly, I also added an additional "Median" line where the companion stochastics seemingly appear to gravitate within a central zone.
NOTICE: You may have observed, there is highest(), lowest(), ema(), and sma() custom functions overwriting Pine built-ins, some of which are audaciously used in ternary. "IF" you are planning to use Pine Script v4.0 functions in ternary, be forewarned, they WILL NOT operate as expected in most scenarios. The reason why I legitimately used them here in ternary is because they are ONLY manually controlled by an input(). If these were dynamically controlled with bar-to-bar dynamic conditional logic, you would most certainly run into serious unexpected programming issues, potentially resulting in hours of frustrations and guaranteed loss of hair. That's my lesson for this release, so never ever forget this when utilizing the full potential of the "Power of Pine". For more information concerning these potential dilemmas, please consult "Execution of Pine functions and historical context inside function blocks" in the "Pine Script v4 User Manual".
Features List Includes:
Dark Background - Easily disabled in indicator Settings->Style for "Light" charts or with Pine commenting
AND much, much more... You have the source!
The comments section below is solely just for commenting and other remarks, ideas, compliments, etc... regarding only this indicator, not others. When available time provides itself, I will consider your inquiries, thoughts, and concepts presented below in the comments section, should you have any questions or comments regarding this indicator. When my indicators achieve more prevalent use by TV members, I may implement more ideas when they present themselves as worthy additions. As always, "Like" it if you simply just like it with a proper thumbs up, and also return to my scripts list occasionally for additional postings. Have a profitable future everyone!
Higherhigh
Smart Indicator 28 - Swing Pivots (Higher Highs and Lower Lows)A simple way to find Higher Highs and Lower Lows (HH and LL) whit automatic Fibonacci Lines in the most common levels.
In this indicator the Higher Highs only happens when a high value are rising from each other in the last "Length of Real Pivots" highs and the next same number of highs are falling in every single bar.
The Lower Lows are inverted, LL only appears if a low is falling in every single bar in the last number of length and the lows price of the "n" bars next are rising.
You can use this Indicator in any kind of market.
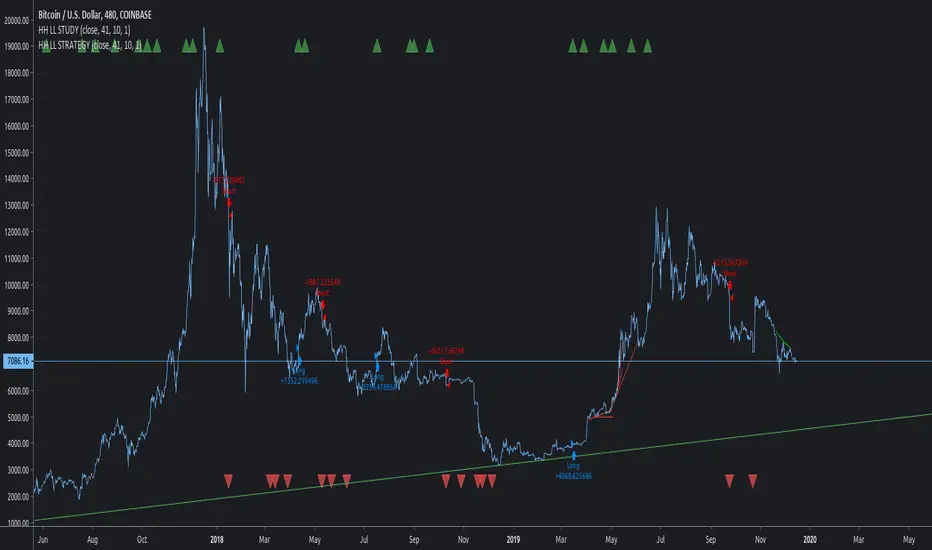
HIGHER HIGH LOWER LOW STRATEGYThis is my favorite for Tradingview.
Please use other indicators to find good entry and good exit. This is why this publication has so many indicators. A good indicator will find good results even on line chart. Feel free to try on "Heiken Ashi" but understand that "line" chart is much more realistic
Due to tradingview's crappy auto resize, the best way to view this script is to click on the share button and "Make it Mine".
Then you can see why my other indicators are "PRESENT"
Cheers!!!
Highs & LowsHigh and Lows Script.
For all the price action lovers out there.
Hope you all enjoy.
Thanks
Swing PointsThis indicator gives a clear indication of price action swing-points as well as an indication of whether it is a higher, lower, or equal swing point relative to the last high/low.
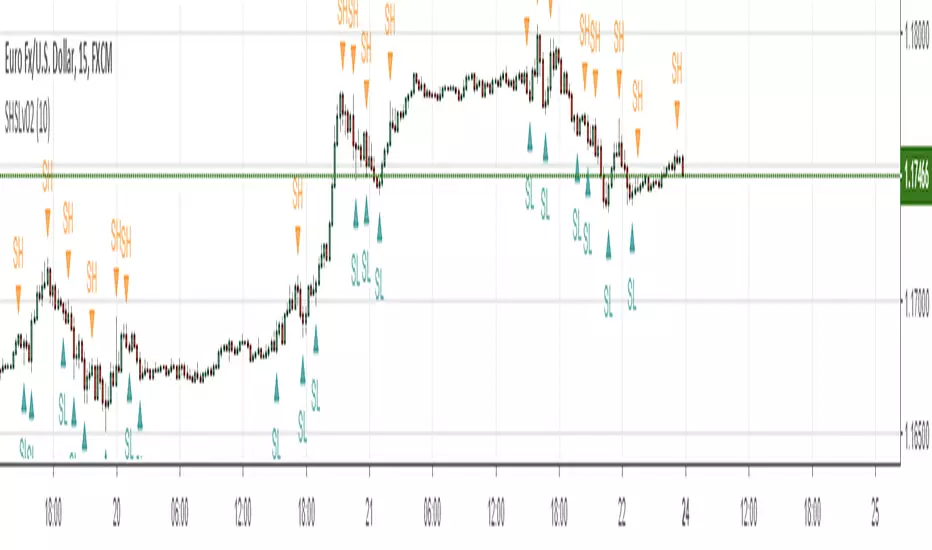
Swing Highs and Lows (version 2)My second version of plotting Swing Highs and Swing Lows
A Swing High (SH): a price bar high preceed by two lower highs (LH) and followed by two lower highs (LH)
This version enables you to ignores swing highs and lows when the market volatility is small and not suitable for trading.
Thus it will depict fewer number of SH and SL markers, making the chart a bit cleaner and easier for us to read.
Volatility is measured simply by the amount of pips moved within five consecutive bars: the default is set at 10 pips, meaning that when you take five consecutive bars and the gap of the highest high and the lowest low is less than or equal to 10 pips, it will not depict SH or SL markers.
To use this function, check "set volatility threshold?" box under the Format icon and set a threshold in pips.
(I typically trade EURUSD so the pips input is customized for that)