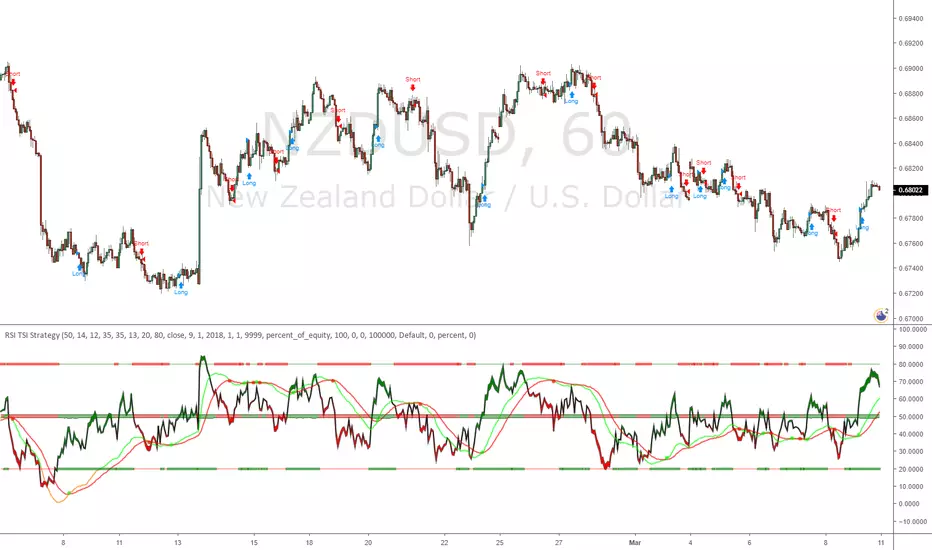
RSI and Smoothed RSI Bull Div Strategy [BigBitsIO]This strategy focuses on finding a low RSI value, then targeting a low Smoothed RSI value while the price is below the low RSI in the lookback period to trigger a buy signal.
Features Take Profit, Stop Loss, and Plot Target inputs. As well as many inputs to manage how the RSI and Smoothed RSI are configured within the strategy.
Explanation of all the inputs
Take Profit %: % change in price from position entry where strategy takes profit
Stop Loss %: % change in price from position entry where strategy stops losses
RSI Lookback Period: # of candles used to calculate RSI
Buy Below Lowest Low In RSI Divergence Lookback Target %: % change in price from lowest RSI candle in divergence lookback if set
Source of Buy Below Target Price: Source of price (close, open, high, low, etc..) used to calculated buy below %
Smoothed RSI Lookback Period: # of candles used to calculate RSI
RSI Currently Below: Value the current RSI must be below to trigger a buy
RSI Divergence Lookback Period: # of candles used to lookback for lowest RSI in the divergence lookback period
RSI Lowest In Divergence Lookback Currently Below: Require the lowest RSI in the divergence lookback to be below this value
RSI Sell Above: If take profit or stop loss is not hit, the position will sell when RSI rises above this value
Minimum SRSI Downtrend Length: Require that the downtrend length of the SRSI be this value or higher to trigger a buy
Smoothed RSI Currently Below: Value the current SRSI must be below to trigger a buy
Hull Moving Average (HMA)

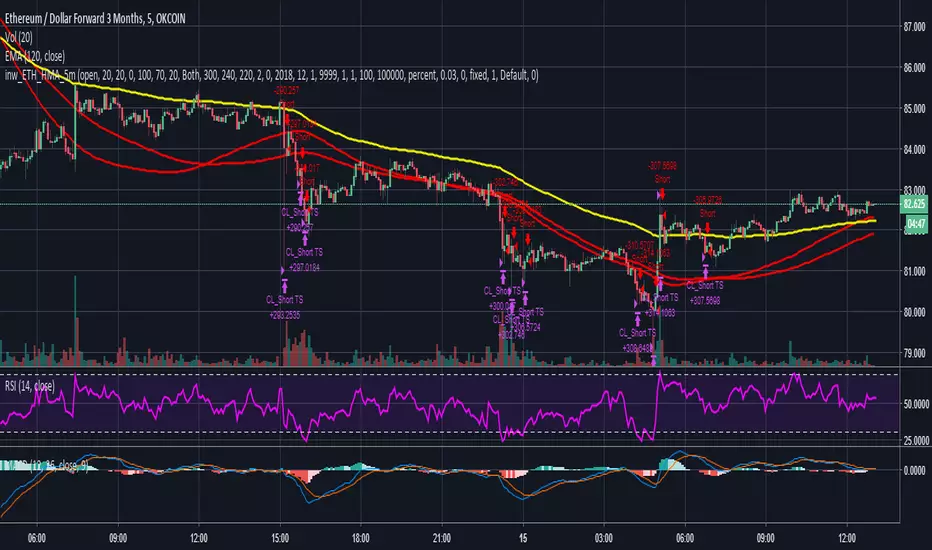
Simple EMA_Hull_RSI StrategyAnother simple strategy. Crossing EMA & Hull MA and the level of RSI (overbought/oversold) defines long or short.
Can be improved by varying the parameters and adding take profit / stop loss.
Backtest: ETHUSD (Bitmex): 5m

Scripting Tutorial 9 - TManyMA Strategy - Long Market Order OnlyThis script is for a triple moving average strategy where the user can select from different types of moving averages, price sources, lookback periods and resolutions.
Features:
- 3 Moving Averages with variable MA types, periods, price sources, resolutions and the ability to disable each individually
- Crossovers are plotted on the chart with detailed information regarding the crossover (Ex: 50 SMA crossed over 200 SMA )
- Forecasting available for all three MAs. MA values are forecasted 5 values out and plotted as if a continuation to the MA.
- Forecast bias also applies to all forecasting. Bias means we can forecast based on an anticipated bullish, bearish or neutral direction in the market.
- To understand bias, please read the source code, or if you can't read the code just send me a message on here or Twitter. Twitter should be linked to my profile.
- Ribbons added and on by default. Optional setting to disable the ribbons. 5 ribbons between MA1 and MA2 and another 5 between MA2 and MA3.
- Ribbons are alpha-color coded based on their relation to their default MAs.
- Ribbons are only visible between MAs if the MAs being compared share the same Type, Resolution, and Source because there is no way to consolidate those three in a simple manner.
- Ribbon values are calculated based on calculated MA Periods between the MAs.
- Converted the existing study into a strategy
- Strategy only enters long positions with a market order when MA crossovers occur
- Strategy exits positions when crossunders occur
- Trades 100% of the equity with one order/position by default
- Ability to disable trading certain crosses with input checks
This script is meant as an educational script with well-formatted styling, and references for specific functions.
*** PLEASE NOTE - THIS STRATEGY IS MEANT FOR LEARNING PURPOSES. DEPENDING ON IT'S CONFIGURATION IT MAY OR MAY NOT BE USEFUL FOR ACTUAL TRADING. THE STRATEGY IS NOT FINANCIAL ADVICE ***

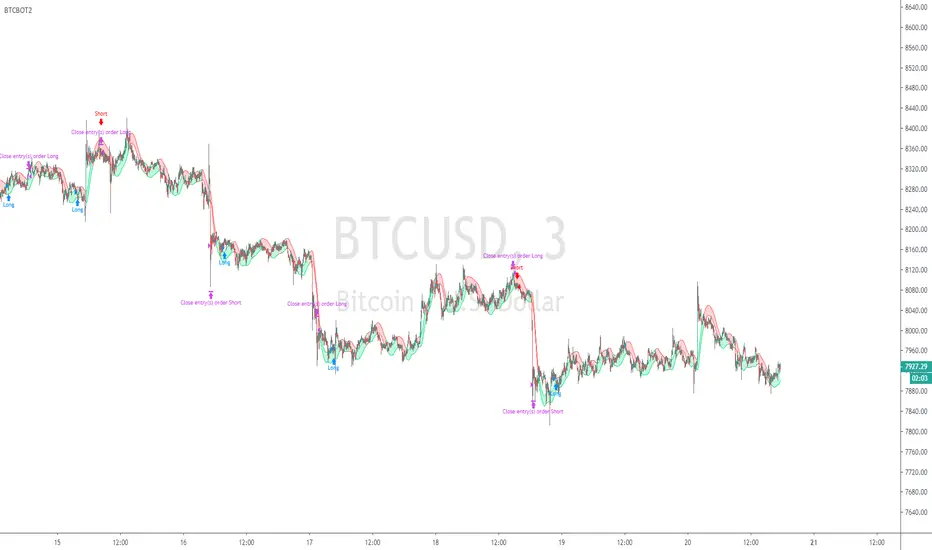
BTCBOT2Watches 3 Symbols with separate timeframe control, with Hull Moving Average crossovers on each, DXY XAU/USD BTC/USD
and a daily candle crossover. With StopLoss and Target Price and Backtesting history selection control. Entry and Exit rules visible in script (script open)
So if DXY chart is going down and Gold chart going up and Bitcoin chart going up then it will enter a buy, yes it is watching more than just bitcoin itself.
it needs HMA to match on all 3 charts and with selected timeframes, the timeframe of users chart, the timeframe in settings for the HMA's on the symbols. Also a Daily Candle chart of the users selected chart (symbol)


Double RSI Strategy(ALMA RSI + Hull RSI)We're back at it with a brand new strategy centered around an Arnaud Legoux RSI and Hull RSI. This one took a lot longer to make than usual, which is the reason there hasn't been any new posts the last week.
The first component of the strategy is the Hull RSI. The Hull RSI is shown in light blue and its upper and lower bounds are plotted as the dark pink and teal horizontal lines. Applying a Hull Moving Average to the RSI results in higher smoothness and less false signals. The lengths of the RSI and the HMA of the RSI can both be adjusted by the user.
We then used a similar process to calculate an Arnaud Legoux Moving Average(ALMA) of the RSI. The ALMA RSI is shown as the solid white line, while its upper and lower thresholds are the green and red horizontal lines. The ALMA RSI is a great tool since it is adaptable for multiple different uses - users can adjust the offset, sigma, and length values to modify the RSI's responsiveness and smoothness.
Input Options for ALMA RSI:
-Offset : Value in range {0,1} that adjusts the curve of the Gaussian Distribution. A higher value will result in higher responsiveness but lower smoothness. A lower value will mean higher smoothness but less responsiveness.
-Length : The lookback for each ALMA calculation.
-Sigma : Defines the sharpe of the curve coefficients.
The entry and exit signals generated by the Hull RSI are represented by the small green(buy) and red(sell) circles, while the green and red vertical highlights are the ALMA RSI's buy and sell signals. By default, we set the pyramiding to 3, with 50% equity used in each trade to allow the ALMA to make the longer-term swing trades and higher frequency trades made with the Hull RSI.
The strategy will be posted on our website, ProfitProgrammers.com, soon. As always, we will be offering 3 day trials for this strategy so feel free to send a quick message to start the trial period!

ck - CryptoSniper Longs Only (Strategy) v1Hey all,
This is a new script I have been working on and is in Beta testing stage.
It is best used for scalping 1/3/5/10/15 minutes.
Default settings are great for scalping, changing the “Period” will allow you to tweak for swing trades.
To use manually, you will get a Green triangle to alert you to be prepared to place an order.
This will happen 1 candle before the strategy paints an “open long” label on the chart.

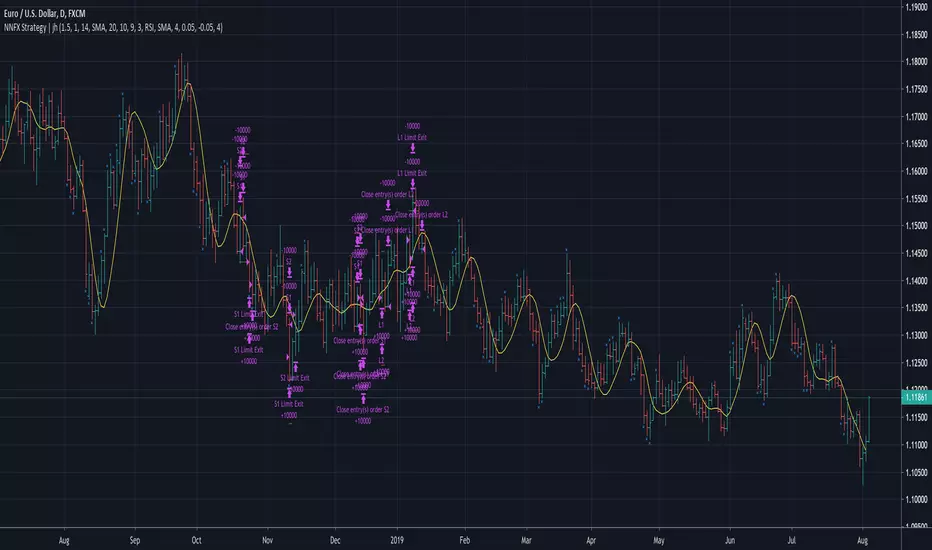
No Nonsense NNFX VP Strategy for Back Testing | jhMy first script, be kind :)
Most of the rules are implemented:
- Money management
- ATR, Baseline, Confirmation, Volume, Exit
More details below.
//////////////////////////////////////////////////////////////////////////////////////////////////////////////////////////////////
//////////////////////////////////////////////////////////////////////////////////////////////////////////////////////////////////
//Designed per No Nonsense Forex VP rules
//Made to be as modular as possible, so we can swap the indicators in and out.
//Originated from causecelebre
//Tried to put in as much VP rules as possible
///////////////////////////////////////////////////
//Rules Implemented:
///////////////////////////////////////////////////
// - SL 1.5 x ATR
// - TP 1 x ATR
//
// - Entry conditions
//// - Entry within 1 candles of baseline + 1 x confirmation + volume
//// - Entry only if baseline is < 1 x ATR
// - Exit conditions
//// - Exit on exit indicator or when baseline or confirmation flip
///////////////////////////////////////////////////
//Trades entries
///////////////////////////////////////////////////
// - First entry L1 or S1 with standard SL and TP
// - Second entry L2 or S2 with standard SL and exit upon the exit conditions
///////////////////////////////////////////////////
//Included Indicators and settings
///////////////////////////////////////////////////
// - Baseline = HMA 20
// - Confirmtion = SSL 10
// - Volume = TDFI 4
// - Exit = RVI 4
///////////////////////////////////////////////////
//Credits
// Strategy causecelebre
// TDFI causecelebre
// SSL Channel ErwinBeckers
//////////////////////////////////////////////////////////////////////////////////////////////////////////////////////////////////
//////////////////////////////////////////////////////////////////////////////////////////////////////////////////////////////////
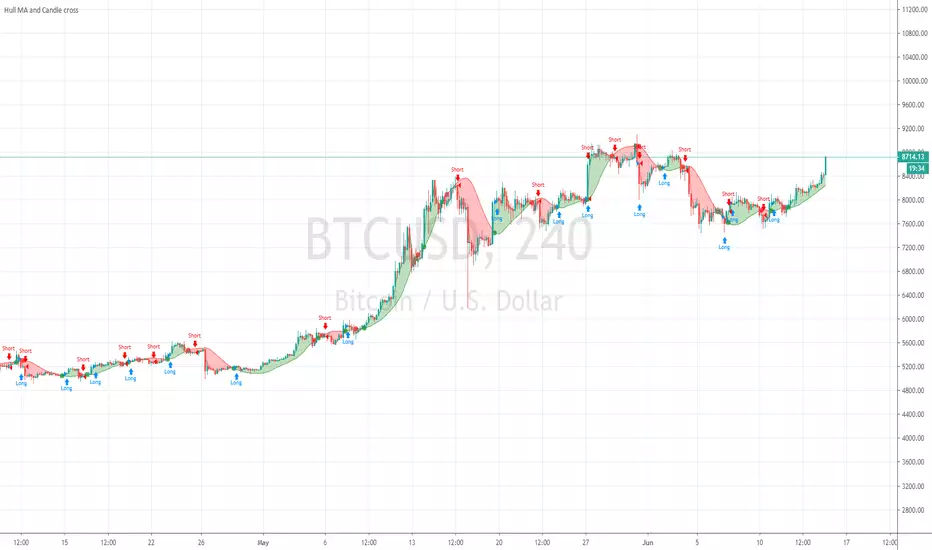
Hull MA and Candle crossHull MA vs price cossover . not 2 Hull MA's crossing, and also a price vs previous price crossover :
current price higher than previous = buy
current price lower than previous = sell
Price value set to OPEN to avoid repaint during candle
Legoux_MA<>Hull_MAArnaud Legoux MA > Hull MA
Long Hull period default, for use with low timeframe
probably not as good if a trading commision is applied etc
script open, help yourself :)

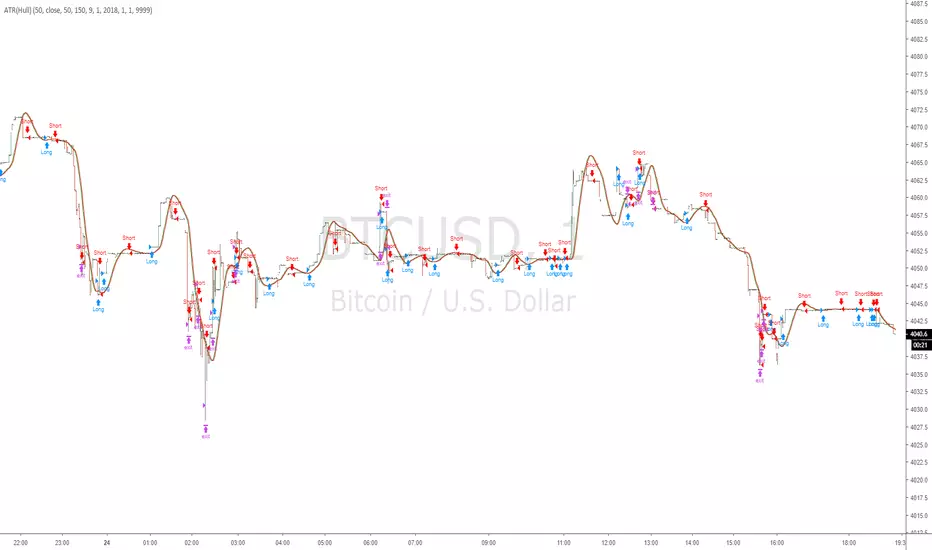
HMA_ATR_TSIA combination of signals trigger this strategy.
HMA crossovers (short period & long period) -Hull moving average-
ATR (smoothed with HMA) -Average true range-
TSI -True strength index-
The final close price is not known until right at the end of the bar.
This means that the indicator is constantly “repainting” during the bar.
You will see that indicators are constantly moving with each tick received
Use Open instead, the value is set and does not change even after refreshing the page.
An attempt to reduce repainting.

ATR smoothed by Hull MAThis is Average True Range indicator, but it is smoothed with Hull MA ( not WMA etc )
It is set to overlay the candles so looks different from normal ATR but i assure you it is ATR
Script open so you can see for yourself.
perhaps different settings are better,
Help me test it, and suggest improvements thankyou

RSI TSI StrategyRSI & TSI combination, with Hull MA for a center Line.
Order entry with either RSI TSI or Hull MA
Experimental strategy for possible use as bot
Hull MA & Pivot StrategyPivot points combined with HMA x2 crossover
(Hull moving average, 2 of them, if the price hits a pivot point in combination with the hull crossover being the same way, order entry)
Hull_TSI Strategy v420Hull and TSI combination.
experimenting with settings for 5 minute chart (default settings)
but can be use on any pair/timeframe

Commodity Channel Index with Hull MAExperimental strategy, try changing the settings etc
feedback welcome for any timeframe/pair profitable settings


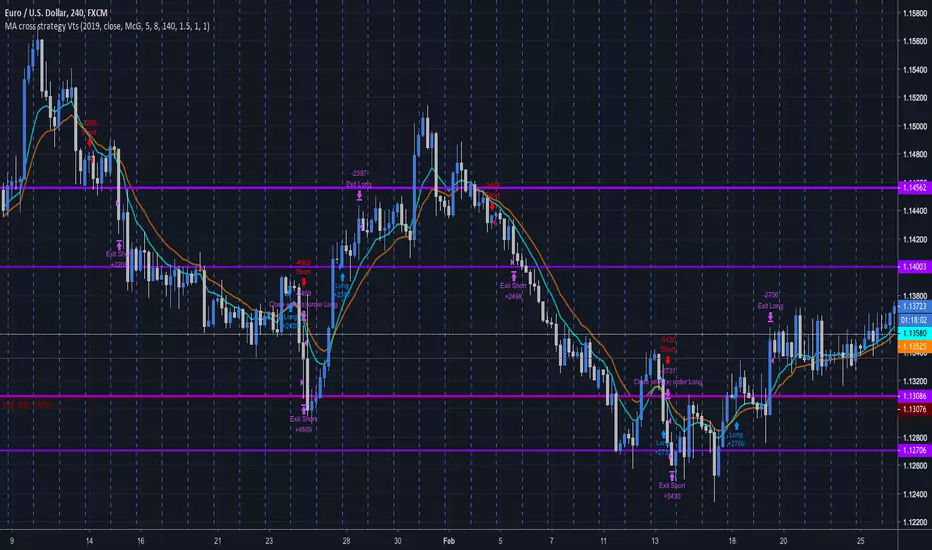
MA cross strategy VtsThe simple Moving average cross strategy is here implemented.
I guess there are multitudes of similar scripts around.
I post this one since I was asked by some friends, and I'll let it free to use for anybody.
Here you can choose the year where to start backtesting, the source, the type of MA, the SL and TP multiplicators of ATR, for which you can also choose the averaging period.
Feel free to modify this script. I would be grateful if you could preserve the first lines of comments including my user names.
The MA cross strategies can be very effective, especially when used on the daily TF.
Try for example the combo EMA15-EMA30 SL=1.5ATR TP=1ATR on EURCHF daily to get an impressive 83% win ratio.
Or EMA20-EMA81 on the GBPCHF to get an 87%.
In those cases where EMA does not perform well, try to set a less lagging MA, like the Hull MA.
I hope you like this script so that you could push the like button multiple (odd) times and you start following me.
I've got a bunch of other interesting scripts to share.
Comments and suggestions are welcome.
HMA EABy default, the strategy works best on 1h timeframe. In theory, it should run well on any timeframe, but you will absolutely need to adjust the Hull Resolution. I recommend starting with 4x the current view (aka, if you are using 5m candles, set the resolution to 20min, which is 4 * 5m).
The settings are pretty self explanatory:
Start Month - Month of the year to begin backtest (automatically beings at 1st of month)
Risk Per Trade (%) - How much of your equity to risk on each trade.
Leverage - Amount of buying power/Margin you have available
Loss (pips) - Distance in pips from the entry to place Stop Loss
Profit (pips) - Distance in pips from entry to place target Take Profit
Trigger Trail (%) - Distance in percentage from entry to begin a trailing Stop Loss
Trail Dist. (pips) - Offset distance of trailing Stop Loss
Hull Res. (min) - Length of candle in minutes to use when calculating the HMA
Hull Period (bars) - Smoothing period for HMA