(2) MoTrend VS-1150A great deal has been written about trend trading, simply because it’s a profitable trading technique, that simply works. The MoTrend indicator displays trending, momentum and stiffness to the trader guiding them to potential trend trading opportunities. MoTrend also contains a very sophisticated exit strategy, allowing the trader to ride the trend to its most profitable exit point.
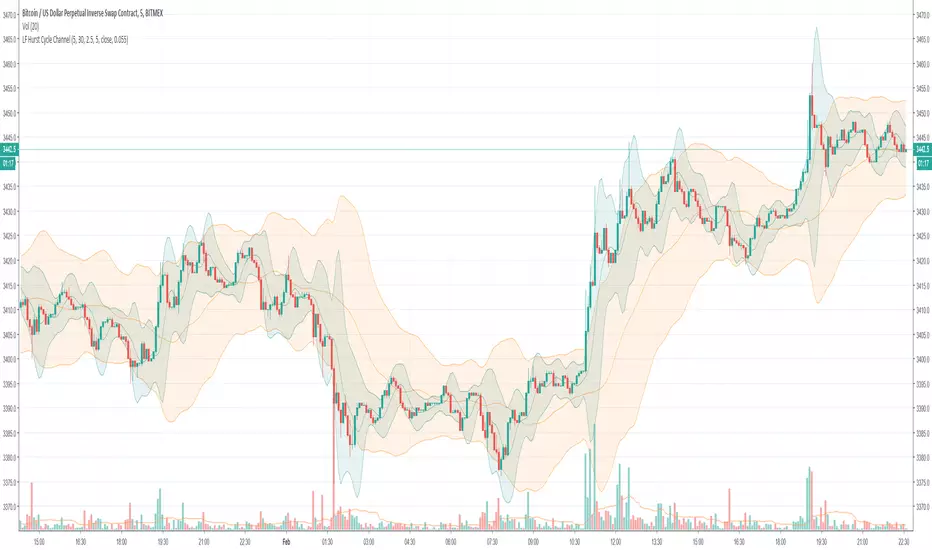
MoTrend was developed by determining when the Short-Term Hurst Channel(STHC) merge with the Long-Term Hurst Channel (LTHC). This event is flagged in two manors. First the STH channels blue line obscures the green or red lines of the LTH cycle channel. This triggers a change in the background color of your Cycles price chart to light green, as illustrated below, and in a change in color of the background of the MOTREND indicator to dark green on up-trends. These background colors shift to progressive shades of red when the trend is indicating down.
Because the MoTrend indicator was designed to work in concert with the Cycles indicator, the MoTrend signals are designed to progressively bleed into the Genie Cycles indicator. The two are not required to both be active on your screen at the same time, as each one is a free standing indicator working` completely independently of each other.
When the STH channel moves to the top of the LTH channel you are seeing the confirmed beginning of a positive trend. The MOTREND indicators most important asset is the ability to provide traders with a clear indications when, in all probability, the trend is coming to an end. This is accomplished by the magnetic effect of the STH channel. As long as the price range of the trades remain within the short-term channel, not exceeding the lower threshold of the bounding channel, the entire channel will remain attached to the top of the long-term channel. This magnetic effect of the short-term channel provides you with the ability to stay in your trade in the face of small, short-term reversals as long as those price changes don’t drag the STH channel lower. As soon as that occurs, your positive trend is demonstrating weakness and you should shift your trade evaluation to the stiffness histogram indicator show in the same indicator window.
The Stiffness indicator helps determine if you should continue in this trade after the Hurst cycles uncouples. The Stiffness indicator is simply counting the number of bars/days that your equity has remained above a specified moving average (MA) without penetrating that moving average. The indicator utilizes two adjustable variables, both a look-back or length for the moving average and a period of time or window that you are focused on. This is plotted as a series of columns plotted on two scales. Zero to 100 for uptrends (green columns) and 0 to -100 (red columns) for down trends. The period length provides the trader with a window of time that you want to determine if the price is penetrating the moving average you have set. The Stiffness indicator was described in the trading journal; Technical Analysis of Stocks and Commodities, by Markos Katsanos, Nov 25, 2018.
Finally, you can turn on a price line that is recalculated to become constrained within the parameters of the MoTrend indicators -100 to +100 range. This provides the trader the ability to see the relationship of price changes against the MoTrend and Stiffness indicators all in one indicator pane, window.
Access this Genie indicator for your Tradingview account, through our web site. (Links Below) This will provide you with additional educational information and reference articles, videos, input and setting options and trading strategies this indicator excels in.
Hurst

(1) Genie Cycles VS-200The Genie Cycles indicator contains two primary components. The first generates the primary turning-point Entry/Exit signals based on a hybrid algorithms that utilize multiple moving filters and oscillators, all working in concert. The second is our version of Hurst Cycles allowing the trader to view the harmonic convergence of short and long cycles.
The turning-point signals are generated by two Center of Gravity Oscillators (COG) originally developed by John Ehlers and published in Technical Analysis of Stocks and Commodities in its May 2002 issue.
COG produces a moving filter that heavily weights the most extreme and most current values in the stream of data within the window of the indicator. COG excels at determining and indicating where, within a parabolic path, tipping or turning points have occurred. Two COG indicators, each one set to a different length and different inputs are incorporated. The output of these two COG filters are them put through another Ehler’s filter, the Pass Band; July 2016 issue of TAOSAC. A pass band filter has the unique ability of removing the higher and lower frequencies from the signal, leaving behind only the core signal. Here we are taking a longer COG period of (10) days, utilizing the candles body size as it’s input and then subtracting a short period of (7) days utilizing only the close of the day. The result is an emphasis on the extreme values, i.e., the maximum apex and the minimum vertex of each parabolic swing. Finally, the Arnaud Legoux Moving Average (ALMA) is utilized as smoothing a filter to slightly shift the weighting from the COG Pass band filter, in a selective and adjustable manor to more current bars, not the most current bar. This is desirable because COG dramatically emphasizes the most current candle or bar as well as large candles and strong deviations from within the moving average.
This provides the trader with excellent responsiveness within a very smooth output signal with very few artifacts or whipsaws, producing highly reliable trading signals that indicate optimal entry and exit points with a high level of accuracy and very little lag.
The primary principals of Hurst cycles are price moves in waves that exhibit cyclic attributes based on their time scales. Genie Cycles incorporates Hurst cycles theories, but utilizes only two nested Laguerre moving filters. Laguerre moving filters have significantly less lag than traditional moving averages. These moving filters take as there inputs the highest high and the lowest lows for the two adjustable periods. The point of the indicator is to determine when a short-term swing cycle harmonizes or aligns with a long-term cycle, i.e., determining when the tops and bottoms of these cycles align.
The resulting nested channels produce natural bounding boxes. This dramatically highlights likely support and resistance levels as they often occur at prior highs or lows that this indicator is drawing. Convergence of the different cycle lengths can indicate strong trends that make excellent trading opportunities. Decoupling of the cycles indicates the end of the trend.

Hurst Cycle Channel Clone %BA %B of lazy bears Hurst Cycle Channel Clone
Remember to thank him for his great scripts.
With this you can easily see when the close is above,below or in the short or medium cycle channel.

Laguerre Filtered Hurst Cycle Channel [rumpypumpydumpy]Experiment in using a Laguerre filter on Hurst Cycle Channels.
Default settings may not be a good price fit!
Increasing the gamma value increases the degree of smoothing from the laguerre filter :
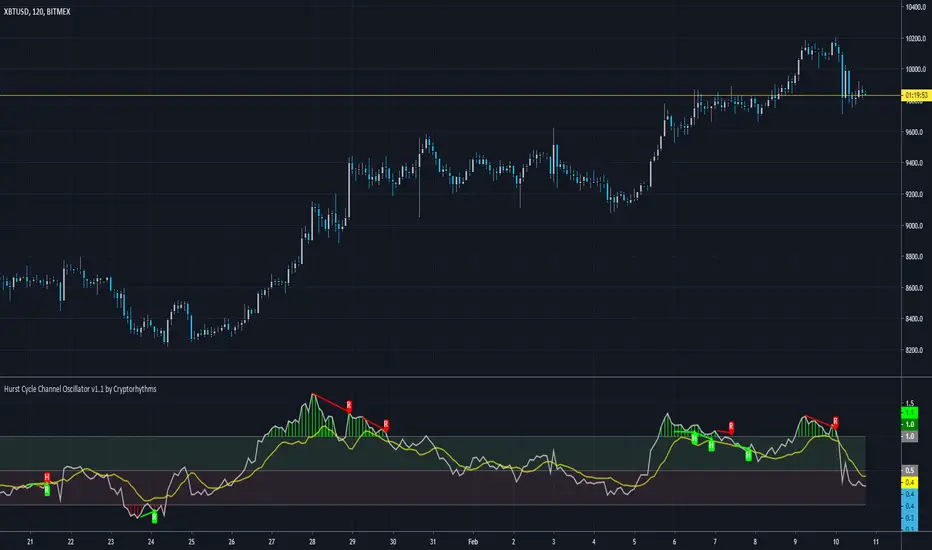
♒Hurst Cycle Channel Oscillator v1.0 by Cryptorhythms♒Hurst Cycle Channel Oscillator v1.0 by Cryptorhythms
👀 This one was not in the public library yet. Thanks to lazybear for the original Hurst Cycle Channel code, which was used to create this.
📜 Description
In the late 60's a NASA aerospace engineer J.M. Hurst published ‘The Profit Magic of Stock Transaction Timing’. Ironically, his book, by some considered the best book ever written about stock market cycles and swing trading, became available during the deepest and most extended Bear Market since the Great Depression. From 1972 on brokers couldn't give blue chip stock away in a Wall Street lunchroom. There was no market for a book by a stock market timer, and the book became a hidden treasure.
The Oscillator version of channel cycle was not on tradingview yet, so here you go, hope you all enjoy! The Hurst Channels and the Hurst Oscillator, be it combined or separate, can be implemented to uncover turning points in all time frames. Note that the Hurst Oscillator is basically just another presentation of the position of price in the Hurst Channel.
You can use it similar to an RSI looking for divergences. Also similar to a ema fast/short cross strategy when you use the signal line as entry/exit. You can also of course use the overbought/oversold zones as well.
Here is a screenshot with the example of bar coloration:
👍 Enjoying this indicator or find it useful? Please give me a like and follow! I post crypto analysis, price action strategies and free indicators regularly.
💬 Questions? Comments? Want to get access to an entire suite of proven trading indicators? Come visit us on telegram and chat, or just soak up some knowledge. We make timely posts about the market, news, and strategy everyday. Our community isn't open only to subscribers - everyone is welcome to join. t.me
HurstCycles PeaksOnly way I found to plot hurst cycles. I gave up on anything other than daily chart.
Published on request.
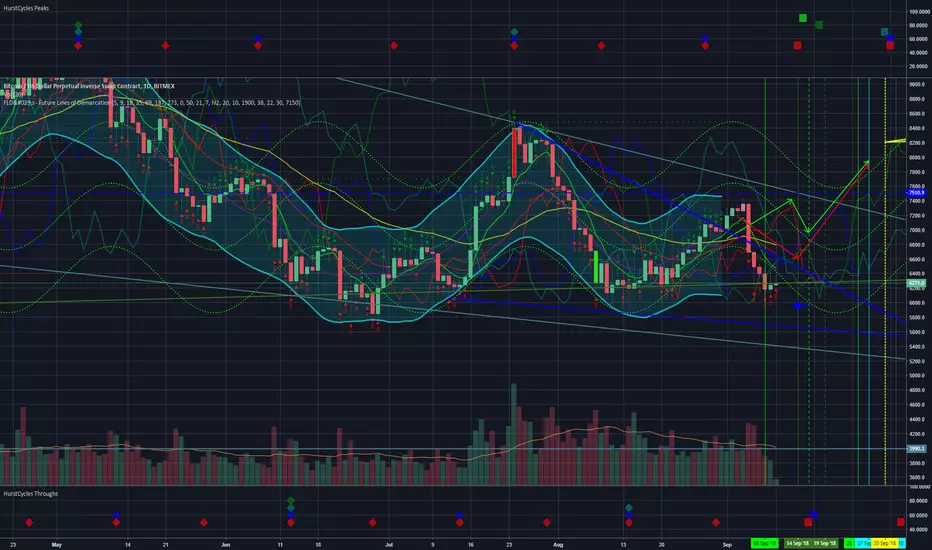
HurstCycles ThroughsOnly way I found to plot hurst cycles. I gave up on anything other than daily chart.
Published on request.

Hurst Exponent Market Phases [DW]This study is an experiment designed to identify market phases using changes in an approximate Hurst Exponent.
The exponent in this script is approximated using a simplified Rescaled Range method.
First, deviations are calculated for the specified period, then the specified period divided by 2, 4, 8, and 16.
Next, sums are taken of the deviations of each period, and the difference between the maximum and minimum sum gives the widest spread.
The rescaled range is calculated by dividing the widest spread by the standard deviation of price over the specified period.
The Hurst Exponent is then approximated by dividing log(rescaled range) by log(n).
The theory is that a system is persistent when the Hurst Exponent value is above 0.5, and antipersistent when the value is below 0.5.
The color scheme indicates 4 different phases I found to be significant in this formula:
- Stabilization Phase
- Destabilization Phase
- Chaos Increase Phase
- Chaos Decrease Phase
This script includes two visualization types to choose from:
- Bar Counter Mode, which displays the number of bars the exponent is consecutively in each phase.
- Hurst Approximation Mode, which displays the approximated exponent value.
Custom bar colors are included.
Please note: This is a rough estimate of the Hurst Exponent. It is not the actual exponent. Numerous approximations exist, and their results all differ slightly.

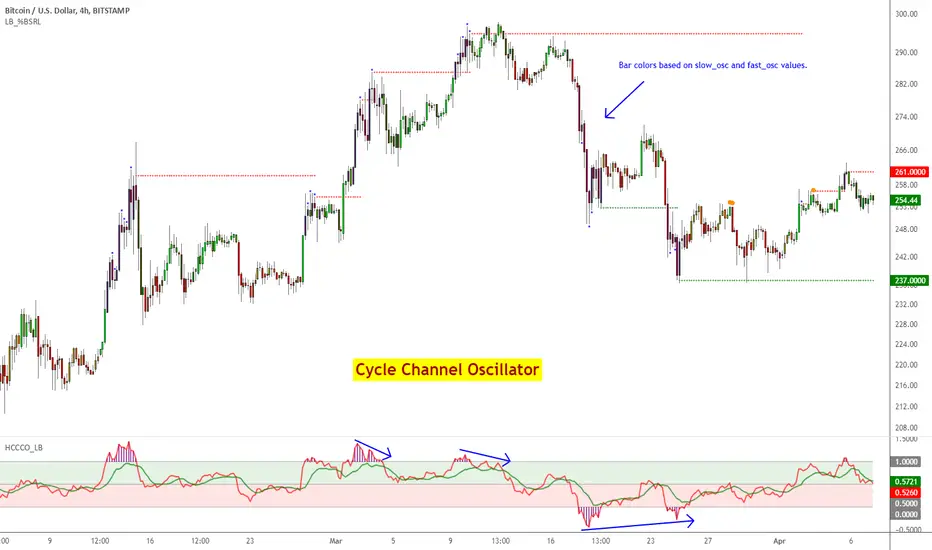
Cycle Channel Oscillator [LazyBear]Here's an oscillator derived from my previous script, Cycle Channel Clone ().
There are 2 oscillator plots - fast & slow. Fast plot shows the price location with in the medium term channel, while slow plot shows the location of short term midline of cycle channel with respect to medium term channel.
Usage of this is similar to %b oscillator. The slow plot can be considered as the signal line.
Bar colors can be enabled via options page. When short plot is above 1.0 or below 0, they are marked purple (both histo and the bar color) to highlight the extreme condition.
This makes use of the default 10/30 values of Cycle Channel, but may need tuning for your instrument.
More info:
List of my free indicators: bit.ly
List of my app-store indicators: blog.tradingview.com (More info: bit.ly)
Hurst Cycle Channel Clone [LazyBear]Cycle Channel is loosely based on Hurst's nested channels. Basic idea is to identify and highlight the shorter cycles, in the context of higher degree cycles.
This indicator plots the shorter term (red) & medium term (green) cycles as channels. Some things to note:
As you can see the red channel keeps moving with in the bounds of green channel. When green breaches red channel, it usually signifies extreme market condition.
Both red & green channels provide support/resistance levels. Also, the green channel provides S/R levels to the inner red channel.
Movement of red channel with reference to green highlights reversal points, reducing momentum et al. For ex., point "(x)" in the chart shows how red channel failed to reach the upper green channel line and highlighted the local top.
Use this just like other bands/channels. I have more indicators derived from this idea, will post them later.
Some more examples:
---------------------------------
MSFT 1M:
DXY 1M:
IWM 1M:
More info:
------------
cyclicwave.blogspot.com
List of my free indicators: bit.ly
List of my app-store indicators: blog.tradingview.com
(Support doc: bit.ly)

Indicators: Hurst Bands and Hurst OscillatorThese 2 indicators are derivative work from Jim Hurst's book - "The Magic of Stock Transaction Timing".
The bands are % bands around a median that gets calculated according to Hurst's formula. The outer bands (called ExtremeBands) signify extreme overbought/oversold conditions. Inner bands signify potential pullback points. As you can see, they also act as dynamic S/R levels.
The oscillator bands match the bands overlaid on price, so you will get an excellent indication of where the price is gonna do by using the oscillator along with the bands. Note that Hurst Oscillator can be used separately too, there is no technical dependency on Hurst Bands.
More info on Hurst Method:
www.readtheticker.com
