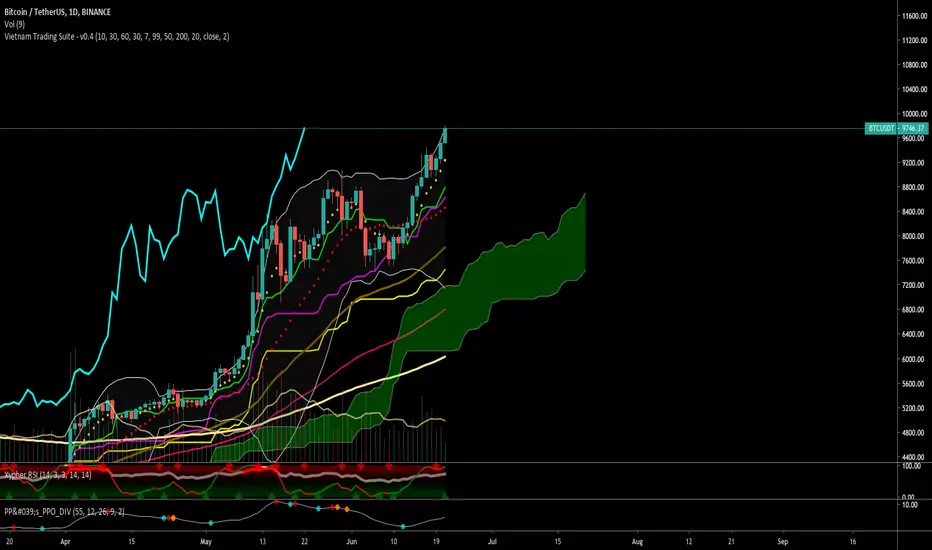
Vietnam Trading SuiteThis indicator helps the newcomers easily to approach trending analysis.
The following indicators added as default:
- Ichimouku (10/30/60/30)
- 5 EMA (9/20/30/50/200)
- Bollinger Bands
Awan Ichimoku

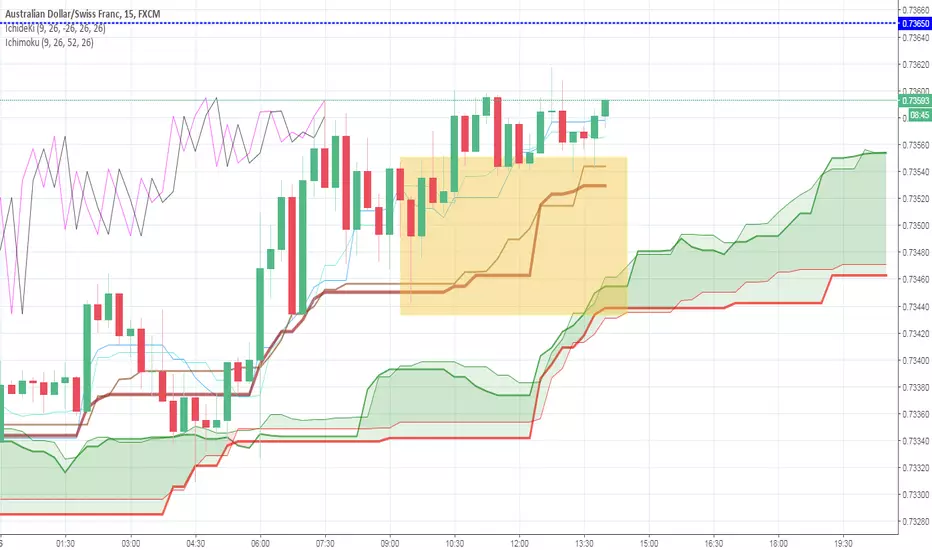
Ichimoku on closing price without current bar @bhutanoThis is the "Ichimoku" rivisited.
The current bar is not considerated on the plotting (so less chance to confusion) and the averages are calculated on the closing prices. It seems to be more precise then the original one.
Leave me a comment please based on your experience
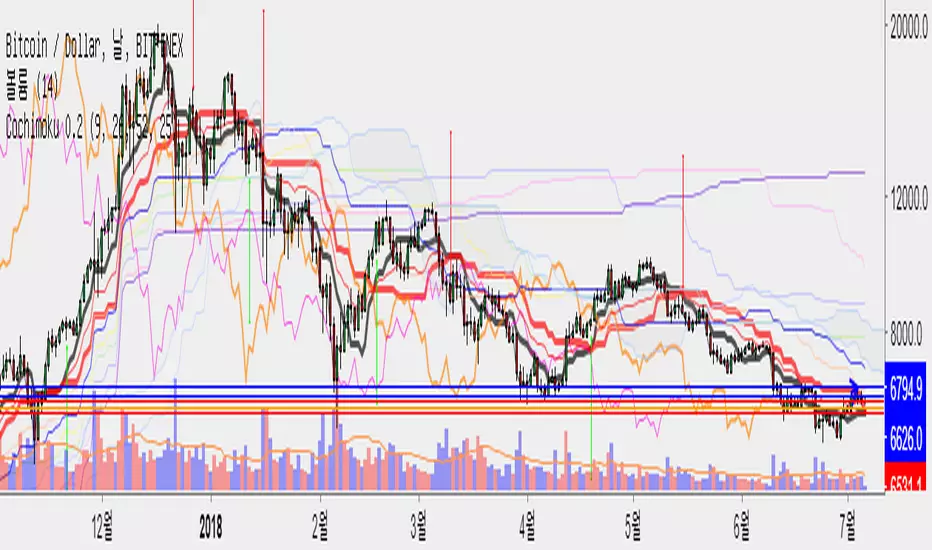
Covengers Ichimoku Cloud ver 0.2Ichimoku Cloud by SigmaJ in TEAM Coin Avenegers
ver 0.1 -> ver 0.2 Release !
Ver 0.2 updated.... like below...
+ Yumdung Momentum
Yumdung Momentum is based on Ichimoku Base Number Line
42 , 65 , 76, 129, 172 , 226
These Lines mean Resist / Support.
If There are many lines at one price, there could be STRONG Resist or Supprot Line.
-
코치모쿠 0.1 -> 0.2 버전 공개!
버전 0.2에는 다음과 같은 내용이 추가되었씁니다.
+ 윰멘텀 (윰둥이 모맨텀)
윰멘텀은 일목균형표에서 말하는 기본 수치에 대한 내용을 담고 있습니다.
기본 수치는 42, 65, 76, 129, 172, 226 입니다.
이 라인이 뭉쳐진 곳은 지지/저항의 역할을 할 가능성이 큽니다.
한 가격에 이 라인들이 뭉쳐있다면, 그곳은 강력한 지지 혹은 저항이 됩니다.
Flunki cloud multiplier Simple ichimoku cloud multiplier for working with different time frames
Example here is a 15 minute time frame chart with a x16 cloud multiplier, therefore, a 4hr ichimoku cloud plot on a 15m chart..
Enjoy - come and join me on OneX discord, learn, trade, profit : - discord.gg
*note - screenshot is default settings, you need to put 16 in the multiplier box to get the 4hr ichimoku cloud plot.
*also note - use 24 as a multiplier on the hourly chart to get the daily cloud

tvial/autoview-ha-ichimokuThis scripts leverages Heiken Hashi and Ichimoku signals.
Fully working with Autoview.

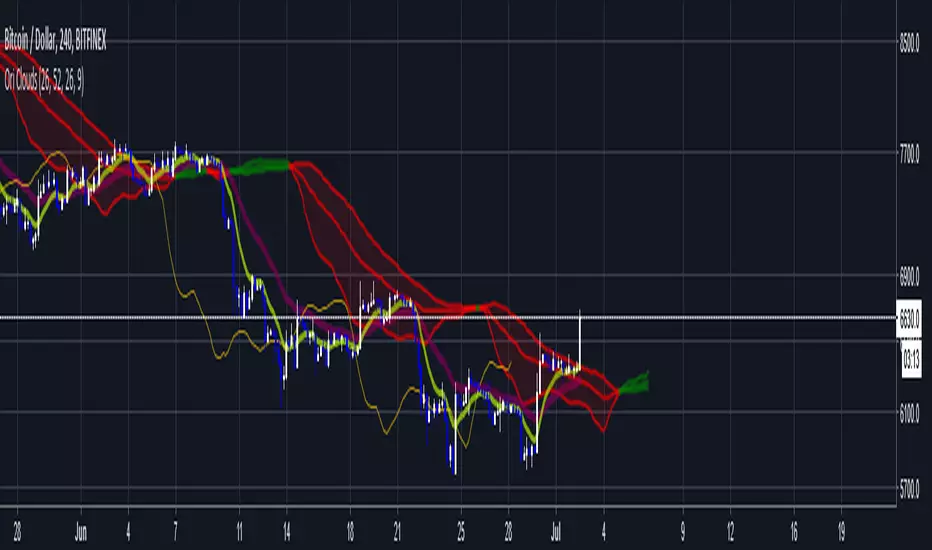
Ori Clouds (Better Ichimoku)Logic is similar to ichimoku . Last cloud color is also important for trend confirmation. Cloud lines important. There is a 3 line cloud which is different from ichimoku .
Logic is same but all calculations are different from ichimoku so be careful this is not the same indicator.
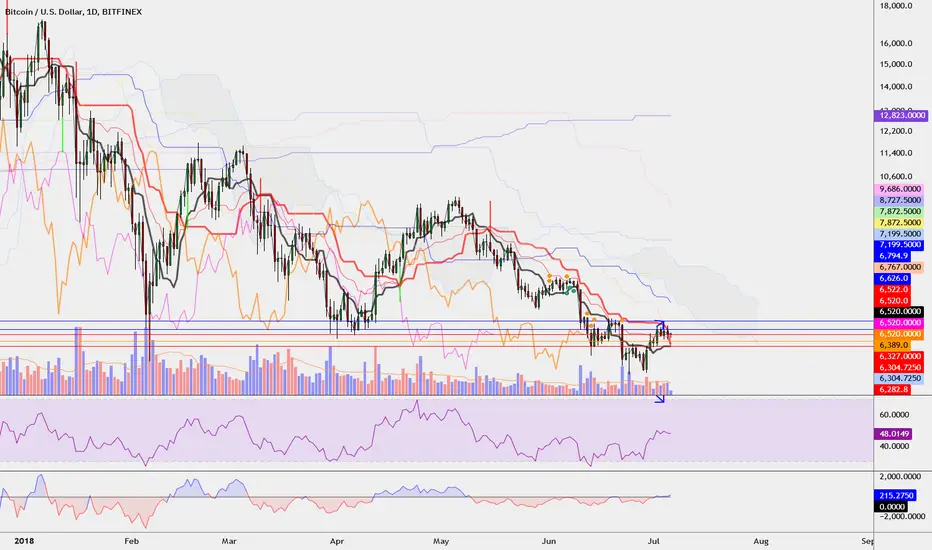
Here is classic Ichimoku for comparison

ICHIMOKU Kinko Hyo by KIVANC fr3762Created in 1940's by Goichi Hosoda withe the help of University students in Japan.
Ichimoku is one of the best trend following indicators that works nearly perfect in all markets and time frames.
Ichimoku is originally an built in indicator in Tradingview but there are some problems like:
the indicator hast 5 lines but you can change only 4 parameters in the settings menu of Tradingview Charts which you could only control 3 of the lines effectively. A second problem is that Tradingview preferred to use English titles for the ICHIMOKU lines instead of giving them the most common original Japanese ones. (So I rewrite the indicator)
Kijun Sen (blue line): Also called standard line or base line, this is calculated by averaging the highest high and the lowest low for the past 26 periods.
Tenkan Sen (red line): This is also known as the turning line and is derived by averaging the highest high and the lowest low for the past nine periods.
Chikou Span (Plum line): This is called the lagging line. It is today’s closing price plotted 26 periods behind.
Senkou SpanA (green line): The first Senkou line is calculated by averaging the Tenkan Sen and the Kijun Sen and plotted 26 periods ahead.
Senkou SpanB (purple line):
The second Senkou line is determined by averaging the highest high and the lowest low for the past 52 periods and plotted 26 periods ahead.
PERSONALLY I ADVISE YOU TO USE ICHIMOKU WITH DEAFULT LENGTHS (9,26,26,52,26) IN ORDER FOR STOCK MARKETS AND FOREX MARKETS
FOR CRYPTO YOU'D BETTER USE:
10,30,30,60,30 OR 20,60,60,120,60
THE TRICKY THING IS THAT KEEPING THE 1-3-3-6-3 RATIO CONSTANT IS NECESSARY
Here's a link of my Youtube video explaining ICHIMOKU but unfortunately only in TURKISH:
www.youtube.com
Developed by: Goichi Hosoda

OneX MultiCloudFree Indicator - Skeleton for OneX Scalping Indicator.
Simply has multiple configurations of popular Ichimoku Settings. If you want to add any to those, please drop a comment with the settings in question.
Current Features:
1. Can toggle between various Ichimoku settings
2. Can enable/disable Tenkan and Kijun in settings
3. Can enable/disable Lagging Span in settings
Advanced Features planned for integration with scalping indicator:
1. Can show buy and sell signals based off Ichimoku rules
2. Alerts
3. Enable all clouds simultaneously with different colors

TETSU style 2 Black II chobixautoMA3Lines & kumo & ts & tc River TETSU style 2 Black II chobix version

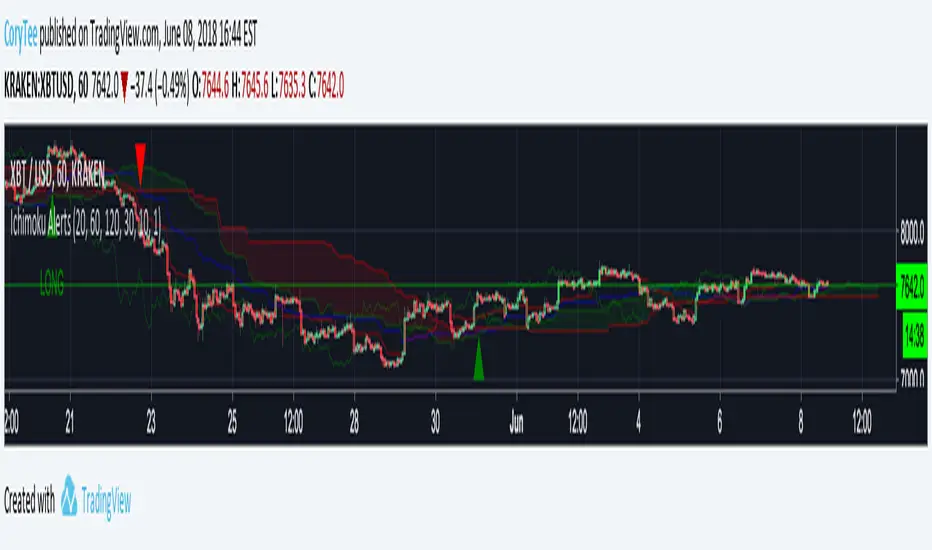
CoryT's Noro's Ichimoku AlertsA few months ago I took Noro's Ichimoku Cloud and used the AV bot template to throw stops on it. I took some code from JustUncleL
to make it not so hideous. Trailing Stops are turned off, stop losses are turned off (you really don't need them with this), and this is currently a Long/Short strategy, the Longs Only and Shorts Only options are broken right now, I'm tired and you guys can either fix it yourselves or deal with it like this for now.
Hint: If you wanna use this as a long-only strategy just have AV close your buy orders whenever a short is triggered.
Covengers Plumvis 0.1
Plumvis is helpful to Ichimoku based Trading.
Red Zone is BUY zone,
and Blue Zone is SELL zone.
However, ALL Red & Blue Zone aren't BUY & SELL zone.
It means "Change color" is important to Buy & SELL Signal.
Changing color time is Changing the trends of price.
Namely, Red zone is Downtrend of Price,
and Blue zone is Uptrend of Price.
It is really really useful to Ichimoku based Trading.
-
Plumvis는 일목균형표의 매매를 도와주는 지표입니다.
빨간색 영역은 매수 영역을
파란색 영역은 매도 영역을 나타냅니다.
그러나 무작정 매수와 매도를 진행할 수는 없습니다.
이 지표를 잘 관찰해보면,
색이 변경되는 영역은 대개 추세 전환의 변곡점이었던 경우가 많습니다.
이를 통해
현재 구역이 상승 추세인지, 매수를 결정해야하는지,
하락 추세인지, 매도를 결정해야하는지,
판단할 수 있습니다.

Covengers Ichimoku Cloud Easy 0.1
This is Covengers Ichimoku Cloud's EASY VERSION.
This is for you who don't know about Ichimoku,
to describe "Time tiktok & Price tiktok Trading".
☆Time tiktok & Price tiktok Trading☆
IF 1. DON'T CARE ABOUT LOWEST PRICE.
IF 2. DON'T CARD ABOUT HIGHER PRICE.
BUY IF 1. IS "CLOSE" BROKE THROUGH BASE LINE?
BUY IF 2. IS "CLOSE " SUPPORTED BY BASE LINE?
-> THEN BUY !
At this time, Base line should be STOP LOSS line.
SELL IF 1. IS "CLOSE" BROKE THROUGH BASE LINE?
SELL IF 2. IS "CLOSE" RESISTED BY BASE LINE?
SELL IF 3. IS "CLOSE" BROKE THROUGH ICHIMOKU CLOUD?
-> THEN SELL !
Buy conservatively, Sell aggressively.
"less LOSS" better than "much PROFIT"
-
Covengers Ichimoku Cloud의 EASY 버전입니다.
차트를 하나도 모르는 당신에게
임운자재를 설명하기 위해 만들었습니다.
☆임운자재 매매법☆
절대 조건 1. 바닥에는 관심을 두지 않는다.
절대 조건 2. 천장에는 관심을 두지 않는다.
매수 조건 1. 종가가 기준선을 돌파하였는가?
매수 조건 2. 종가가 기준선의 지지를 받는가?
-> 매수
이 때, 손절라인은 기준선이 된다.
매도 조건 1. 종가가 기준선을 돌파하였는가?
-> 매도
매도 조건 2. 종가가 기준선의 저항을 받는가?
-> 매도
매도 조건 3. 종가가 구름대를 돌파하였는가?
-> 매도
매수는 보수적으로, 매도는 공격적으로.
많이 따는 것보다, 잃지 않는 것이 중요하다.
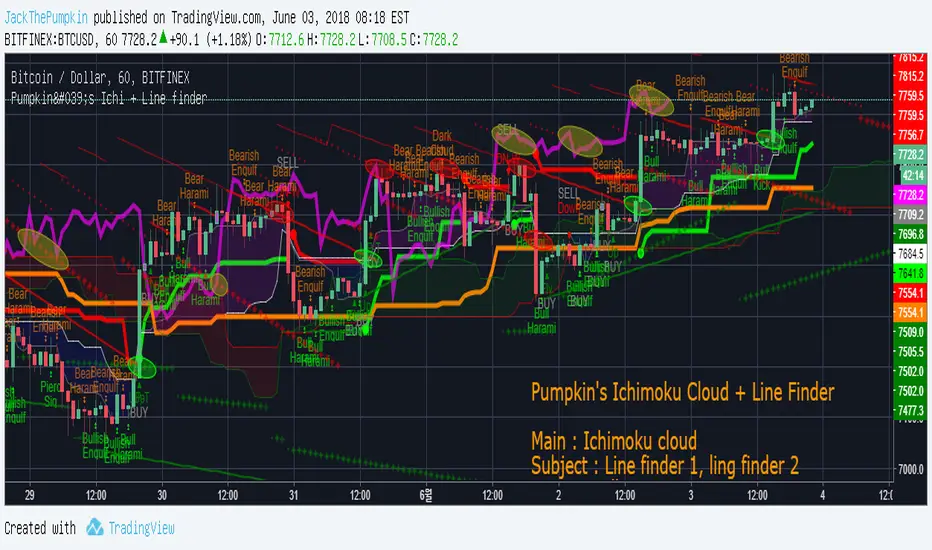
Pumpkin's Ichimoku Cloud & Line FinderMain : Ichimoku Cloud
- Tenkan-sen & Kijun-sen Cloud
- Senkou Span A & Senkou Span B Cloud
- Senkou Span A & Senkou Span B 2nd Cloud
Subject : Line Finder
- 1st : strong
- 2nd : weak
ETC
- Candle Pattern
- ATR line
reference :
1. Ichimoku Signal + Candle Color + Candle Pattern by calinh
2. Candlestick Patterns With EMA by rmwaddelljr
3. Trend Line Finder 9000 by spacetrader
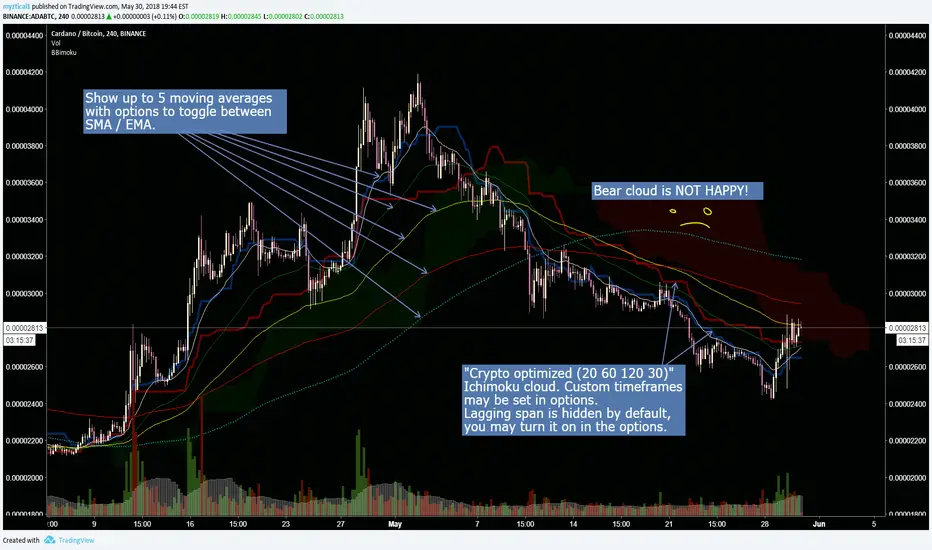
Crypto optimized Ichimoku and 5 variable SMA / EMAThis script has the option for showing up to 5 moving averages with options to toggle between SMA / EMA. Also includes crypto optimized Ichimoku cloud.
********This script was pieced together from various other's contributions from this site, and I cannot remember who the original authors are*******
Im just combining them to help others with free accounts and limited indicator availability like myself.
I hope this can help someone! Thank you and enjoy.


