Custom Time Range HighlightThis indicator highlights specific time ranges on your TradingView chart with customizable background colors and labels, making it easier to identify key trading sessions and ICT (Inner Circle Trader) Killzones. It is designed for traders who want to mark important market hours, such as major sessions (Asia, New York, London) or high-volatility Killzones, with full control over activation, timing, colors, and transparency.
Features
Customizable Time Ranges: Define up to 9 different time ranges, including one custom range, three major market sessions (Asia, New York, London), and five ICT Killzones (Asia, NY Open, NY Close, London Open, London Close).
Individual Activation: Enable or disable each time range independently via checkboxes in the settings. By default, only the ICT Killzones are active.
Custom Colors and Transparency: Set unique background and label colors for each range, with adjustable transparency for both.
Labeled Time Ranges: Each active range is marked with a customizable label at the start of the period, displayed above the chart for easy identification.
Priority Handling: If multiple ranges overlap, the range with the higher number (e.g., Asia Killzone over Custom Range) determines the background color.
CET Time Zone: Time ranges are based on Central European Time (CET, Europe/Vienna). Adjust the hours and minutes to match your trading needs.
Settings
The indicator settings are organized into three groups for clarity:
Custom Range: A flexible range (default: 15:30–18:00 CET) for user-defined periods.
Session - Asia, NY, London: Major market sessions (Asia: 01:00–10:00, New York: 14:00–23:00, London: 09:00–18:00 CET).
ICT Killzones - Asia, NY, London: High-volatility periods (NY Open: 13:00–16:00, NY Close: 20:00–23:00, London Open: 08:00–11:00, London Close: 16:00–18:00, Asia: 02:00–05:00 CET).
For each range, you can:
Toggle activation (default: only ICT Killzones enabled).
Adjust start and end times (hours and minutes).
Customize the label text.
Choose background and label colors with transparency levels (0–100).
How to Use
Add the indicator to your chart.
Open the settings to enable/disable specific ranges, adjust their times, or customize colors and labels.
The chart will highlight active time ranges with the selected background colors and display labels at the start of each range.
Use it to focus on key trading periods, such as ICT Killzones for high-probability setups or major sessions for market analysis.
Notes
Ensure your time ranges align with your trading instrument’s session times.
Overlapping ranges prioritize higher-numbered ranges (e.g., Asia Killzone overrides London Session).
Ideal for day traders, scalpers, or ICT strategy followers who need clear visual cues for specific market hours.
Feedback
If you have suggestions for improvements or need help with customization, feel free to leave a comment or contact the author!
Ict

HTF Power of Three+ Limitless by Supreme
HTF Power of Three+ Limitless by Supreme
This indicator provides a high fidelity lens into the market's fundamental fractal rhythm.
For the professional trader who understands every candle is a story of accumulation manipulation and distribution this tool transcends the limitations of linear time analysis.
It offers an institutional grade panoramic dashboard of the Power of Three archetype operating seamlessly across any timeframe without constraint.
The core limitation of standard chart analysis is the boundary between timeframes.
This tool dissolves these walls presenting a fluid four dimensional view of market dynamics directly on your chart.
It transforms your perception by offering a continuous unbroken context of the higher timeframe narrative that governs all lower timeframe price action.
This is not merely another visualization tool.
It is a complete solution to the problem of temporal dissonance that plagues most traders.
The standard chart presents a flat fragmented reality.
You are forced to switch between timeframes losing your place and breaking your cognitive flow.
This constant friction degrades the quality of analysis and leads to missed opportunities or flawed execution.
The market is a fractal an infinitely repeating pattern across all scales of time.
Lower timeframe price movements are not random events.
They are the direct consequence of the objectives being pursued on higher timeframes.
To trade without this higher timeframe context is to navigate a storm without a compass guided only by the immediate chaotic waves.
This indicator provides that compass.
The Power of Three is the narrative structure embedded within every candle.
This concept posits that smart money engineers price through a deliberate three phase process.
First is the accumulation phase.
This is a period of relative equilibrium typically around the opening price where large institutions quietly build their positions.
It is the balance before the imbalance the coiling of a spring.
Second is the manipulation phase.
This is the critical judas swing or stop hunt designed to engineer liquidity.
Price is intentionally driven against the true intended direction to trip stop loss orders from breakout traders and induce uninformed participants to take the wrong side of the market.
Their selling becomes the liquidity for institutions to buy at better prices and vice versa.
Third is the distribution phase.
This is the true expansion move where price travels rapidly in the direction of institutional intent.
This is the clean efficient price leg that most trend following systems attempt to capture often after the most advantageous entry point has passed.
Understanding this three part structure is the key to aligning your trades with smart money flow.
This tool makes that entire process visible.
The current live higher timeframe candle is projected onto your chart as it forms.
This is not a static snapshot but a living representation of the ongoing campaign.
Every tick on your lower timeframe chart now has context.
You can see precisely if price is in the initial accumulation phase giving you time to prepare.
You can identify the manipulation phase as it happens allowing you to avoid being trapped or to position yourself for the reversal.
You can confirm the beginning of the distribution phase providing the confidence to engage with the true market move.
The indicator also displays the three previously completed higher timeframe candles.
This is not just historical data.
It is the immediate narrative context.
These three candles reveal the established order flow and the key price levels that matter.
The highs and lows of these candles are not arbitrary points.
They are institutional reference points magnets for liquidity and critical levels for targeting or invalidation.
A manipulation move will often seek the high or low of the previous candle before reversing.
The expansion move will often target the liquidity resting beyond a high or low from two candles prior.
This four candle panoramic view allows for sophisticated narrative construction.
You can build a high probability thesis for the trading session based on the interrelationship of these candles.
For example after a series of strong bullish higher timeframe closes a brief manipulative dip below the prior candle's open becomes a very high probability long entry.
Conversely a failure to expand above the previous candle's high after a strong run may signal exhaustion and an impending reversal.
The tool's architecture is built on a state of the art non redrawing framework.
All visual elements are created once and only their parameters are updated.
This eliminates redraw lag entirely ensuring a fluid instantaneous and seamless experience.
Your analytical environment will remain sharp responsive and completely unburdened even during extreme market volatility.
The engine is unbound by time.
Its logic is perfectly fractal.
A scalper on a one minute chart using a fifteen minute context gains the same clarity and follows the same principles as a swing trader on a daily chart using a weekly context.
The pattern is universal.
This tool makes its application universally accessible.
This is for the trader who is no longer satisfied with looking at the market through a keyhole.
It is for the analyst who demands a complete limitless and flawlessly performing view of the price delivery process.
-
By installing this indicator you move from a fragmented view of price to a holistic four dimensional understanding of the market.
You achieve temporal coherence seeing the cause on the higher timeframe and the effect on the lower timeframe as a single unified process.
You begin to operate without the constraints of conventional charting.

Multi TF - HTF→LTF OrderblocksMulti TF — HTF→LTF Orderblocks
Identify higher-timeframe (HTF) order blocks and project them onto your lower-timeframe (LTF) chart—clean, fast, and publication-ready.
The script automatically detects swing breaks on your chosen HTF, builds the originating order block, and renders that zone on your current chart so you can execute on lower timeframes with higher-timeframe context.
--------------------
How it works
HTF swing structure is tracked via pivot highs/lows and a user-selected break confirmation (Close or Wick).
On a valid break, the script backtracks to the last opposite candle and creates the HTF order block (wick-to-wick or body-only depending on your setting).
The OB is projected to the LTF and extended bar-by-bar until:
Mitigation: price penetrates at least 50% of the zone → the box is marked “old” (dimmed) or optionally auto-deleted.
Close-break: price closes beyond the far edge → zone is optionally removed immediately.
Each zone includes a centerline and an inside label showing the original HTF (e.g., “M15”, “H1”).
Key features
True HTF→LTF overlay: trade M1/M5 with M15/H1/H4 context.
Mitigation logic (≥50%): first meaningful touch turns the zone “old” or deletes it (your choice).
Close-break handling: auto-remove zones broken by close, to keep charts clean.
Overlap control: choose how to handle overlapping zones on the same side:
Keep Latest, Union (merge), or Intersection (refine).
Wicks vs. Bodies: build zones from full candle range or just the body.
Lightweight UI: only the relevant inputs in the panel; sensible defaults.
Alert included: fires on the first 50% mitigation of any fresh zone.
Performance-friendly limits: cap the number of active zones to fit Pine limits.
Inputs (quick overview)
HTF for Order Blocks: timeframe to scan (e.g., 15, 60, 240, D).
Swing Length (Pivot L/R): pivot sensitivity for structure.
Break Confirmation: Close (recommended) or Wick.
Zones use Wicks: on/off for wick-to-wick zones.
OB Lookback before Break: how far to search for the opposite candle.
Max Active Zones: hard cap for chart cleanliness & performance.
Delete on Close-Break: remove zones that are invalidated by a close.
Delete after Mitigation: remove once a 50% touch occurs.
Handle Overlap: None, Keep Latest, Union (merge), Intersection (refine).
Colors & Border: fresh/old zone colors (default ~35% opacity) and optional borders.
Default profile (as shipped):
Break by Close, zones use wicks, Union overlap handling, 250 lookback, 250 max zones, borders off, and HTF label printed inside each zone.
How to use (suggested workflow)
Pick an HTF (e.g., H1 for intraday) and drop to your execution TF (e.g., M5/M1).
Wait for price to tap ≥50% of a fresh OB → look for your LTF trigger (CHOCH, iFVG, PA).
Place SL beyond the zone (or beyond the LTF swing) and manage to your targets (e.g., 2R–3R or to the next HTF OB).
Keep charts clean by enabling Delete on Close-Break and (optionally) Delete after Mitigation.
Alerts
“OB: Zone berührt (Erstkontakt)” — triggers on the first ≥50% mitigation of any fresh zone.
Create additional TradingView alerts with this condition to get notified in real time.
Notes & limitations
Built with request.security(..., lookahead_off) to avoid future-bar peeking; zones only form after a confirmed HTF break.
As with all pattern-based tools, use alongside your risk management and a defined entry model.
Pine has strict limits on drawings; use Max Active Zones to balance coverage and performance.
Credits
Designed for traders who want HTF precision with LTF execution—a clean, opinionated OB overlay that focuses on what matters: fresh zones, first touch, and invalidation.
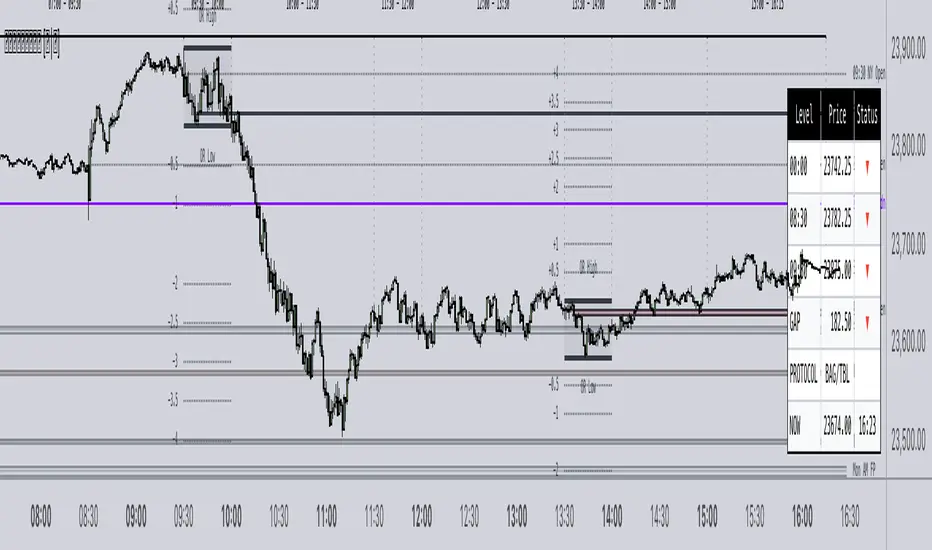
All in oneict trading session, silver bullet. perfect session of trading. help with timing to enter for max profit. also with high and low of previous day, week, month

𝙵𝚛𝚊𝚖𝚎𝚠𝚘𝚛𝚔|[𝙰|𝛺]This indicator was designed and coded by me, providing a clean and efficient adaptation of the teachings from Inner Circle Trading (ICT). The tool is intended to display various data points that help streamline and simplify your trading process. However, it does not generate signals or recommendations for trade execution.
It is designed to automatically display different components according to the timeframe you are analyzing. From the Hourly chart down to the seconds, you will be able to visualize a wide range of time-based data points in one indicator.
On the Hourly timeframe, the indicator begins with the Weekly Profile using the True Day . You will be able to visualize Monday’s price extended throughout the entire week, as well as each individual day of the week separately.
You can also visualize the equilibrium and quadrants of each individual day, if desired.
ICT 3-Day Protocol: This feature extends the highs and lows of the previous two days up to the current candle. These levels can serve as potential draws on liquidity or reference points for identifying opportunities on lower timeframes.
M15 Timeframe
On this timeframe, you will be able to visualize the previously mentioned elements, with the addition of the Asian and London sessions. These are included to help outline the potential intraday profile, as well as the highs and lows of these sessions, since they represent relevant data points.
You will also have the option to display projections of these ranges. These projections are useful for anticipating potential price manipulation and distribution levels, using Midnight Open as the reference point for the Daily PO3 .
You will also be able to visualize different Opens , including:
• 00:00
• 08:30
• 09:30
• 13:30
• Previous day’s Settlement Price
These levels represent relevant data points that can be used to frame implied discount or premium conditions relative to the Time of Day .
M1 and Seconds
On this timeframe, you will be able to see the previously mentioned elements, along with additional features.
Market Session Dividers: These are included to provide a clear and organized visual reference of which session the market is currently in, as well as the separation between one session and another.**
Opening Ranges: This feature allows you to visualize the Opening Range of the AM and PM sessions, along with their respective projections. You can also choose whether to extend these ranges over time or keep them limited to their formation period.
First Presentations: This feature allows you to visualize the initial imbalance of the Regular Trading Hours session, including both the AM and PM sessions.
Additionally, an option is included in the menu to indicate if the current day has high-impact news before the 09:30 open, allowing you to consider including the formation of the First Presented Gap from 09:29, as recommended by ICT.
You can also enable alerts to be notified each time a First Presentation is formed.
Table: This feature displays a table with the various Openings mentioned earlier. It shows the price and indicates whether the market is at a Discount or Premium relative to these levels using an arrow.
The table also displays the size of the Opening Range Gap and, with an arrow, indicates whether it is a Premium or Discount Gap.
It provides different possible protocols based on the gap size and other elements taught by ICT to help anticipate certain market scenarios.
Additionally, it shows the current time and changes the color of the time indicator depending on whether you are within a macro session or not. This keeps your chart clean while still allowing you to know if the market is in a macro session.
All elements of the indicator are customizable . You can personalize virtually every component to suit your preferences.
The Engineer.
Hopiplaka Goldbach System with SignalsThis tool builds a dynamic price framework around the current market using a PO3 range and a set of mathematically derived Goldbach levels. It then scores nearby levels for quality (reliability) and produces Buy/Sell signals only when multiple, independent factors line up (price level quality, trend/“Tesla Vortex” state, ICT AMD phase, time confluence, volume bias, and momentum). The goal is to identify high-confluence inflection points rather than constant signals.
Core Concepts & Why They’re Combined
1. PO3 Range Framework
Price is segmented into a primary range (lower → upper) determined by a configurable size (3× ladder: 3, 9, 27, …, 2187).
⦁ If price sits near a boundary (configurable sensitivity), the range can auto-expand to the next 3× size to better fit current volatility.
⦁ This gives a stable “map” of the active trading area and its boundaries.
2. Goldbach Levels (Pure Hopiplaka implementation)
For each even number ≤ your precision limit, the script evaluates all prime-sum partitions (Goldbach partitions) and converts their prime ratios into price levels inside the PO3 range.
⦁ Levels are classified as Premium / Standard / Discount based on properties of the prime pair and a mathematical weighting.
⦁ Strict minimum spacing rules (exact %, OB %, liquidity-void %) prevent clutter and keep only the most meaningful levels.
3. Tesla Vortex (trend/phase strength)
A volatility/trend-aware state machine estimates whether market is in MMxM (accumulation/mean-revert like) or TREND conditions and maps price interaction with high-quality levels to phases (e.g., Order Block Formation, Distribution).
⦁ This helps filter signals: buys favored in MMxM near supportive levels; sells favored in TREND near premium/liquidity levels, etc.
4. ICT Integration (AMD, IPDA bias hooks)
A lightweight AMD phase detector classifies the recent window into Accumulation / Manipulation / Distribution and marks market structure bias. This is used as confluence with level quality and trend state.
5. Time Confluence (Goldbach time)
Swing highs/lows are checked against Goldbach-valid timestamps (based on hour+minute sums decomposable into prime pairs). Repeated alignment adds time-bias confidence. When price and time align, level reliability is boosted.
6. Volume & Liquidity Context
A rolling volume baseline marks High/Low Volume Bias; levels can be volume-weighted (raising or lowering their reliability). Proximity to PO3 extremes flags pending liquidity sweeps.
Why this mashup?
The system blends price geometry (PO3 + Goldbach), state/trend (Tesla Vortex), market-microstructure (ICT AMD), time confluence, and volume/liquidity into one numerically scored signal. Each component answers a different question; together they reduce false positives and favor high-quality trades near meaningful levels.
What You’ll See on the Chart
⦁ PO3 Range Boundaries: two dashed lines (“lower” and “upper”). Auto-expand darkens the boundary style slightly.
⦁ Goldbach Levels: horizontal lines colored by classification and context:
⦁ Premium (strong premium band), Standard, Discount
⦁ OB (Order-Block candidate), LV (Liquidity Void)
⦁ TESLA node (trend/phase aligned)
⦁ Heavier width = higher reliability; dashed/dotted styles encode class differences.
⦁ PO3 Liquidity Boxes: narrow yellow shaded bands above/below each level (configurable pip distance).
⦁ Markers
⦁ ▲ Buy arrow below bar when a Buy signal triggers
⦁ ▼ Sell arrow above bar when a Sell signal triggers
⦁ ● Small dot when price touches a Goldbach level
⦁ Data-window plots:
⦁ Tesla Vortex Strength (numeric)
⦁ Time Bias (positive = bullish, negative = bearish)
⦁ Volume Bias (+1 high / −1 low)
⦁ Signal Strength (+ for buy / − for sell, zero when no signal)
⦁ Label Legend (on level tags)
⦁ TESLA – Tesla-aligned level node
⦁ OB – Order-block-quality zone
⦁ LV – Liquidity-void zone
⦁ Premium / Standard / Discount – Level class
⦁ Gxx – Even number used to build the level (Goldbach reference)
⦁ Reliability – Final score after time/volume/tesla weighting
⦁ Optional extras: Vol (relative volume weight), Time (time-confluence strength)
How Signals Are Generated
A signal is proposed when price comes within a minimum distance of a high-reliability level. It is then accepted only if enough of these independent checks pass (you control the required count):
1. Tesla Vortex state matches direction (e.g., MMxM with buy; TREND with sell).
2. ICT AMD phase aligns (Accumulation → buy bias; Distribution → sell bias).
3. Goldbach time bias supports the direction.
4. Volume bias supportive (high-volume context boosts conviction).
5. Level quality (TESLA node or Premium class) is high.
6. Momentum alignment (recent 2–3 bars in the same direction).
Only when confluence ≥ your threshold and confidence ≥ 0.5 (scaled by sensitivity) will a Buy/Sell arrow print. Cooldown prevents rapid repeats.
Inputs (key ones)
⦁ PO3 Settings: range size, auto-expansion toggle, expansion sensitivity, liquidity band distance.
⦁ Goldbach Mathematics: precision limit, exact spacing rules, spacing for OB/LV classes.
⦁ Trading Signals: master toggle, sensitivity, min reliability, confluence required, cooldown, min distance to level, markers on/off.
⦁ Tesla Vortex / ICT: enable Vortex, sensitivity; enable AMD/IPDA analysis and lookback.
⦁ Time & Volume: enable Goldbach time and weighting; volume lookback; liquidity-pool detection.
⦁ Display: show historical/future projections, number of future bars, labels, path/phase overlays.
⦁ Colors: full palette per class/context (premium/discount/OB/LV/Tesla/time/volume, buy/sell/goldbach hit).
Alerts Included
⦁ Signals: “BUY Signal Generated”, “SELL Signal Generated”
⦁ Level Interactions: “Goldbach Level Hit”; “Near Goldbach Level”; “Tesla Vortex Node”; “Premium Level Alert”
⦁ PO3: “PO3 Upper Break”, “PO3 Lower Break”, “PO3 Range Expansion”
⦁ State Changes: “Tesla Vortex Phase Change”
⦁ Context: “Liquidity Sweep Imminent”, “Strong Time Confluence”
You can wire these to webhooks or notifications.
Suggested Workflow
1. Choose PO3 size that matches your instrument’s volatility; keep Auto-Expansion ON initially.
2. Set confluence threshold (start at 3–4) and cooldown (e.g., 10 bars).
3. Keep Time and Volume modules ON for additional reliability weighting.
4. Use arrows as filters, not blind entries—confirm with your execution plan and risk rules.
5. Prefer signals near Premium/Discount TESLA nodes that also show time confluence and supportive volume.
Practical Notes & Limitations
⦁ The mathematical framework is deterministic, but market execution is not—always manage risk.
⦁ Future projections and heavy labeling can be resource-intensive; tune visibility if performance drops.
⦁ If a market is extremely illiquid or gap-prone, spacing/filters may hide many levels (by design).
Disclaimer
This script is for educational and research purposes only and is not financial advice. Trading involves risk. You are responsible for your own decisions.

High Probability Order Blocks [AlgoAlpha]🟠 OVERVIEW
This script detects and visualizes high-probability order blocks by combining a volatility-based z-score trigger with a statistical survival model inspired by Kaplan-Meier estimation. It builds and manages bullish and bearish order blocks dynamically on the chart, displays live survival probabilities per block, and plots optional rejection signals. What makes this tool unique is its use of historical mitigation behavior to estimate and plot how likely each zone is to persist, offering traders a probabilistic perspective on order block strength—something rarely seen in retail indicators.
🟠 CONCEPTS
Order blocks are regions of strong institutional interest, often marked by large imbalances between buying and selling. This script identifies those areas using z-score thresholds on directional distance (up or down candles), detecting statistically significant moves that signal potential smart money footprints. A bullish block is drawn when a strong up-move (zUp > 4) follows a down candle, and vice versa for bearish blocks. Over time, each block is evaluated: if price “mitigates” it (i.e., closes cleanly past the opposite side and confirmed with a 1 bar delay), it’s considered resolved and logged. These resolved blocks then inform a Kaplan-Meier-like survival curve, estimating the likelihood that future blocks of a given age will remain unbroken. The indicator then draws a probability curve for each side (bull/bear), updating it in real time.
🟠 FEATURES
Live label inside each block showing survival probability or “N.E.D.” if insufficient data.
Kaplan-Meier survival curves drawn directly on the chart to show estimated strength decay.
Rejection markers (▲ ▼) if price bounces cleanly off an active order block.
Alerts for zone creation and rejection signals, supporting rule-based trading workflows.
🟠 USAGE
Read the label inside each block for Age | Survival% (or N.E.D. if there aren’t enough samples yet); higher survival % suggests blocks of that age have historically lasted longer.
Use the right-side survival curves to gauge how probability decays with age for bull vs bear blocks, and align entries with the side showing stronger survival at current age.
Treat ▲ (bullish rejection) and ▼ (bearish rejection) as optional confluence when price tests a boundary and fails to break.
Turn on alerts for “Bullish Zone Created,” “Bearish Zone Created,” and rejection signals so you don’t need to watch constantly.
If your chart gets crowded, enable Prevent Overlap ; tune Max Box Age to your timeframe; and adjust KM Training Window / Minimum Samples to trade off responsiveness vs stability.

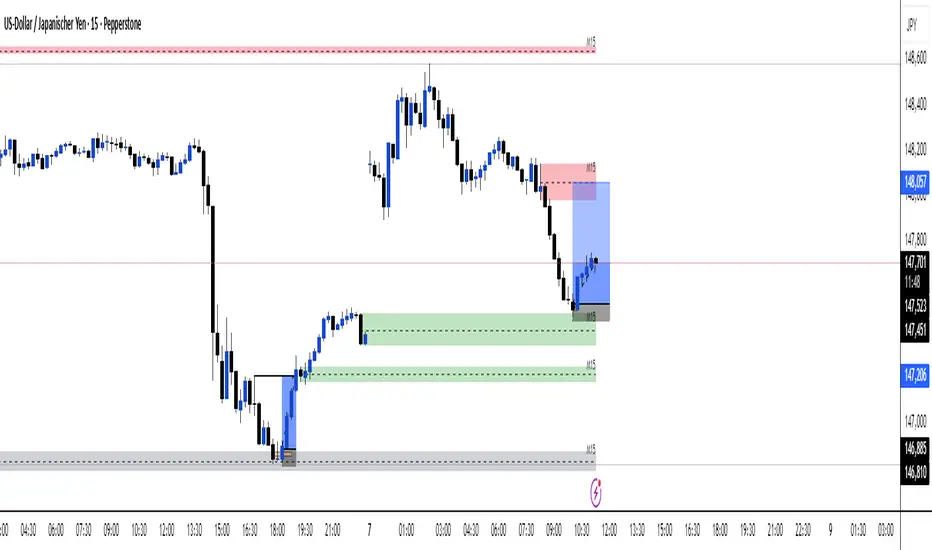
The Quasar Strategy Magic LevelsThis indicator plots key market levels that remain valid from 4:00pm New York close until the next day’s 4:00pm close.
The core logic combines:
A custom Goldbach-inspired range,
Circuit breaker percentages,
And hidden PO3 overlays.
These levels often act as magnets, targets, and later as support or resistance zones.
The central line of the whole range is what I call “the restaurant” — a strong attraction point where prices tend to gravitate, especially after the 9:30 a.m. opening.
Since these levels are based on a certain fixed price in a %, they will change over time. Then I will updated the indicator.
Use these levels as a confluence with your own trading strategy for entries and exits.

Valid Monthly LevelsValid Monthly Levels (No Sweeps) + Smart Labels
This tool automatically plots the highs and lows of each completed monthly candle and tracks their validity in real time. A level is considered valid until it has been swept (price trades strictly beyond that high or low). Once swept, the line and label can either be removed or dimmed depending on your settings.
Key features:
Monthly highs and lows: Each month’s range is marked with horizontal levels that extend forward.
Valid vs. swept logic: Levels are only valid until breached; swept levels can be hidden or kept as dotted/grey lines.
Smart labels: Each level is labeled with the month and year (e.g., Sep ’25 H/L). On higher timeframes, labels sit at the candle; on lower timeframes, labels automatically shift to the right edge so they don’t disappear off-screen.
Customizable appearance: Choose colors for highs, lows, and swept levels; adjust line styles; and limit how many past months are shown.
Clutter control: Cap the maximum number of labels, so your chart stays readable even on small intraday timeframes.
This indicator is useful for traders who track monthly supply/demand extremes, liquidity sweeps, and higher-timeframe context when executing on lower timeframes.

ICT FVG Buy/Sell SignalsThis bot is built on ICT (Inner Circle Trader) concepts such as:
Fair Value Gaps (FVGs) – imbalance zones between candles.
Consequent Encroachment (CE) – the midpoint of a gap.
Premium / Discount Arrays – dealing ranges split into premium (sell-side) and discount (buy-side) zones.
Displacement candles – strong impulsive moves that confirm intent.
The bot scans for FVGs, marks CE levels, and waits for price to return to these levels.
When price revisits a valid FVG zone with displacement confirmation and in the correct PD array, the bot generates a BUY or SELL signal.
✅ Signal Rules
Buy Signal
Price trades back into a Bullish FVG.
Current bar shows bullish displacement (large bullish body relative to ATR).
Price is in discount territory of the current dealing range (if PD filter is enabled).
Close is above the CE line of the FVG.
Sell Signal
Price trades back into a Bearish FVG.
Current bar shows bearish displacement.
Price is in premium territory of the current dealing range.
Close is below the CE line of the FVG.
🎯 What You’ll See on the Chart
Green “BUY” labels below candles when long signals trigger.
Red “SELL” labels above candles when short signals trigger.
Shaded background:
Red = Premium zone (sell side).
Teal = Discount zone (buy side).
Yellow line = dealing range midpoint (equilibrium).
Dots on CE lines = midpoints of the latest bullish/bearish FVG.
🔔 Alerts
ICT Buy → Triggers when a bullish setup confirms.
ICT Sell → Triggers when a bearish setup confirms.
You can connect these alerts to:
TradingView notifications.
Webhooks (for brokers or bots like MetaTrader, NinjaTrader, or Discord).
⚙️ Settings
Swing length – how many bars to use when detecting swing highs/lows for the dealing range.
Use PD filter – toggle ON/OFF for requiring discount/premium alignment.
Displacement ATR multiple – how strong the candle body must be compared to ATR to count as a displacement.
ATR length – used for displacement filter.
📈 Supported Markets
Works on all symbols and timeframes.
Commonly applied to:
NASDAQ (NQ, QQQ)
S&P500 (ES, SPX, SPY)
Forex pairs
Crypto (BTC, ETH, etc.)
⚠️ Disclaimer
This bot is for educational purposes only. It does not guarantee profits and should be tested on demo accounts first.
Always apply proper risk management before trading live.

ICT Sessions & Killzones +PRO (VinceFxBT)ICT Sessions & Killzones +PRO (VinceFxBT)
All in one Session and Killzone script for FX, Futures and Crypto markets. It includes London, New York, CBDR & Asia Sessions and Killzones.
Features
Includes London, New York, Asia, CBDR sessions
Includes all ICT Killzones
Extended session highs/lows up to 90s back, until mitigated.
Set recurring alerts for session highs and lows
Includes Indices price levels and opens
Uses UTC timezones with automatic Daylight Saving Time so NO timezone correction needed ; ) Works out of the box for all regions, including different dates of DST for US/EU.
Session highs/lows displayed on chart as lines, box or background color
Customize line styles, width and colors
Customize colors for Sessions and Killzones
Optionally include weekends for Session or Killzone separately
Optionally display day separators and labels
Fully control which options are displayed at higher or lower timeframes. (e.g. hide sessions when timeframe is 1h or higher)
Session display options
Session Background Color.
Session High & Low Lines, including Session Middle Line.
Extended session highs/lows until mitigated
Extended Session Highs & Lows until mitigated.
Session Background Color with extended Asia Session Highs & Lows until mitigated.
Set recurring alerts for session highs and lows
Set automatic alerts when previous and/or current session levels are broken.

SMC Analysis - Fair Value Gaps (Enhanced)SMC Analysis - Fair Value Gaps (Enhanced) Script Summary
Overview
The "SMC Analysis - Fair Value Gaps (Enhanced)" script, written in Pine Script (version 6), is a technical analysis indicator designed for TradingView to identify and visualize Fair Value Gaps (FVGs) on a price chart. It supports both the main timeframe and multiple higher timeframes (MTF) for comprehensive market analysis. FVGs are price gaps formed by a three-candle pattern, indicating potential areas of market inefficiency where price may return to fill the gap.
Key Features
FVG Detection:
Identifies bullish FVGs: Occur when the high of a candle two bars prior is lower than the low of the current candle, with the middle candle being bullish (close > open).
Identifies bearish FVGs: Occur when the low of a candle two bars prior is higher than the high of the current candle, with the middle candle being bearish (close < open).
Visualizes FVGs as colored boxes on the chart (green for bullish, red for bearish).
Mitigation Tracking:
Tracks when FVGs are touched (price overlaps the gap range) or mitigated (price fully closes the gap).
Strict Mode: Marks an FVG as mitigated when price touches the gap range.
Normal Mode: Requires a full breakthrough (price crossing the gap’s bottom for bullish FVGs or top for bearish FVGs) for mitigation.
Optionally converts FVG box borders to dashed lines and increases transparency when partially touched.
Multi-Timeframe (MTF) Support:
Analyzes FVGs on three user-defined higher timeframes (default: 15m, 60m, 240m).
Displays MTF FVGs with distinct labels and slightly more transparent colors.
Ensures no duplicate processing of MTF bars to maintain performance.
Customization Options:
FVG Length: Adjustable duration for how long FVGs are displayed (default: 20 bars).
Show/Hide FVGs: Toggle visibility for main timeframe and each MTF.
Color Customization: User-defined colors for bullish and bearish FVGs (default: green and red).
Display Options: Toggle for showing dashed lines after partial touches and strict mitigation mode.
Performance Optimization:
Limits the number of displayed boxes (50 for main timeframe, 20 per MTF) to prevent performance issues.
Automatically removes older boxes to maintain a clean chart.
Functionality
Visualization: Draws boxes around detected FVGs, with customizable colors and text labels ("FVG" for main timeframe, "FVG " for MTF).
Dynamic Updates: Extends or terminates FVG boxes based on mitigation status and user settings.
Efficient Storage: Uses arrays to manage FVG data (boxes, tops, bottoms, indices, mitigation status, and touch status) separately for main and MTF analyses.
Use Case
This indicator is designed for traders using Smart Money Concepts (SMC) to identify areas of market inefficiency (FVGs) for potential price reversals or continuations. The MTF support allows analysis across different timeframes, aiding in confirming trends or spotting higher-timeframe support/resistance zones.

Perfect Price-Anchored % Fib Grid This indicator generates support and resistance levels anchored to a fixed price of your choice.
You can also specify a percentage for the indicator to calculate potential highs and lows.
Commonly used values are 3.5% or 7%, as well as smaller decimal versions like 0.35% or 0.7%, depending on the volatility you expect.
In addition, the indicator can highlight potential stop-run levels in multiples of 27 — ranging from 0 up to 243. This automatically places the 243 GB range directly onto your chart.
The tool is versatile and can be applied not only to equities, but also to ES futures and Forex markets.

NWOG/NDOG by OutOfOptionsNew Week Opening Gap (NWOG) and New Day Opening Gap (NDOG)
NWOG and NDOG represent price imbalances formed when markets skip over certain levels at the start of a new week or trading day. These gaps often serve as magnets for price action throughout the week or day, drawing prices back to fill them while also functioning as key support or resistance zones. They are particularly relevant in futures markets, though less so in equities.
Consequent Encroachment (CE)
The CE, which is the midpoint of an NWOG or NDOG, frequently emerges as a critical level—especially if the gap remains unbalanced. In such cases, it can exert a strong pull on price, encouraging retracement or consolidation.
Indicator Features
This indicator allows you to display any number of NWOGs and NDOGs directly on your chart, with complete customization of their visual appearance. You can assign distinct colors to the most recent gaps for easy identification. Unlike other tools, it includes a filtering option to exclude minor gaps that may lack significance. Additionally, the "Smart" mode intelligently positions price labels to ensure they remain visible and uncluttered at all times.
How Does it Work
The indicator tracks all daily closes and new day opens, capturing the two values representing the top/bottom of NDOG/NWOG. I If the day begins on a Sunday, the gap is identified as NWOG; otherwise, it is classified as NDOG. A key feature of the indicator is that it avoids duplicating NDOGs that are also NWOGs.
Next, the indicator applies the size filter setting (if set above 0) to skip minor gaps. Valid gaps are then displayed on the screen using a style configured in the indicator settings for the most recent NDOG/NWOG.
To prevent the chart from becoming cluttered, the indicator limits the number of NWOG/NDOGs shown. When a new NWOG/NDOG is added, it checks the total displayed, and if this exceeds the configured limit, the oldest NWOG/NDOG is removed. Additionally, the indicator updates the display style of the previous NWOG/NDOG to the generic (non-last) style as specified in the settings.
For labels showing NWOG/NDOG price ranges and CE, the indicator offers a "Smart" option that dynamically positions labels 10 bars from the last candle and adjusts them every 5 candles. Otherwise, labels are placed at the end of the week for NWOGs and at the end of the following day for NDOGs.

Liquidity Sweep ReversalOverview
The Liquidity Sweep Reversal indicator is a sophisticated intraday trading tool designed to identify high-probability reversal opportunities after liquidity sweeps occur at key market levels. Based on Smart Money Concepts (SMC) and Institutional Order Flow analysis, this indicator helps traders catch market reversals when stop-loss clusters are hunted.
Key Features
🎯 Multi-Level Liquidity Analysis
Previous Day High/Low (PDH/PDL) detection
Previous Week High/Low (PWH/PWL) tracking
Session highs/lows for Asian, London, and New York markets
Real-time level validation and usage tracking
⚡ Advanced Signal Generation
CISD (Change In State of Delivery) detection algorithm
Engulfing pattern recognition at key levels
Liquidity sweep confirmation system
Directional bias filtering to avoid false signals
⏰ Kill Zone Integration
Pre-configured optimal trading windows
Asian Kill Zone (20:00-00:00 EST)
London Kill Zone (02:00-05:00 EST)
New York AM/PM Kill Zones (08:30-11:00 & 13:30-16:00 EST)
Optional kill zone-only trading mode
🛠 Customization Options
Multiple timezone support (NY, London, Tokyo, Shanghai, UTC)
Flexible HTF (Higher Time Frame) selection
Adjustable signal sensitivity
Visual customization for all levels and signals
Hide historical signals option for cleaner charts
How It Works
The indicator continuously monitors price action around key liquidity levels
When price sweeps liquidity (stop-loss hunting), it marks potential reversal zones
Confirmation signals are generated through CISD or engulfing patterns
Trade signals appear as arrows with color-coded candles for easy identification
Best Suited For
Intraday traders focusing on 1m to 15m timeframes
Smart Money Concepts (SMC) practitioners
Scalpers looking for high-probability reversal entries
Traders who understand liquidity and market structure
Usage Tips
Works best on liquid forex pairs and major indices
Combine with volume analysis for stronger confirmation
Use proper risk management - not all signals will be winners
Monitor higher timeframe bias for better accuracy
==============================================
日内流动性掠夺反向开单指标
指标简介
这是一款基于Smart Money概念(SMC)开发的高级日内交易指标,专门用于识别市场在关键价格水平扫除流动性后的反转机会。通过分析机构订单流和流动性分布,帮助交易者精准捕捉止损扫单后的市场反转点。
核心功能
多维度流动性分析
前日高低点(PDH/PDL)自动标记
前周高低点(PWH/PWL)动态跟踪
亚洲、伦敦、纽约三大交易时段高低点识别
关键位使用状态实时监控,避免重复信号
智能信号系统
CISD(Change In State of Delivery)算法检测
关键位吞没形态识别
流动性扫除确认机制
方向过滤系统,大幅降低虚假信号
黄金交易时段
内置Kill Zone时间窗口
支持亚洲、伦敦、纽约AM/PM四个黄金时段
可选择仅在Kill Zone内交易
时区智能切换,全球交易者适用
个性化设置
支持多时区切换(纽约/伦敦/东京/上海/UTC)
HTF周期自动适配或手动选择
信号灵敏度可调
所有图表元素均可自定义样式
历史信号隐藏功能,保持图表整洁
适用人群
日内短线交易者(1分钟-15分钟)
SMC交易体系践行者
追求高胜率反转入场的投机者
理解流动性和市场结构的专业交易者
使用建议
推荐用于主流加密货币、外汇对和股指期货
配合成交量分析效果更佳
严格止损,理性对待每个信号
关注更高时间框架的趋势方向
风险提示: 任何技术指标都不能保证100%准确,请结合自己的交易系统和风险管理使用。


Smart Money Footprint & Cost Basis Engine [AlgoPoint]Smart Money Footprint & Cost Basis Engine
This indicator is a comprehensive market analysis tool designed to identify the "footprints" of Smart Money (institutions, whales) and pinpoint high-probability reaction zones. Instead of relying on lagging averages, this engine analyzes the very structure of the market to find where large players have shown their hand.
How It Works: The Core Logic
The indicator operates on a multi-stage confirmation process to identify and validate Smart Money zones:
Smart Money Detection (The Trigger): The engine first scans the chart for signs of intense, urgent buying or selling. It does this by identifying Fair Value Gaps (FVGs) created by large, high-volume Displacement Candles. This is our initial Point of Interest (POI).
Cost Basis Calculation (The Average Price): Once a potential Smart Money move is detected, the indicator calculates the Volume-Weighted Average Price (VWAP) for that specific move. This gives us a highly accurate estimate of the average price at which the large players entered their positions.
Historical Confirmation (The "Memory"): This is the indicator's most unique feature. It checks its historical database to see if a similar Smart Money move (in the same direction) has occurred in the same price area in the past. If a match is found, the zone's significance is confirmed.
Verified Cost Basis Zone (The Final Output): A zone that passes all the above checks is drawn on the chart as a high-probability Verified Cost Basis Zone. These are the "memory zones" where the market is likely to react upon a re-visit.
How to Use This Indicator
Cost Basis Zones (The Boxes):
Green Boxes: Bullish zones where Smart Money likely accumulated positions. When the price returns here, a BUY reaction is expected.
Red Boxes: Bearish zones where Smart Money likely distributed positions. When the price returns here, a SELL reaction is expected.
Zone Strength (★★★): Each zone is created with a star rating. More stars indicate a higher-confidence zone (based on factors like volume intensity and historical confirmation).
BUY/SELL Signals: A signal is only generated when the price enters a zone AND the confirmation filters (if enabled in the settings) are passed.
Zone Statuses:
Green/Red: Active and waiting to be tested.
Gray: The zone has been tested, and a signal was produced.
Dark Gray (Invalidated): The zone was broken decisively and is no longer considered valid support/resistance.
Key Settings
Signal Accuracy Filters: You can enable/disable three powerful filters to balance signal quantity and quality:
Momentum Confirmation (Stoch): Waits for momentum to align with the zone's direction.
Candlestick Confirmation (Engulfing): Waits for a strong reversal candle inside the zone.
Lower Timeframe MSS Confirmation: The most advanced filter; waits for a trend shift on a lower timeframe before giving a signal.
Historical Confirmation:
Require Historical Confirmation: Toggle the "Memory" feature on/off. Turn it off to see all potential SM zones.
Tolerance Calculation Method: Choose between a dynamic ATR Multiplier (recommended for all-around use) or a fixed Percentage to define the zone size.

ORB FVG Strategy with telegram V6.1Summary
Intraday NY-session strategy with Opening-Range bias (09:30–10:00 NY), FVG entries (incl. optional HTF FVGs), momentum filters (LinReg slope & Williams %R), limit entries inside the zone, SL from FVG anchors, and TP via risk-reward. Includes session/trade caps, pending-order handling, auto-cancel at NY time, and optional Telegram webhook alerts.
Feature Overview
Opening Range & Bias: OR high/low built until 10:00 NY, then frozen. Bias from confirmed 5-minute candles (modes: Body Close, Complete Candle, Wick Only).
FVG Scanner: Bull/bear FVGs (choose wick or body gaps), min size, auto-extend, mitigation cleanup (touch or 50%).
HTF FVG (10 min): Optional – displayed after ≥ 2 consecutive FVGs; cleans up on touch/50%.
Entry/SL/TP: Entry at X% fill (+extra %) within the FVG; SL from FVG candle / FVG-1 / FVG-2 (smart) + buffer; TP via risk-reward.
Momentum Filters: LinReg slope (MLL) + Williams %R with threshold/slope filters (individually switchable).
Intrabar Mode (optional): Immediate Open/intrabar entry on touch (calc_on_every_tick=true) or classic bar-close confirmation (toggle).
Trade Management: Max trades/day, pending cap, auto-cancel at defined NY time, pause after first winner (optional).
Telegram: Programmatic alerts via alert() with Telegram-ready JSON payload.
Parameters (compact)
Group Parameter Purpose
Sessions Trading session, Opening range Trading/OR window (internal NY TZ)
Bias Body Close / Complete Candle / Wick Only Bias confirmation relative to OR
Liquidity LQ session, lookback days, cleanup points, show lines Intraday liquidity marks & cleanup
FVG Min size, wick/body, colors, extend, cleanup Detection/visualization & validity
HTF FVG (10 m) Toggle/Display/Colors Conservative HTF filter/POI
Entry Fill %, extra %, max pending, validity (bars), cancel time, intrabar switch Execution timing, order caps, auto-cancel
Stop Loss Source: Candle / -1 / -2 (smart), buffer (points) SL anchor from FVG history + safety offset
Take Profit Risk-Reward (R:R) Target calculation
Momentum LinReg length/min slope, W%R length/min slope, HUD Trend/momentum filters
Trade Mgmt Max trades/day, pause after win Daily cap / risk cooldown
Telegram Enabled, tester, interval, channel id Webhook output & test signals
Debug & Info Debug panel, rejection reasons On-chart status/diagnostics
Alerts / Telegram Webhook (Quick Setup)
Create an alert with Condition: “Any alert() function call”.
Webhook URL: api.telegram.org
Message: leave empty (the strategy provides JSON via alert() – includes chat_id, parse_mode, text).
Ensure your bot can post to the channel and the chat_id is valid.
Repainting & Backtesting
HTF series via lookahead_off on closed higher-TF candles; FVG detection on confirmed bars (barstate.isconfirmed).
Intrabar/Open entries allow earlier fills but typically cause differences between backtest and live (tick granularity/slippage, limit touch on bar OHLC).
For reproducibility, trade without intrabar (bar-close only).
Limitations
No full tick simulation; limit fills rely on bar OHLC.
Liquidity “cleanup” is rule-based (not an orderbook).
Telegram depends on correct webhook configuration.
Tips
Timeframes: M5 (intrabar)
Start with modest R:R (e.g., 1.5–2.0) and tune filters carefully.
Disclaimer
No financial advice. Past results do not guarantee future performance. Use responsibly and follow Public Library rules.
License / Credits
© 2025 Lean Trading (Lennart Pomreinke). License: MPL-2.0.
Changelog
V06.1: Intrabar switch (Open/intrabar vs bar-close), Telegram sanitizer & tester, HTF-FVG cleanup, refined pending/cancel logic, debug panel (status & rejections).

Liquidity Swing Points [BackQuant]Liquidity Swing Points
This tool marks recent swing highs and swing lows and turns them into persistent horizontal “liquidity” levels. These are places where resting orders often accumulate, such as stop losses above prior highs and below prior lows. The script detects confirmed pivots, records their prices, draws lines and labels, and manages their lifecycle on the chart so you can monitor potential sweep or breakout zones without manual redrawing.
What it plots
LQ-H at confirmed swing highs
LQ-L at confirmed swing lows
Horizontal levels that can optionally extend into the future
Timed removal of old levels to keep the chart clean
Each level stores its price, the bar where it was created, its type (high or low), plus a label and a line reference for efficient updates.
How it works
Pivot detection
A swing high is confirmed when the highest high has swing_length bars on both sides that are lower.
A swing low is confirmed when the lowest low has swing_length bars on both sides that are higher.
Pivots are only marked after they are confirmed, so they do not repaint.
Level creation
When a pivot confirms, the script records the price and the creation bar (offset by the right lookback).
A new line is plotted at that price, labeled LQ-H or LQ-L.
Rendering and extension
Levels can be drawn to the most recent bar only or extended to the right for forward reference.
Label size and line color/transparency are configurable.
Lifecycle management
On each confirmed bar, the script checks level age.
Levels older than a chosen bar count are removed automatically to reduce clutter.
How it can be used
Liquidity sweeps: Watch for price to probe beyond a level then close back inside. That behavior often signals a potential fade back into the prior range.
Breakout validation: If price pushes through a level and holds on closes, traders may treat that as continuation. Retests of the level from the other side can serve as structure checks.
Context for entries and exits: Use nearby LQ-H or LQ-L as reference for stop placement or partial-take zones, especially when other tools agree.
Multi-timeframe mapping: Plot swing points on higher timeframes, then drill down to time entries on lower timeframes as price interacts with those levels.
Why liquidity levels matter
Prior swing points are focal areas where many strategies set stops or pending orders. Price often revisits these zones, either to “sweep” resting liquidity before reversing, or to absorb it and trend. Marking these areas objectively helps frame scenarios like failed breaks, successful breakouts, and retests, and it reduces the subjectivity of eyeballing structure.
Settings to know
Swing Detection Length (swing_length), Controls sensitivity. Lower values find more local swings. Higher values find more significant ones.
Bars until removal (removeafter), Deletes levels after a fixed number of bars to prevent buildup.
Extend Levels Right (extend_levels), Keeps levels projected into the future for easier planning.
Label Size (label_size), Choose tiny to large for chart readability.
One color input controls both high and low levels with transparency for context.
Strengths
Objective marking of recent structure without hand drawing
No repaint after confirmation since pivots are locked once the right lookback completes
Lightweight and fast with simple lifecycle management
Clear visuals that integrate well with any price-action workflow
Practical tips
For scalping: use smaller swing_length to capture more granular liquidity. Keep removeafter short to avoid clutter.
For swing trading: increase swing_length so only more meaningful levels remain. Consider extending levels to the right for planning.
Combine with time-of-day filters, ATR for stop sizing, or a separate trend filter to bias trades taken at the levels.
Keep screenshots focused: one image showing a sweep and reversal, another showing a clean breakout and retest.
Limitations and notes
Levels appear after confirmation, so they are delayed by swing_length bars. This is by design to avoid repainting.
On very noisy or illiquid symbols, you may see many nearby levels. Increasing swing_length and shortening removeafter helps.
The script does not assess volume or session context. Consider pairing with volume or session tools if that is part of your process.

ICT AI ATR Signals [TradingFinder]🔵 Introduction
In financial markets, two main factors always have the greatest impact on traders’ decisions: the direction of the trend and the level of price volatility. Although there are various tools to analyze each of these factors, very few indicators can combine them in a coordinated and simultaneous way.
The ICT AI ATR indicator has been designed with this purpose in mind, to provide a unified and comprehensive view of the market instead of relying on multiple scattered indicators.
This indicator is built upon two widely used tools: the Moving Average (MA) and the Average True Range (ATR). The combination of these two indicators allows traders to simultaneously track the trend direction and account for market volatility two elements that always play a decisive role in trading decisions.
In the structure of the indicator, the Moving Average acts as the central line and serves as the backbone of the tool. By calculating the average price over a defined period, the Moving Average filters out excess market noise and provides a clearer picture of the overall price movement.
This helps traders focus on the main trend instead of being distracted by minor and temporary fluctuations. The central line is thus the main reference point for identifying the trend direction.
Alongside this, the ATR is responsible for measuring the real volatility of the market. Unlike many tools that only look at closing price changes, the ATR considers the true range of candlestick movements, giving a more accurate view of market dynamics.
In the ICT AI ATR indicator, this feature is used to draw dynamic bands above and below the Moving Average line. These bands shift with changing market conditions and act like dynamic support and resistance levels, areas where strong price reactions often occur.
This combination allows traders not only to see the dominant market trend through the Moving Average but also to understand volatility and the natural price range via the ATR. For this reason, the ICT AI ATR identifies points that are likely to act as reaction or reversal zones, whether during bounces off the bands or breakouts through them.
With this structure, the trader can at a glance :
Identify the overall market direction using the Moving Average.
Observe volatility and the natural range of price movement through ATR.
Recognize key levels where strong reactions or potential reversals are more likely.
As a result, the ICT AI ATR functions as a combined tool that replaces the need to use several separate indicators, enabling traders to analyze trend, volatility, price bands, and even Fibonacci targets within a single unified framework.
🔵 How to Use
The ICT AI ATR indicator is designed to simplify market analysis through two main components: visual display of bands and signals on the chart itself, and a multi-symbol analytical dashboard capable of monitoring over 20 different assets simultaneously across multiple timeframes.
This dashboard feature allows traders to gain a quick overview of overall market conditions without opening multiple charts or constantly switching timeframes. It updates in real-time, showing active Buy (Long) and Sell signals for each symbol.
As such, the combination of direct chart display and dashboard analytics makes the indicator useful both for detailed analysis of a single symbol and for monitoring multiple markets at once.
🟣 How do ICT AI ATR trading signals work?
Sell Signal (Short) : Triggered when the price pushes below the lower band (Low goes outside the lower band) and then closes back above it. This indicates potential weakness in bullish momentum and suggests possible selling pressure or the start of a downward correction. Traders can use this to spot sell setups or manage long positions.
Buy Signal (Long) : Triggered when the price extends above the upper band (High goes outside the upper band) and then closes back below it. This often signals exhaustion in bearish pressure and the return of buying strength, potentially marking the start of a new upward move.
This signaling logic is based on the actual behavior of price relative to the ATR dynamic bands. Unlike static formulas, signals adapt to changing market conditions, making them more accurate and reliable.
The main advantage of the ICT AI ATR indicator is that traders can benefit from real-time analysis directly on the chart by observing price interactions with the bands and signals while also receiving a multi-market overview through the dashboard. This combination is especially valuable for traders who operate across multiple instruments or markets simultaneously.
🔵 Settings
🟣 Logical settings
Moving Average Type : Select the type of moving average for the central line. Options include EMA, SMA, RMA, WMA, or HMA depending on the trading strategy.
Moving Average Period : Defines the length of the moving average. Shorter periods make the central line more responsive to price changes, while longer periods smooth out the line to show the broader trend.
ATR Period : Determines the number of candles considered for volatility calculation. Shorter periods increase sensitivity, while longer periods provide a more stable view of volatility.
ATR Multiplier : Sets the distance between the upper/lower bands and the central moving average line. Higher values widen the bands, while lower values bring them closer to price.
Smooth Period: Used to smooth data and reduce chart noise. Higher values produce smoother, more consistent indicator lines.
Signal Gap : Defines the minimum number of candles required between two consecutive signals. This prevents back-to-back signals from appearing too frequently and ensures only the more reliable ones are shown.
🟣 Display Settings
Table on Chart : Allows users to choose the position of the signal dashboard either directly on the chart or below it, depending on their layout preference.
Number of Symbols : Enables users to control how many symbols are displayed in the screener table, from 10 to 20, adjustable in increments of 2 symbols for flexible screening depth.
Table Mode : This setting offers two layout styles for the signal table :
Basic : Mode displays symbols in a single column, using more vertical space.
Extended : Mode arranges symbols in pairs side-by-side, optimizing screen space with a more compact view.
Table Size : Lets you adjust the table’s visual size with options such as: auto, tiny, small, normal, large, huge.
Table Position : Sets the screen location of the table. Choose from 9 possible positions, combining vertical (top, middle, bottom) and horizontal (left, center, right) alignments.
🟣 Symbol Settings
Each of the 10 symbol slots comes with a full set of customizable parameters :
Symbol : Define or select the asset (e.g., XAUUSD, BTCUSD, EURUSD, etc.).
Timeframe : Set your desired timeframe for each symbol (e.g., 15, 60, 240, 1D).
🟣 Alert Settings
Alert : Enables alerts for AAS.
Message Frequency : Determines the frequency of alerts. Options include 'All' (every function call), 'Once Per Bar' (first call within the bar), and 'Once Per Bar Close' (final script execution of the real-time bar). Default is 'Once per Bar'.
Show Alert Time by Time Zone : Configures the time zone for alert messages. Default is 'UTC'.
🔵 Conclusion
The ICT AI ATR indicator, by combining three core elements Moving Average for trend detection, ATR for volatility measurement and dynamic bands, and Fibonacci levels for price targets—provides a multi-layered and intelligent tool for market analysis. In addition to showing accurate bands directly on the chart, it also offers a multi-symbol dashboard that allows traders to monitor signals across different assets and timeframes in real time.
The key advantage of this indicator is that it eliminates the need to use several separate tools by integrating trend, volatility, key levels, and trade signals into one unified framework. For this reason, ICT AI ATR is a reliable and effective choice for both short-term traders seeking quick market moves and long-term traders focused on dynamic support and resistance levels.
Skrip berbayar

20/40/60Displays three consecutive, connected range boxes showing high/low price ranges for customizable periods. Boxes are positioned seamlessly with shared boundaries for continuous price action visualization.
Features
Three Connected Boxes: Red (most recent), Orange (middle), Green (earliest) periods
Customizable Positioning: Set range length and starting offset from current bar
Individual Styling: Custom colors, transparency, and border width for each box
Display Controls: Toggle borders, fills, and line visibility
Use Cases
Range Analysis: Compare volatility across time periods, spot breakouts
Support/Resistance: Use box boundaries as potential S/R levels
Market Structure: Visualize recent price development and trend patterns
Key Settings
Range Length: Bars per box (default: 20)
Starting Offset: Bars back from current to position boxes (default: 0)
Style Options: Colors, borders, and visibility controls for each box
Perfect for traders analyzing consecutive price ranges and comparing current conditions to recent historical periods.

ICT ULT
This indicator is for lazy people like me who want to automate the process of marking certain ICT key levels using the indicator's features, such as:
Custom Killzone/Session Liquidity Levels in form of Highs and Lows
Killzone Drawings (Boxes)
Previous Day High/Low (PDH/PDL)
Previous Day Equlibrium (PDEQ)
Previous Week High/Low
New Day/Week Opening Gaps (NDOG/NWOG)
Custom Opening Prices (horizontal) (e.g. Midnight Open)
Custom Timestamps (vertical)
*Note: All features are completely customizable
inspired by: @tradeforopp
Volumetric Support and Resistance [BackQuant]Volumetric Support and Resistance
What this is
This Overlay locates price levels where both structure and participation have been meaningful. It combines classical swing points with a volume filter, then manages those levels on the chart as price evolves. Each level carries:
• A reference price (support or resistance)
• An estimate of the volume that traded around that price
• A touch counter that updates when price retests it
• A visual box whose thickness is scaled by volatility
The result is a concise map of candidate support and resistance that is informed by both price location and how much trading occurred there.
How levels are built
Find structural pivots uses ta.pivothigh and ta.pivotlow with a user set sensitivity. Larger sensitivity looks for broader swings. Smaller sensitivity captures tighter turns.
Require meaningful volume computes an average volume over a lookback period and forms a volume ratio for the current bar. A pivot only becomes a level when the ratio is at least the volume significance multiplier.
Avoid clustering checks a minimum level distance (as a percent of price). If a candidate is too close to an existing level, it is skipped to keep the map readable.
Attach a volume strength to the level estimates volume strength by averaging the volume of recent bars whose high to low range spans that price. Levels with unusually high strength are flagged as high volume.
Store and draw levels are kept in an array with fields for price, type, volume, touches, creation bar, and a box handle. On the last bar, each level is drawn as a horizontal box centered at the price with a vertical thickness scaled by ATR. Borders are thicker when the level is marked high volume. Boxes can extend into the future.
How levels evolve over time
• Aging and pruning : levels are removed if they are too old relative to the lookback or if you exceed the maximum active levels.
• Break detection : a level can be removed when price closes through it by more than a break threshold set as a fraction of ATR. Toggle with Remove Broken Levels.
• Touches : when price approaches within the break threshold, the level’s touch counter increments.
Visual encoding
• Boxes : support boxes are green, resistance boxes are red. Box height uses an ATR based thickness so tolerance scales with volatility. Transparency is fixed in this version. Borders are thicker on high volume levels.
• Volume annotation : show the estimated volume inside the box or as a label at the right. If a level has more than one touch, a suffix like “(2x)” is appended.
• Extension : boxes can extend a fixed number of bars into the future and can be set to extend right.
• High volume bar tint : bars with volume above average × multiplier are tinted green if up and red if down.
Inputs at a glance
Core Settings
• Level Detection Sensitivity — pivot window for swing detection
• Volume Significance Multiplier — minimum volume ratio to accept a pivot
• Lookback Period — window for average volume and maintenance rules
Level Management
• Maximum Active Levels — cap on concurrently drawn levels
• Minimum Level Distance (%) — required spacing between level prices
Visual Settings
• Remove Broken Levels — drop a level once price closes decisively through it
• Show Volume Information on Levels — annotate volume and touches
• Extend Levels to Right — carry boxes forward
Enhanced Visual Settings
• Show Volume Text Inside Box — text placement option
• Volume Based Transparency and Volume Based Border Thickness — helper logic provided; current draw block fixes transparency and increases border width on high volume levels
Colors
• Separate colors for support, resistance, and their high volume variants
How it can be used
• Trade planning : use the most recent support and resistance as reference zones for entries, profit taking, or stop placement. ATR scaled thickness provides a practical buffer.
• Context for patterns : combine with breakouts, pullbacks, or candle patterns. A breakout through a high volume resistance carries more informational weight than one through a thin level.
• Prioritization : when multiple levels are nearby, prefer high volume or higher touch counts.
• Regime adaptation : widen sensitivity and increase minimum distance in fast regimes to avoid clutter. Tighten them in calm regimes to capture more granularity.
Why volume support and resistance is used in trading
Support and resistance relate to willingness to transact at certain prices. Volume measures participation. When many contracts change hands near a price:
• More market players hold inventory there, often creating responsive behavior on retests
• Order flow can concentrate again to defend or to exit
• Breaks can be cleaner as trapped inventory rebalances
Conditioning level detection on above average activity focuses attention on prices that mattered to more participants.
Alerts
• New Support Level Created
• New Resistance Level Created
• Level Touch Alert
• Level Break Alert
Strengths
• Dual filter of structure and participation, reducing trivial swing points
• Self cleaning map that retires old or invalid levels
• Volatility aware presentation using ATR based thickness
• Touch counting for persistence assessment
• Tunable inputs for instrument and timeframe
Limitations and caveats
• Volume strength is an approximation based on bars spanning the price, not true per price volume
• Pivots confirm after the sensitivity window completes, so new levels appear with a delay
• Narrow ranges can still cluster levels unless minimum distance is increased
• Large gaps may jump past levels and immediately trigger break conditions
Practical tuning guide
• If the chart is crowded: increase sensitivity, increase minimum level distance, or reduce maximum active levels
• If useful levels are missed: reduce volume multiplier or sensitivity
• If you want stricter break removal: increase the ATR based break threshold in code
• For instruments with session patterns: tailor the lookback period to a representative window
Interpreting touches and breaks
• First touch after creation is a validation test
• Multiple shallow touches suggest absorption; a later break may then travel farther
• Breaks on high current volume merit extra attention
Multi timeframe usage
Levels are computed on the active chart timeframe. A common workflow is to keep a higher timeframe instance for structure and a lower timeframe instance for execution. Align trades with higher timeframe levels where possible.
Final Thoughts
This indicator builds a lightweight, self updating map of support and resistance grounded in swings and participation. It is not a full market profile, but it captures much of the practical benefit with modest complexity. Treat levels as context and decision zones, not guarantees. Combine with your entry logic and risk controls.
