ICT Macros - CorrigéThis indicator is designed to help traders apply the concepts of ICT (Inner Circle Trader) by providing a clear and accurate visualization of market macros directly on the chart. Instead of manually drawing levels or constantly switching between timeframes, the indicator automatically highlights the key reference points that form the backbone of ICT analysis.
Key Features:
Automatic Macro Visualization: identifies and displays market macros as defined in ICT concepts, making it easier to recognize institutional levels.
Timeframe Flexibility: adapts to different chart periods, allowing traders to align intraday setups with higher timeframe structures.
Clean and Efficient Display: focuses only on the most relevant information, avoiding clutter and making the chart more readable.
Strategic Decision Support: provides essential context for ICT-based strategies, including identifying market direction, liquidity pools, and potential reversal zones.
Why Use It?
This indicator is built for traders who follow ICT methodology and want a reliable tool to instantly spot macro structure without wasting time on repetitive manual work. By combining precision with clarity, it enhances situational awareness and supports better decision-making in both intraday and swing trading.
Ictconcepts

ICT Venom Trading Model [TradingFinder] SMC NY Session 2025SetupIntroduction
The ICT Venom Model is one of the most advanced strategies in the ICT framework, designed for intraday trading on major US indices such as US100, US30, and US500. This model is rooted in liquidity theory, time and price dynamics, and institutional order flow.
The Venom Model focuses on detecting Liquidity Sweeps, identifying Fair Value Gaps (FVG), and analyzing Market Structure Shifts (MSS). By combining these ICT core concepts, traders can filter false breakouts, capture sharp reversals, and align their entries with the real institutional liquidity flow during the New York Session.
Key Highlights of ICT Venom Model :
Intraday focus : Optimized for US indices (US100, US30, US500).
Time element : Critical window is 08:00–09:30 AM (Venom Box).
Liquidity sweep logic : Price grabs liquidity at 09:30 AM open.
Confirmation tools : MSS, CISD, FVG, and Order Blocks.
Dual setups : Works in both Bullish Venom and Bearish Venom conditions.
At its core, the ICT Venom Strategy is a framework that explains how institutional players manipulate liquidity pools by engineering false breakouts around the initial range of the market. Between 08:00 and 09:30 AM New York time, a range called the “Venom Box” is formed.
This range acts as a trap for retail traders, and once the 09:30 AM market open occurs, price usually sweeps either the high or the low of this box to collect stop-loss liquidity. After this liquidity grab, the market often reverses sharply, giving birth to a classic Bullish Venom Setup or Bearish Venom Setup
The Venom Model (ICT Venom Trading Strategy) is not just a pattern recognition tool but a precise institutional trading model based on time, liquidity, and market structure. By understanding the Initial Balance Range, watching for Liquidity Sweeps, and entering trades from FVG zones or Order Blocks, traders can anticipate market reversals with high accuracy. This strategy is widely respected among ICT followers because it offers both risk management discipline and clear entry/exit conditions. In short, the Venom Model transforms liquidity manipulation into actionable trading opportunities.
Bullish Setup :
Bearish Setup :
🔵 How to Use
The ICT Venom Model is applied by observing price behavior during the early hours of the New York session. The first step is to define the Initial Range, also called the Venom Box, which is formed between 08:00 and 09:30 AM EST. This range marks the high and low points where institutional traders often create traps for retail participants. Once the official market opens at 09:30 AM, price usually sweeps either the top or bottom of this box to collect liquidity.
After this liquidity grab, the market tends to reverse in alignment with the true directional bias. To confirm the setup, traders look for signals such as a Market Structure Shift (MSS), Change in State of Delivery (CISD), or the appearance of a Fair Value Gap (FVG). These elements validate the reversal and provide precise levels for trade execution.
🟣 Bullish Setup
In a Bullish Venom Setup, the market first sweeps the low of the Venom Box after 09:30 AM, triggering sell-side liquidity collection. This downward move is often sharp and deceptive, designed to stop out retail long positions and attract new sellers. Once liquidity is taken, the market typically shifts direction, forming an MSS or CISD that signals a reversal to the upside.
Traders then wait for price to retrace into a Fair Value Gap or a demand-side Order Block created during the reversal leg. This retracement offers the ideal entry point for long positions. Stop-loss placement should be just below the liquidity sweep low, while profit targets are set at the Venom Box high and, if momentum continues, at higher session or daily highs.
🟣 Bearish Setup
In a Bearish Venom Setup, the process is similar but reversed. After the Initial Range is defined, if price breaks above the Venom Box high following the 09:30 AM open, it signals a false breakout designed to collect buy-side liquidity. This move usually traps eager buyers and clears out stop-losses above the high.
After the liquidity sweep, confirmation comes through an MSS or CISD pointing to a reversal downward. At this stage, traders anticipate a retracement into a Fair Value Gap or a supply-side Order Block formed during the reversal. Short entries are taken within this zone, with stop-loss positioned just above the liquidity sweep high. The logical profit targets include the Venom Box low and, in stronger bearish momentum, deeper session or daily lows.
🔵 Settings
Refine Order Block : Enables finer adjustments to Order Block levels for more accurate price responses.
Mitigation Level OB : Allows users to set specific reaction points within an Order Block, including: Proximal: Closest level to the current price. 50% OB: Midpoint of the Order Block. Distal: Farthest level from the current price.
FVG Filter : The Judas Swing indicator includes a filter for Fair Value Gap (FVG), allowing different filtering based on FVG width: FVG Filter Type: Can be set to "Very Aggressive," "Aggressive," "Defensive," or "Very Defensive." Higher defensiveness narrows the FVG width, focusing on narrower gaps.
Mitigation Level FVG : Like the Order Block, you can set price reaction levels for FVG with options such as Proximal, 50% OB, and Distal.
CISD : The Bar Back Check option enables traders to specify the number of past candles checked for identifying the CISD Level, enhancing CISD Level accuracy on the chart.
🔵 Conclusion
The ICT Venom Model is more than just a reversal setup; it is a complete intraday trading framework that blends liquidity theory, time precision, and market structure analysis. By focusing on the Initial Range between 08:00 and 09:30 AM New York time and observing how price reacts at the 09:30 AM open, traders can identify liquidity sweeps that reveal institutional intentions.
Whether in a Bullish Venom Setup or a Bearish Venom Setup, the model allows for precise entries through Fair Value Gaps (FVGs) and Order Blocks, while maintaining clear risk management with well-defined stop-loss and target levels.
Ultimately, the ICT Venom Model provides traders with a structured way to filter false moves and align their trades with institutional order flow. Its strength lies in transforming liquidity manipulation into actionable opportunities, giving intraday traders an edge in timing, accuracy, and consistency. For those who master its logic, the Venom Model becomes not only a strategy for entry and exit, but also a deeper framework for understanding how liquidity truly drives price in the New York session.

ICT Multi-Timeframe Market Structure Tracker [SwissAlgo]ICT Multi-Timeframe Market Structure Tracker
Tracks the ICT market structure across three core timeframes (1-Week, 1-Day, 1-Hour) simultaneously.
----------------------------------------------------------------------
Why this Indicator?
You know market structure matters, whether you trade stocks, Forex, commodities, or crypto.
You've studied ICT concepts - " Change of Character ", " Break of Structure ", " Premium/discount zones ". You understand that multi-timeframe alignment is where the edge lives.
But here's what's probably happening while you apply the ICT concepts for your trading decisions:
You're manually drawing structural highs and lows across three timeframes
You're calculating Fibonacci retracements by hand for each timeframe
You're switching between weekly, daily, and hourly charts, trying to remember where each pivot was, trying to detect the critical events you're waiting for
By the time you've mapped it all out, the setup is gone. Or worse, you missed that the 1-hour just broke the structure while you were checking the weekly bias.
What about seeing all three timeframes at once instead? You need to know immediately when the price enters a premium or discount zone. You need alerts that fire when structure breaks or character changes - across all timeframes - without babysitting your screen.
----------------------------------------------------------------------
The Indicator, at a Glance
This indicator:
tracks ICT market structure across three core timeframes (1-Week, 1-Day, 1-Hour) simultaneously .
automatically plots Fibonacci retracement levels from your defined structural pivots
monitors price position (during retracements) in real-time
sends consolidated alerts when actionable events occur on any timeframe
The 1-Week View: Mid-Term Trend Bias for lower timeframes
The 1-Day View: Swings nested within the 1-Week Structure
The 1-Hour View: Swings nested within the 1-Day Structure
One glance tells you:
* Current trend direction per timeframe
* Exact Fib zone price is trading right now
* Whether the structure just broke or the character changed
* If you're in a potential long/short setup zone
The indicator helps you reduce chart-hopping, manual calculations, and minimize the missed structural shifts.
----------------------------------------------------------------------
Who is this for?
This tool is built for day traders who understand ICT concepts and need efficient multi-timeframe structure tracking. If you know what a Change of Character is, why 0.382-0.5 retracements matter in uptrends, and how to trade external structure, this indicator eliminates the manual structure tracking so you can focus on confirming and executing your trading tactics.
New to ICT? This indicator assumes foundational knowledge of the Inner Circle Trader methodology developed by Michael J. Huddleston. Before using this tool, familiarize yourself with concepts like market structure breaks, premium/discount arrays, and liquidity engineering. The ICT framework offers a unique perspective on institutional order flow and price action - but this indicator is designed for those already applying these concepts, not learning them for the first time.
Critical Skill Required : You must understand the difference between external structure (key swing highs/lows that define market direction) and internal structure (minor fluctuations within the range).
Selecting incorrect pivots - such as marking internal noise instead of true structural points - will generate false signals and undermine the entire analysis. This indicator tracks structure based on YOUR inputs. If those inputs are wrong, every Fibonacci level, alert, and bias signal will be wrong. Learn to identify clean structural breaks before using this tool.
Trading Experience Matters: This tool tracks structure and fires alerts, but interpreting those signals requires understanding context, confluences, and risk management. If you're early in your trading journey, consider this a professional-grade instrument that becomes powerful once you have the conceptual foundation to use it effectively.
----------------------------------------------------------------------
How It Works
Step 1: Define Your Structure
You, the ICT expert or student, define the structural high and low for each timeframe, with their exact dates. This empowers you to control the analysis.
Based on your entries, the indicator establishes trend direction by timeframe and calculates Fibonacci retracement levels automatically.
* Structural High/Low: Key swing points that define external structure per ICT methodology
* Auto-Validation: Built-in autoscan feature confirms your pivot entries match actual price extremes
* Deterministic Behavior: Date stamps ensure the indicator behaves consistently across all sessions
Step 2: Monitor The Tables
Two tables provide a structural context:
Multi-Timeframe Analysis Table (top-right):
Current close, high, low, and 0.5 Fib for all three timeframes
Trend direction (↑/↓)
Days since structure established (i.e., "age" or maturity)
Current Fibonacci zone
Real-time alerts: Trend changes, breakouts, and trade bias signals
Detailed Fibonacci Table (middle-right):
All nine Fib retracement levels (1.0 to 0.0) for the selected timeframe
Exact price at each level
Percentage distance from current price
Visual marker showing current position
Step 3: Monitor The Chart
Visual elements show structure at a glance:
Fibonacci Retracement Zones: Color-coded bands show premium (red), discount (green), and equilibrium (gray) areas based on trend direction
Structural Lines: Red (high) and green (low) horizontal lines mark your defined pivots with automatic fill showing the current range (based on higher timeframe pivots)
Pivot Dots: Optional small markers highlight potential structural turning points on your current timeframe (reference only - always validate pivots yourself)
Trend Indicator: Top-center banner displays the selected timeframe's current trend
Auto-pivot points
Step 4: Get Alerts and Decide the Way Forward
Set one alert on the 1-hour chart only (if you set the alert on other timeframes, you may get delayed feedback).
You'll receive notifications when ANY of these events occur on ANY timeframe:
* Change of Character (ChoC): Trend reversal confirmed by price breaking the opposite structural level
* Break of Structure (BoS): Continuation confirmed by price breaking the same-direction structural level
* Trade Bias Signals: Price entering key Fibonacci zones (0.382-0.5 for longs in uptrend, 0.5-0.618 for shorts in downtrend, with + and ++ variants for deeper retracements)
* Reversal Warnings: Price entering extreme zones (0.882-1.0 or 0.0-0.118), suggesting potential trend exhaustion and reversal towards the opposite direction
All alerts fire once per bar close with a consolidated message showing which timeframes triggered and what conditions were met.
----------------------------------------------------------------------
Understanding the 3 Timeframes Hierarchy
The three timeframes may be conceived as nested layers of structure:
* 1-Week (Macro Bias) : May help you determine your core directional bias (long/short) in a mid-term perspective. The 1-Week TF may operate as your highest-conviction filter and help you contextualize shorter-term market moves (which may align or misalign with the trend appearing on such a timeframe).
* 1-Day (Swing Structure) : Operates within the weekly range. The daily structure can contradict the weekly structure temporarily (due to retracements, consolidations). This is where you may identify intermediate swing opportunities.
* 1-Hour (Execution Structure) : Operates within the daily range. It may help you identify entry timing and short-term bias. Can show opposite trends during retracements, and some traders look for alignment with higher timeframes as part of their setup criteria.
Example: Weekly uptrend (bullish bias) → Daily pulls back into downtrend (retracement phase) → Hourly shows uptrend resumption (this may be interpreted as an entry signal). All three trends can differ simultaneously, but when all three align (in one direction or another), you may start evaluating your moves.
----------------------------------------------------------------------
Using the Tool effectively
When this indicator signals a potential setup (entering key Fibonacci zones, structure breaks, or bias shifts), treat it as a starting point for deeper analysis, not a direct entry signal.
Before executing, consider using additional tools to refine timing:
Fair Value Gaps (FVG) : Identify imbalances where the price moved too quickly, leaving potential fill zones
Order Blocks : Locate the last opposing candle before a strong move - often institutional entry points
Liquidity Zones : Map where stop losses likely cluster (equal highs/lows, round numbers)
Premium/Discount Confirmation: Verify you're buying at a discount or selling at a premium relative to the current range
Session Timing/Kill Zones : Align entries with high-liquidity sessions (London/New York opens)
This indicator shows you where the structure sits and when it shifts. Your job is to combine that context with precise entry models. The alerts narrow your focus to high-probability zones - then you apply your edge within those zones.
----------------------------------------------------------------------
How to Set Up Alerts
This indicator monitors all three timeframes simultaneously and fires consolidated alerts when any condition triggers. Follow these steps to configure alerts properly:
Step 1: Set Your Chart to the 1-Hour Timeframe
Alerts must be created on the 1-hour chart for optimal timing
Do not use higher timeframes (4H, 1D, 1W) or alerts may be delayed
Lower timeframes (15M, 5M) will work but may generate more frequent notifications
Step 2: Open the Alert Menu
Click the "Alert" button (clock icon) in the top toolbar
Or use keyboard shortcut: Alt+A (Windows) / Option+A (Mac)
Step 3: Configure Alert Settings
Condition: Select "ICT Multi-Timeframe Market Structure Tracker "
Alert Type: Choose "Any alert() function call"
Options: Select "Once Per Bar Close"
Expiration: Set to "Open-ended alert" (no expiration)
Alert Name: Choose a descriptive name (e.g., "BTC Market Structure Alerts")
Step 4: Configure Notifications
Notification Methods: Check your preferred channels (app notification, email, webhook, etc.)
Sound: Optional — choose alert sound if desired
Step 5: Create Alert
Click the "Create" button
Alert is now active and will monitor all three timeframes
Important Notes:
You only need ONE alert setup total — it monitors 1W, 1D, and 1H simultaneously
Alert messages show which timeframe(s) triggered and what conditions were met
Alerts fire once per bar close to avoid mid-bar noise
If you change your structural pivot inputs, the alert continues working with new parameters
Example Alert Message:
BTC Market Structure Alert:
🟢 1D Bullish BoS
📈 1H Long Setup (0.382-0.5)
This tells you the 1-Day broke structure bullishly AND the 1-Hour entered a long setup zone — both events happened on the same bar close.
----------------------------------------------------------------------
Key Features
* Tracks 1-Week, 1-Day, and 1-Hour structure simultaneously
* Automatic Fibonacci retracement calculation (9 levels + extensions up or down, depending on timeframe trend)
* Real-time Change of Character and Break of Structure detection
* Color-coded premium/discount zone visualization
* Multi-condition alerts across all timeframes (single alert setup required)
* Autoscan validation to confirm manual pivot entry accuracy
* Timezone-adjustable for global markets
----------------------------------------------------------------------
Important Notes
* Requires ICT Knowledge: This is not a plug-and-play system. Understanding market structure, liquidity concepts, and Fibonacci confluence is essential for effective use.
* Manual Structure Definition: You define the structural pivots. The indicator tracks and alerts - it doesn't make trading decisions.
* Chart Timeframe: Set alerts on the 1-hour chart for optimal timing across all three monitored timeframes.
----------------------------------------------------------------------
Disclaimer
This indicator is for educational and informational purposes only. It does not constitute financial, investment, or trading advice.
The indicator:
* Makes no guarantees about future market performance
* Cannot predict market movements with certainty
* May generate false indications
* Relies on historical patterns that may not repeat
* Should not be used as the sole basis for trading decisions
Users are responsible for:
* Conducting independent research and analysis
* Understanding the risks of trading
* Making their own investment/divestment decisions
* Managing position sizes and risk exposure appropriately
Trading involves substantial risk and may not be suitable for all investors. Past performance does not guarantee future results. Users should only invest what they can afford to lose and consult qualified professionals before making financial decisions. The indicator’s assumptions may be invalidated by changing market conditions.
By using this tool, users acknowledge these limitations and accept full responsibility for their trading decisions.

CNagda-MomentumX - Institutional FlowMomentumX is designed to empower traders with a deeper understanding of market movements by focusing on Institutional Flow and advanced market structure analytics. The core goal is to identify and visualize where major market participants are operating, and to translate these complex footprints into clear, actionable trading signals — all in real time.
Real-time institutional activity mapping
Actionable entry and exit signals based on live market structure
Intuitive dashboard and dynamic chart visuals
Fully customizable modules for trend, liquidity, and order blocks
Core Logic Design
At the heart of MomentumX lies a robust algorithmic engine built to capture and surface institutional trading behavior. By leveraging advanced mathematical models, the indicator calculates institutional volume ratios and price momentum to pinpoint aggressive moves from large participants.
Institutional Volume & Price Momentum:
Utilizes custom volume indicators and price change analysis to detect strong buying or selling pressure, filtering out retail noise.
Liquidity Grab Detection & Activity Zones:
The script identifies liquidity grabs by monitoring abrupt price sweeps at major support/resistance levels—often where institutions trigger stop hunts or reversals. All critical activity zones are automatically color-coded on the chart for instant recognition.
Dashboard Visualization:
A fully dynamic dashboard table overlays live scores for accumulation, distribution, strength, and weakness—giving traders a real-time scan of market health.
Trendline & Order Block Architecture:
The logic auto-detects pivot highs/lows to draw smart trendlines, while the order block system highlights key reversal areas and breaker zones—making market structure clear and actionable.
MomentumX is packed with high-performance modules, each engineered to simplify complex market behavior and enhance decision-making for traders:
Institutional Flow Signals:
Instantly identifies spots where institutional players drive momentum, using unique volume and price activity analytics.
Bullish/Bearish Liquidity Grab Detection:
Marks abrupt price moves that signal stop hunts or reversals, letting traders anticipate snap-backs or trend shifts.
Trendline Auto-Detection:
Smartly draws trendlines based on significant swing highs and lows, automatically adjusting as price evolves.
Order Block System (Rejection/Breaker):
Spots and highlights key reversal zones with order block rectangles, confirming rejections or breakouts at strategic levels.
Dashboard and Bar Coloring:
A clean dashboard overlay presents live market scores, while dynamic bar coloring makes trend, strength, and high-activity periods instantly visible.
User Input Toggles for Each Module:
Every major feature is fully customizable—enable or disable modules to match individual trading setups or preferences.
Scripting/Development
MomentumX’s scripting process is modular, enabling clarity, scalability, and fast optimization throughout development:
Initialization & Inputs:
Start by defining all user input options, module toggles, color settings, and calculation parameters—ensuring maximum flexibility early on.
Core Calculation Functions:
Script advanced institutional volume and price momentum algorithms. Build out swing length logic, market state filters, and activity scoring methods.
Detection Engines:
Develop and integrate engines for liquidity grabs, automated trendline detection, and order block identification—each with dedicated functions for speed and precision.
Visual Overlays & Plotting:
Implement powerful plotting logic for colored bars, score dashboards, trendlines, reversal zones, and liquidity markers—making every data point clear and actionable on the chart.
Testing Handlers:
Add diagnostic panels and debug outputs to refine calculations and assure accuracy in every market environment.
Sample Trade Setups (Usage)
Cnagda MomentumX delivers clarity for multiple trading styles by providing timely, actionable setups grounded in institutional behavior and market structure. Here’s how traders can leverage the indicator for confident decision-making:
Liquidity Grab Reversal
Enter trades around detected liquidity grabs when price sweeps major support/resistance and the dashboard signals a momentum shift.
Example: Wait for a bullish/Bearish grab near market lows/high, with institutional flow turning positive/negative—enter long/short for potential mean reversion.
Order Block Breakout
Trade breakouts when price cleanly rejects or flips key order block zones highlighted on the chart.
Example: Short at a marked breaker block after a rejection signal, confirmed by a downward institutional activity spike.
Trendline Continuation
Ride established market moves by entering on trendline confirmations plotted by the auto-detect system.
Example: Go long after a trendline retest, confirmed by a green bar color and dashboard strength score.
Dashboard Confirmation
Combine dashboard metrics (strength, accumulation, distribution) with bar color overlays for multi-factor entries.
Example: Enter trades only when all market signals align in real time for maximum probability.
For Short Entry check -- Weakness : For Long Entry Check - Strength With Other Indications
MomentumX is not just another indicator – it’s your edge for reading the market like an insider. By transparently mapping institutional flow, uncovering hidden liquidity zones, and color-coding every major structure shift, MomentumX transforms complexity into actionable clarity. Whether you’re scalping, swing trading, or investing, you’ll gain a decisive, real-time advantage on every chart.
Embrace smarter decisions, adapt to changing market conditions instantly, and join a new generation of technically empowered traders.
Customize, observe, and let the market reveal opportunities in a way you’ve never experienced before.
Happy Trading

Order Block Volumatic FVG StrategyInspired by: Volumatic Fair Value Gaps —
License: CC BY-NC-SA 4.0 (Creative Commons Attribution–NonCommercial–ShareAlike).
This script is a non-commercial derivative work that credits the original author and keeps the same license.
What this strategy does
This turns BigBeluga’s visual FVG concept into an entry/exit strategy. It scans bullish and bearish FVG boxes, measures how deep price has mitigated into a box (as a percentage), and opens a long/short when your mitigation threshold and filters are satisfied. Risk is managed with a fixed Stop Loss % and a Trailing Stop that activates only after a user-defined profit trigger.
Additions vs. the original indicator
✅ Strategy entries based on % mitigation into FVGs (long/short).
✅ Lower-TF volume split using upticks/downticks; fallback if LTF data is missing (distributes prior bar volume by close’s position in its H–L range) to avoid NaN/0.
✅ Per-FVG total volume filter (min/max) so you can skip weak boxes.
✅ Age filter (min bars since the FVG was created) to avoid fresh/immature boxes.
✅ Bull% / Bear% share filter (the 46%/53% numbers you see inside each FVG).
✅ Optional candle confirmation and cooldown between trades.
✅ Risk management: fixed SL % + Trailing Stop with a profit trigger (doesn’t trail until your trigger is reached).
✅ Pine v6 safety: no unsupported args, no indexof/clamp/when, reverse-index deletes, guards against zero/NaN.
How a trade is decided (logic overview)
Detect FVGs (same rules as the original visual logic).
For each FVG currently intersected by the bar, compute:
Mitigation % (how deep price has entered the box).
Bull%/Bear% split (internal volume share).
Total volume (printed on the box) from LTF aggregation or fallback.
Age (bars) since the box was created.
Apply your filters:
Mitigation ≥ Long/Short threshold.
Volume between your min and max (if enabled).
Age ≥ min bars (if enabled).
Bull% / Bear% within your limits (if enabled).
(Optional) the current candle must be in trade direction (confirm).
If multiple FVGs qualify on the same bar, the strategy uses the most recent one.
Enter long/short (no pyramiding).
Exit with:
Fixed Stop Loss %, and
Trailing Stop that only starts after price reaches your profit trigger %.
Input settings (quick guide)
Mitigation source: close or high/low. Use high/low for intrabar touches; close is stricter.
Mitigation % thresholds: minimal mitigation for Long and Short.
TOTAL Volume filter: skip FVGs with too little/too much total volume (per box).
Bull/Bear share filter: require, e.g., Long only if Bull% ≥ 50; avoid Short when Bull% is high (Short Bull% max).
Age filter (bars): e.g., ≥ 20–30 bars to avoid fresh boxes.
Confirm candle: require candle direction to match the trade.
Cooldown (bars): minimum bars between entries.
Risk:
Stop Loss % (fixed from entry price).
Activate trailing at +% profit (the trigger).
Trailing distance % (the trailing gap once active).
Lower-TF aggregation:
Auto: TF/Divisor → picks 1/3/5m automatically.
Fixed: choose 1/3/5/15m explicitly.
If LTF can’t be fetched, fallback allocates prior bar’s volume by its close position in the bar’s H–L.
Suggested starting presets (you should optimize per market)
Mitigation: 60–80% for both Long/Short.
Bull/Bear share:
Long: Bull% ≥ 50–70, Bear% ≤ 100.
Short: Bull% ≤ 60 (avoid shorting into strong support), Bear% ≥ 0–70 as you prefer.
Age: ≥ 20–30 bars.
Volume: pick a min that filters noise for your symbol/timeframe.
Risk: SL 4–6%, trailing trigger 1–2%, distance 1–2% (crypto example).
Set slippage/fees in Strategy Properties.
Notes, limitations & best practices
Data differences: The LTF split uses request.security_lower_tf. If the exchange/data feed has sparse LTF data, the fallback kicks in (it’s deliberate to avoid NaNs but is a heuristic).
Real-time vs backtest: The current bar can update until close; results on historical bars use closed data. Use “Bar Replay” to understand intrabar effects.
No pyramiding: Only one position at a time. Modify pyramiding in the header if you need scaling.
Assets: For spot/crypto, TradingView “volume” is exchange volume; in some markets it may be tick volume—interpret filters accordingly.
Risk disclosure: Past performance ≠ future results. Use appropriate position sizing and risk controls; this is not financial advice.
Credits
Visual FVG concept and original implementation: BigBeluga.
This derivative strategy adds entry/exit logic, volume/age/share filters, robust LTF handling, and risk management while preserving the original spirit.
License remains CC BY-NC-SA 4.0 (non-commercial, attribution required, share-alike).

ICT Killzones Pro Suite — ICT & SMC Indicator with AlertsThe ICT Killzones Pro Suite is a complete ICT and Smart Money Concepts (SMC) indicator that brings together the most important institutional concepts into one single tool.
Instead of manually drawing sessions, structure breaks, liquidity levels or imbalances, this ICT indicator for TradingView automatically plots them with precision and full customization.
It is widely used by traders in Forex, Indices, Crypto and Commodities who want to study market structure the same way institutions do.
🔎 Features
✅ Killzones (Asia, London, New York)
Session boxes with customizable colors
50% midline level for equilibrium reference
Real-time status display (“In Killzone” / “Out of Killzone”)
✅ Equal Highs & Equal Lows (Liquidity zones)
Automatic detection of EQH/EQL
Equality tolerance parameter
Zone expiry (bars)
Rejection filter (2 consecutive closes)
Option to show only the latest active EQH/EQL
✅ Break of Structure (BOS) & Market Structure Shift (MSS)
Detects continuation (BOS) and reversal (MSS) structures
Customizable line styles and colors
“Body only” or “Body/Wick” break modes
Option to show only the latest signals
✅ Open Price Range (OPR)
Institutional daily open level in UTC
Historical OPR memory for backtesting
Optional labels for quick identification
✅ Previous Highs and Lows
Daily (PDH/PDL), Weekly (PWH/PWL), Monthly (PMH/PML)
Full label system
Customizable line width/style
Breakout alerts for each level
✅ Fair Value Gaps (FVGs)
Automatic imbalance detection
Wick or body detection modes
Highlighted imbalance candles in yellow
✅ Alerts Engine
One global alert condition
Modular alerts:
• Killzone opens/closes
• EQH/EQL created or broken
• BOS/MSS bullish & bearish signals
• Previous Highs/Lows breakouts
• FVGs
⚙️ Parameters Explained
Killzones: start/end times in UTC, colors, extension lines, 50% midline
EQH/EQL: tolerance (0 = strict equality, >0 = margin allowed), expiry age (bars), rejection filter, body/wick break type, latest only toggle
BOS/MSS: swing bars (pivots), body vs wick detection, line styles & widths, only-latest option
OPR: exact UTC time (HH:MM), history toggle, label size/color
Previous Highs/Lows: daily/weekly/monthly levels, line styles, label settings, breakout alerts
FVGs: wick vs body detection, candle highlight color
Alerts: global condition + per-module toggles (sessions, liquidity, BOS/MSS, FVG)
Every parameter is fully customizable, making this SMC indicator adaptable to any trading style or timeframe.
📌 Why use this ICT & SMC indicator?
Saves time by automating repetitive tasks
Provides an institutional framework directly on charts
Keeps analysis structured and consistent
Optimized for intraday scalping and swing trading
⚠️ Disclaimer
This script is for educational purposes only. It does not guarantee profits or predict markets with certainty. Always use proper risk management.
🔑 Access
This is an invite-only script on TradingView.
Click Request Access on this page to apply.

ICT Turtle Soup (Riz)The ICT Turtle Soup Complete System is an advanced implementation of the Inner Circle Trader's interpretation of the classic Turtle Soup pattern, designed to identify and trade liquidity sweeps at key market levels. This strategy capitalizes on the systematic stop-loss hunting behavior of institutional traders by detecting when price temporarily breaches significant support/resistance levels to trigger retail stop-losses, then quickly reverses direction.
Core Trading Logic
Liquidity Sweep Detection Method
The strategy monitors five critical liquidity pools where retail traders commonly place stop-loss orders:
⦁ Yesterday's High/Low: Previous daily session extremes
⦁ Daily High/Low: Rolling 20-day period extremes
⦁ 4-Hour High/Low: 30-period extremes on 4H timeframe
⦁ 1-Hour High/Low: 50-period extremes on hourly timeframe
⦁ Recent High/Low: Current timeframe extremes (20-40 bars based on trading mode)
Entry Signal Generation Process
Buy Signal (Sell-Side Liquidity Sweep):
1. Price penetrates below a key support level by a minimum threshold (5-15 ticks depending on signal quality settings)
2. The penetration bar must show strong rejection with at least 30-50% of the candle's range closing back above the swept level
3. Multi-timeframe confirmation checks for structure shift on lower timeframe (break of recent swing high)
4. Confluence scoring system evaluates 7 factors, requiring minimum 3 confirmations:
⦁ Liquidity sweep detected (weighted 2x)
⦁ Higher timeframe bullish market structure
⦁ Lower timeframe bullish break of structure
⦁ Bullish Fair Value Gap presence
⦁ Bullish Order Block formation
⦁ ICT Kill Zone timing alignment
Sell Signal (Buy-Side Liquidity Sweep):
Mirror opposite of buy signal logic, detecting sweeps above resistance levels with bearish rejection.
Risk Management & Position Sizing
Stop Loss Placement:
⦁ Calculated using ATR (Average True Range) multiplied by an adaptive factor
⦁ Base multipliers: Scalping (1.0x), Day Trading (1.5x), Swing Trading (2.0x)
⦁ Further adjusted by signal quality: Conservative (-20%), Balanced (0%), Aggressive (+20%)
⦁ Positioned beyond the liquidity sweep point to avoid re-sweeping
Take Profit Targets:
⦁ TP1: 2.0R (Risk-Reward ratio)
⦁ TP2: 3.5R
⦁ TP3: 5.0R
⦁ All levels rounded to tick precision for accurate order placement
Advanced Features & Filters
Multi-Timeframe Structure Analysis
The system performs top-down analysis across three timeframes:
⦁ Higher Timeframe (HTF): Determines primary trend bias
⦁ Medium Timeframe (MTF): Confirms intermediate structure
⦁ Lower Timeframe (LTF): Identifies precise entry triggers
ICT Kill Zones
Incorporates time-based filtering for optimal trading sessions:
⦁ Asian Session (8PM-12AM UTC)
⦁ London Session (2AM-5AM UTC)
⦁ New York Session (7AM-10AM UTC)
⦁ London Close (10AM-12PM UTC)
Smart Money Concepts Integration
⦁ Fair Value Gaps (FVG): Identifies and displays price inefficiencies that act as magnets
⦁ Order Blocks: Marks institutional accumulation/distribution zones
⦁ Mitigation Detection: Automatically removes FVGs and Order Blocks when price fills them
⦁ Duplicate Sweep Prevention: 10-bar lookback prevents multiple signals at same level
Adaptive Trading Modes
Three pre-configured modes automatically adjust all parameters:
⦁ Scalping: Tight stops, quick targets, 15-minute to 1-hour focus
⦁ Day Trading: Balanced approach, 4-hour to daily analysis
⦁ Swing Trading: Wide stops, extended targets, daily to weekly perspective
⦁ Custom Mode: Full manual control of all parameters
Signal Quality Management
⦁ Conservative: Requires 5/7 confluence factors, tighter sweep threshold (5 ticks), 50% minimum rejection
⦁ Balanced: Standard 3/7 confluence, moderate threshold (10 ticks), 30% rejection
⦁ Aggressive: Only 2/7 confluence needed, wider threshold (15 ticks), 20% rejection
Visual Components & Dashboard
Real-Time Information Panel
Displays current market conditions including:
⦁ Active trading mode and quality settings
⦁ Timeframe configuration (HTF/MTF/LTF)
⦁ Market bias from higher timeframes
⦁ Current kill zone status
⦁ Liquidity sweep detection status
⦁ Confluence scoring for both directions
⦁ Risk parameters and targets
Trade Visualization
⦁ Entry, stop-loss, and three take-profit levels with precise price labels
⦁ Automatic cleanup when targets are hit or new signals appear
⦁ Maximum of one active setup displayed for chart clarity
⦁ Color-coded boxes for Fair Value Gaps and Order Blocks
How to Use This Indicator
Recommended Timeframes
⦁ Scalping Mode: 1-minute to 5-minute charts
⦁ Day Trading Mode: 5-minute to 15-minute charts
⦁ Swing Trading Mode: 1-hour to 4-hour charts
Optimal Market Conditions
⦁ Works best in ranging or trending markets with clear support/resistance levels
⦁ Most effective during high-liquidity sessions (London/New York overlap)
⦁ Avoid using during major news events unless specifically targeting news-driven sweeps
Signal Interpretation
1. Wait for triangle signal (up/down) with confluence score
2. Verify the swept level shown in the dashboard
3. Confirm risk-reward ratios match your trading plan
4. Enter at market or set limit order at indicated entry level
5. Place stop-loss and take-profit orders at displayed levels
Customization Tips
⦁ Adjust Signal Quality based on market volatility (Conservative for volatile, Aggressive for quiet)
⦁ Modify sweep threshold if getting too many/few signals
⦁ Toggle individual liquidity levels based on their relevance to your timeframe
⦁ Use Kill Zone filter for session-specific trading
Risk Disclaimer
This indicator identifies potential trade setups based on liquidity sweep patterns but does not guarantee profitable outcomes. Past performance does not indicate future results. Always use proper risk management and never risk more than you can afford to lose. The indicator should be used as part of a comprehensive trading plan that includes your own analysis and risk tolerance assessment.

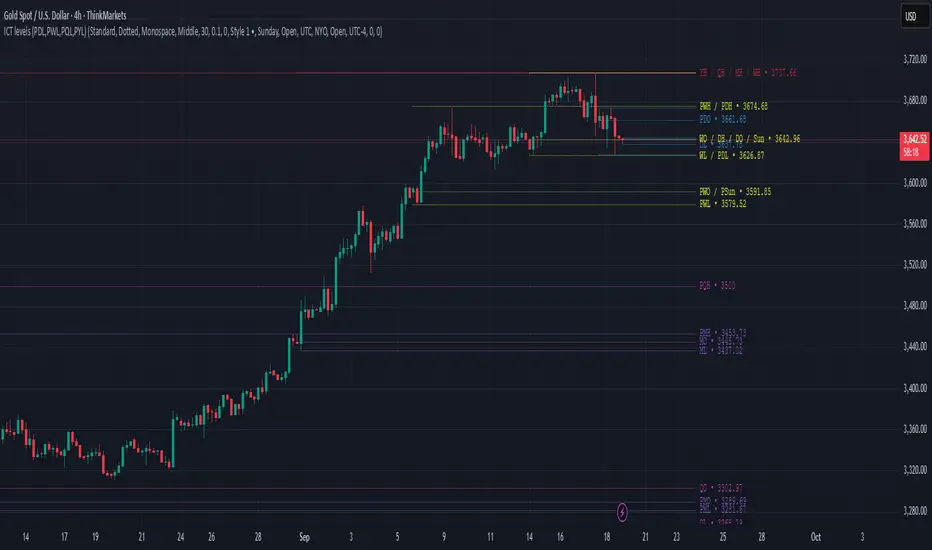
ICT levels (PDL,PWL,PQL,PYL) PDHThis indicator plots ICT reference levels for multiple timeframes, including:
Daily (DO, DH, DL, PDO, PDH, PDL)
Weekly (WO, WH, WL, PWO, PWH, PWL)
Monthly (MO, MH, ML, PMO, PMH, PML)
Quarterly (QO, QH, QL, PQO, PQH, PQL)
Yearly (YO, YH, YL, PYO, PYH, PYL)
🔹 Custom Target (NYO or user-defined):
The script also lets you display a special target level (e.g. New York Open) at a user-defined hour:minute with selectable timezone.
🔹 Day of Week levels (DoW):
You can choose a specific weekday (e.g. Tuesday Open/High/Low/Close) with adjustable timezone, allowing flexible session-based analysis.
🔹 Display & Style Options:
Extend lines (None, Right, Left, Both)
Line style (Solid, Dashed, Dotted)
Font type (Default, Monospace)
Label position (Top or Middle, with spacing adjustment)
Offset bars for labels
Merge labels if levels are too close (threshold % configurable)
🔹 Priority Handling:
Includes High Timeframe Priority (TFP) option so higher-TF levels overwrite lower ones when overlapping.
🔹 Customization:
Global text and line colors
Individual colors for Day, Week, Month, Quarter, Year, DoW, and Target
Option to show/hide prices next to labels in different styles
Opening Range Gaps [LEG]📌 Opening Range Gaps
Are you tired of indicators that don’t show the correct opening price on CFDs, or that fail to capture the true 09:30 open or the 16:14 on Nasdaq futures?
Or worse… tools that only work on the 1-minute chart?
👉 This script was built to fix that.
🔑 Why this indicator?
Unlike most gap tools, Opening Range Gaps :
Works seamlessly on both CFDs and Futures for Nasdaq.
Captures the exact 16:14 close (the CFD session end) and the true 09:30 open using M1 data aggregation, even if you’re on a higher timeframe.
Works reliably on any intraday timeframe — not just the 1-minute chart, but all the way up to the timeframe you set in the Timeframe Limit (default: 30m).
⚙️ Features:
Gap Detection with Precision
Uses the close of the 16:14 bar (last CFD session minute) as the reference.
Captures the specific open at 09:30 (not approximated by session).
Plots the gap as a shaded box with customizable colors.
Quarter Levels Inside the Gap
Automatically divides the gap into 25%, 50%, and 75% levels for precision trading.
Customization
Show/hide vertical session delimitations.
Choose whether to track the reference price throughout the session.
Extend boxes to the right for context.
Keep only the last “n” gaps on your chart (default: 10).
Works Across Timeframes
Thanks to request.security_lower_tf, all logic is based on 1-minute data, so even if you’re on 5m, 15m, or 30m, the gap will always plot with exact levels.
🧭 Use Cases
Spot the true overnight gap between CFD close (16:14) and futures open (09:30).
Track how Nasdaq fills (or fails to fill) gaps during the day.
Use quarter levels for partial fills, rejection points, or continuation setups.
Combine with ICT concepts or price action strategies to identify liquidity-driven moves.

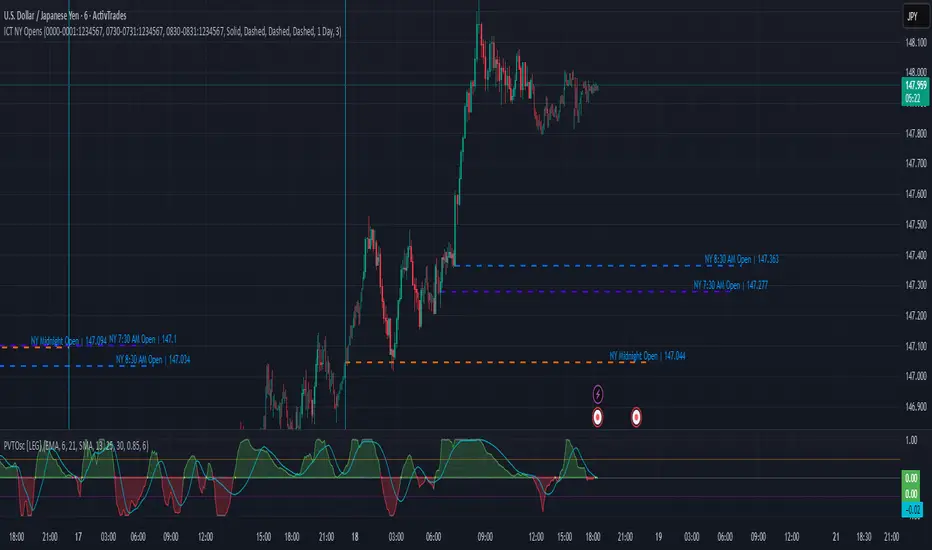
ICT NY Opens (Midnight, 7:30 & 8:30) True📌 ICT NY Opens Fixed (Midnight, 7:30 & 8:30) TRUE
This indicator is designed for traders following ICT (Inner Circle Trader) concepts and provides precise reference levels for the most relevant New York session opens. It automatically captures and plots the opening price for Midnight (00:00 NY), 7:30 AM, and 8:30 AM (configurable), letting you use them as liquidity anchors, manipulation zones, or institutional reference points.
🔑 Key Features
Fixed New York Opens (configurable)
Midnight (00:00 NY), 7:30 AM (NY), 8:30 AM (NY) — each open is captured from the first bar of the configured session.
Sessions are editable: the indicator exposes input.session fields for each open, so you can change the exact hour/minute (e.g., set 00:00 → 23:30 or 08:30 → 08:00). The lines and levels will follow the chosen session times.
Extension & Custom Hours (explicit)
Preset extensions: 1 Day or 2 Days (the horizontal line spans that period).
Directional extension: Right (extend to the right) or Both (left & right).
Custom Hours option: enable a custom-hours toggle and enter a specific number of hours (1–23). When enabled, horizontal lines extend for the exact number of hours you enter instead of the preset day lengths.
Labels are positioned relative to the extension setting (anchored at the open or after the extension depending on the selected mode).
Customizable visuals
Show/hide each open individually.
Independent color and line-style (solid / dotted / dashed) for each open.
Separate text color for labels.
Automatic Labels & Vertical Line
Each drawn level includes an automatic label with the open name and the exact opening price.
A dedicated vertical line option exists for the Midnight open (visual daily separator).
⚙️ How it behaves (precision & workflow)
The script detects the first bar inside the session you configure and records that bar's open as the session Open price.
If you change the session string/time in settings, the indicator will use the new time going forward and draw the corresponding level at that session's opening bar.
Extensions respect either the preset days or the custom hours you specify, so you can make lines last a precise number of hours (useful for intraday setups).
🧭 Use Cases
Pinpoint liquidity clusters and anticipate stop hunts near session opens.
Use as range anchors to measure intraday deviations.
Monitor reactions around economic releases and futures opens (7:30 / 8:30).
Integrate into ICT-based scalping or swing setups where precise session timing matters.
ICT Institutional Order Flow (Riz)This indicator implements Inner Circle Trader (ICT) institutional order flow concepts to identify high-probability entry points where smart money is actively participating in the market. It combines volume analysis, market structure, and price action patterns to detect institutional accumulation and distribution zones.
Core Concepts & Methodology
1. Institutional Order Blocks Detection
Order blocks represent the last opposing candle before a strong directional move, indicating institutional accumulation (bullish) or distribution (bearish) zones.
How it works:
⦁ Identifies the final bearish candle before bullish expansion (accumulation)
⦁ Identifies the final bullish candle before bearish expansion (distribution)
⦁ Validates with volume spike (2x average) to confirm institutional participation
⦁ Requires minimum 0.5% price displacement to filter weak moves
⦁ Tracks these zones as future support/resistance levels
2. Fair Value Gap (FVG) Analysis
FVGs are price inefficiencies created by aggressive institutional orders that leave gaps in price action.
Detection method:
⦁ Bullish FVG: When current low > high from 2 bars ago
⦁ Bearish FVG: When current high < low from 2 bars ago
⦁ Minimum gap size filter (0.1% default) eliminates noise
⦁ Monitors gap fills with volume for entry signals
⦁ Gaps act as magnets drawing price back for "rebalancing"
3. Liquidity Hunt Detection
Institutions often trigger retail stop losses before reversing direction, creating liquidity for their positions.
Algorithm:
⦁ Calculates rolling 20-period highs/lows as liquidity pools
⦁ Detects wicks beyond these levels (0.1% sensitivity)
⦁ Identifies rejection back inside range (liquidity grab)
⦁ Volume spike confirmation ensures institutional involvement
⦁ These reversals often mark significant turning points
4. Volume Profile Integration
Analyzes volume distribution across price levels to identify institutional interest zones.
Components:
⦁ Point of Control (POC): Price level with highest volume (institutional consensus)
⦁ Value Area: 70% of volume range (institutional comfort zone)
⦁ Uses 50-bar lookback to build volume histogram
⦁ 20 price levels for granular distribution analysis
5. Market Structure Analysis
Determines overall trend bias using pivot points and swing analysis.
Process:
⦁ Identifies swing highs/lows using 3-bar pivots
⦁ Bullish structure: Price above last swing high
⦁ Bearish structure: Price below last swing high
⦁ Filters signals to trade with institutional direction
Signal Generation Logic
BUY signals trigger when ANY condition is met:
1. Order Block Formation: Bearish-to-bullish transition + volume spike + strong move
2. Liquidity Grab Reversal: Sweep below lows + recovery + volume spike
3. FVG Fill: Price fills bullish gap with institutional volume (within 3 bars)
4. Order Block Respect: Price bounces from previous bullish OB + volume
SELL signals trigger when ANY condition is met:
1. Order Block Formation: Bullish-to-bearish transition + volume spike + strong move
2. Liquidity Grab Reversal: Sweep above highs + rejection + volume spike
3. FVG Fill: Price fills bearish gap with institutional volume (within 3 bars)
4. Order Block Respect: Price rejects from previous bearish OB + volume
Additional filters:
⦁ Signals align with market structure (no counter-trend trades)
⦁ No new signals while position is active
⦁ All signals require volume confirmation (institutional fingerprint)
Trading Style Auto-Configuration
The indicator features intelligent preset configurations for different trading styles:
Scalping Mode (1-5 min charts):
⦁ Volume multiplier: 1.5x (more signals)
⦁ Tighter parameters for quick trades
⦁ Risk:Reward 1.5:1, ATR multiplier 1.0
Day Trading Mode (15-30 min charts):
⦁ Volume multiplier: 1.7x (balanced)
⦁ Medium sensitivity settings
⦁ Risk:Reward 2:1, ATR multiplier 1.5
Swing Trading Mode (1H-4H charts):
⦁ Volume multiplier: 2.0x (quality focus)
⦁ Conservative parameters
⦁ Risk:Reward 3:1, ATR multiplier 2.0
Custom Mode:
⦁ Full manual control of all parameters
Visual Components
⦁ Order Blocks: Colored rectangles (green=bullish, red=bearish)
⦁ Fair Value Gaps: Orange boxes showing imbalances
⦁ Liquidity Levels: Dashed blue lines at key highs/lows
⦁ Volume Spikes: Yellow background highlighting
⦁ POC Line: Orange line showing highest volume price
⦁ Value Area: Blue shaded zone of 70% volume
⦁ Buy/Sell Signals: Triangle markers with text labels
⦁ Stop Loss/Take Profit: Dotted lines (red/green)
Information Panel
Real-time dashboard displaying:
⦁ Current trading mode
⦁ Volume ratio (current vs average)
⦁ Market structure (bullish/bearish)
⦁ Active order blocks count
⦁ Position status
⦁ Configuration details
How to Use
Step 1: Select Trading Style
Choose your style in settings - all parameters auto-adjust
Step 2: Timeframe Selection
⦁ Scalping: 1-5 minute charts
⦁ Day Trading: 15-30 minute charts
⦁ Swing: 1H-4H charts
Step 3: Signal Interpretation
⦁ Wait for BUY/SELL markers
⦁ Check volume ratio >2 for strong signals
⦁ Verify market structure alignment
⦁ Note automatic SL/TP levels
Step 4: Risk Management
⦁ Default 2:1 risk:reward (adjustable)
⦁ Stop loss: 1.5x ATR from entry
⦁ Position sizing based on stop distance
Best Practices
1. Higher probability setups occur when multiple conditions align
2. Volume confirmation is crucial - avoid signals without volume spikes
3. Trade with structure - longs in bullish, shorts in bearish structure
4. Monitor POC - acts as dynamic support/resistance
5. Confluence zones where OBs, FVGs, and liquidity levels overlap are strongest
Important Notes
⦁ Not a standalone system - combine with your analysis
⦁ Works best in trending markets with clear structure
⦁ Adjust settings based on instrument volatility
⦁ Backtest thoroughly on your specific markets
⦁ Past performance doesn't guarantee future results
Alerts Available
⦁ ICT Buy Signal
⦁ ICT Sell Signal
⦁ Volume Spike Detection
⦁ Liquidity Grab Detection
This indicator provides a systematic approach to ICT concepts, helping traders identify where institutions are entering positions through volume analysis and key price action patterns. The auto-configuration feature ensures optimal settings for your trading style without manual adjustment.
Disclaimer
This tool is for educational and research purposes only. It is not financial advice, nor does it guarantee profitability. All trading involves risk, and users should test thoroughly before applying live.

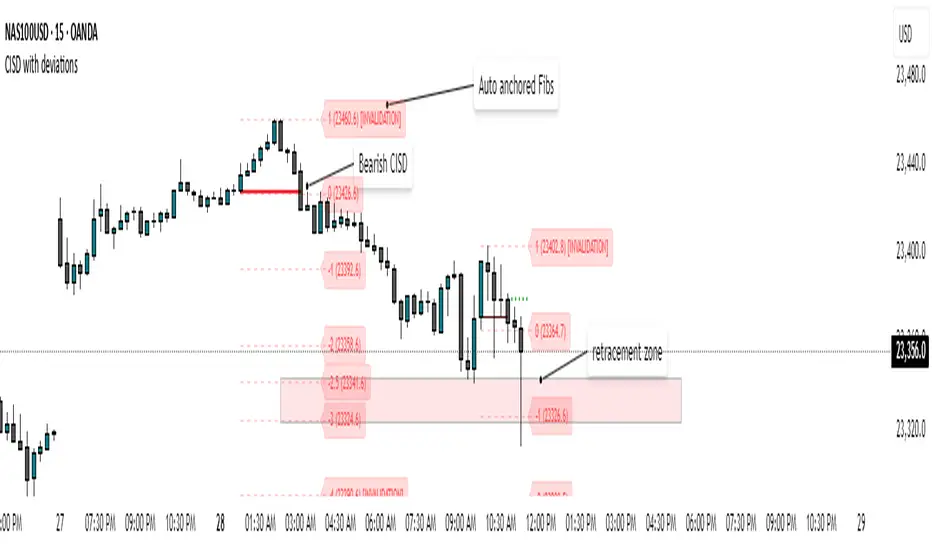
CISD SDICT CISD SD – Manipulation Swing Standard Deviations for Change in State of Delivery
Overview:
The ICT CISD SD indicator is a professional ICT tool designed to define the Manipulation Swing and automatically plot its Standard Deviation levels. Focused on intraday ICT analysis, this script dynamically updates toward the current bar, giving traders precise visual guidance on key swing levels and projected targets.
Key Features:
Define ICT Manipulation Swing:
Set the start and end time to define the Manipulation Swing.
Choose your timezone for accurate ICT intraday tracking.
Automatically calculates the High, Low, and optional Equilibrium (EQ) level of the Manipulation Swing.
Dynamic ICT Manipulation Lines:
Plots High, Low, and optional EQ lines of the Manipulation Swing.
Lines update dynamically with each new bar.
Fully customizable line color, style (solid, dashed, dotted), and width.
Labels feature configurable text color, background color, transparency, size, and placement.
Optional left-side trimming keeps charts clean and readable.
Manipulation Swing Standard Deviation Levels:
Automatically plots Standard Deviation levels as multipliers of the Manipulation Swing range (0.5x to 4.5x by default).
Levels can be plotted up from the swing low or down from the swing high, giving probabilistic target areas or key support/resistance zones.
Customizable line and label styling for all Standard Deviation levels, including color, transparency, width, style, and size.
Optional Shading for Visual Clarity:
Shade areas between the Manipulation Swing and a chosen Standard Deviation level for easy visualization.
Customizable shading color and opacity.
Professional ICT Usability:
Designed for clarity and minimal chart clutter.
Stick labels to the right of the current bar for maximum readability.
Dynamically adjusts with new bars, keeping all Manipulation Swing lines and Standard Deviation levels up-to-date.
Ideal For:
ICT intraday traders analyzing Manipulation Swings for Change in State of Delivery.
Traders seeking visual Standard Deviation levels for breakout, reversal, or continuation strategies.
Analysts who want clean, professional charts with full control over Manipulation Swing and Standard Deviation visualization.
How It Works:
User defines the ICT Manipulation Swing time to identify the swing.
The script calculates the High, Low, and optional EQ of the swing.
Swing lines are drawn and dynamically updated.
Standard Deviation levels are plotted based on user-defined multipliers.
Optional shading can highlight areas from the Manipulation Swing to selected Standard Deviation levels.
Customization Options Include:
ICT Manipulation Swing time and timezone.
Line and label styling for Manipulation Swing and Standard Deviation levels.
Left-side trimming to reduce chart clutter.
Enable/disable EQ line, Standard Deviation levels, and shading.
Direction of Standard Deviation levels (up from low or down from high).
Multipliers and shading transparency for professional ICT charting.
Conclusion:
The ICT CISD StdDev indicator offers a complete, professional solution for ICT intraday analysis, allowing traders to define the Manipulation Swing and visualize its Standard Deviation levels dynamically, enhancing precision and clarity in real-time trading.

ICT Entry Models (Riz)The ICT Entry Models Indicator is a complete framework built to help traders visualize and apply multiple Institutional concepts on a single chart. Instead of relying on one entry technique, this tool combines 14+ ICT entry models and evaluates them under a unified structure. Each model is detected independently but filtered through a multi-factor confluence engine that considers liquidity, higher-timeframe structure, premium/discount zones, and session context. This ensures only high-probability setups are highlighted.
What This Indicator Does
⦁ Detects and plots ICT-based entry models such as: Fair Value Gaps, Order Blocks, Breakers, Liquidity Grabs, Stop Hunts, Asian Range Breakouts, Silver Bullet setups, Power of Three, Judas Swing, Unicorn model, Market Maker models, Previous Day High/Low breaks, and others.
⦁ Automatically validates entries using higher timeframe confirmation and confluence filters.
⦁ Provides risk management tools with structural stop-loss, ATR-based SL, TP1/TP2 targets, and R:R calculations.
⦁ Displays visual trade labels showing direction, strength, and expected risk/reward.
⦁ Includes a performance dashboard that tracks win rates, session stats, and risk outcomes.
How It Works
Each entry model is activated through custom detection logic. The script checks for key conditions like displacement, imbalance, BOS/CHoCH, liquidity sweeps, and premium/discount zones. When multiple models align, the indicator assigns a signal strength rating.
⦁ Weak setups: Highlighted but marked lower confidence.
⦁ Strong setups: Require confluence of liquidity, structure, and time-based filters (e.g., killzones).
⦁ The indicator then calculates a safe stop-loss placement (always on the correct side of price) and take-profit levels based on Goldbach ratios and volatility expansion.
Inputs
⦁ Model Toggles: Enable/disable individual entry models (e.g., FVG only, OB only, or full confluence).
⦁ Confluence Filters: Higher-timeframe structure, premium/discount zones, volatility thresholds.
⦁ Risk Management Settings: ATR multiplier, fixed SL/TP options, R:R target adjustments.
⦁ Dashboard & Visuals: Choose which stats, labels, and levels appear on chart.
How to Use
1. Apply the indicator to any forex, crypto, or index chart.
2. Select your timeframe. For scalping, use 1–5m with HTF confirmation. For day/swing trades, use 15m–1H with HTF overlays.
3. Toggle your preferred entry models (e.g., FVG + Liquidity Sweep) or enable all for confluence.
4. Watch for strong confluence signals: entry marker + calculated SL/TP + dashboard confirmation.
5. Use the signals as decision support not as automated buy/sell triggers.
Notes & Tips
Best used in liquid markets (Majors, Gold, Indices, BTC/ETH).
HTF confirmation greatly improves accuracy e.g., align 1m entries with 15m structure.
Combining time-based models (Silver Bullet, Killzones) with structural models improves precision.
Disclaimer
This tool is for educational and research purposes only. It is not financial advice, nor does it guarantee profitability. All trading involves risk, and users should test thoroughly before applying live.

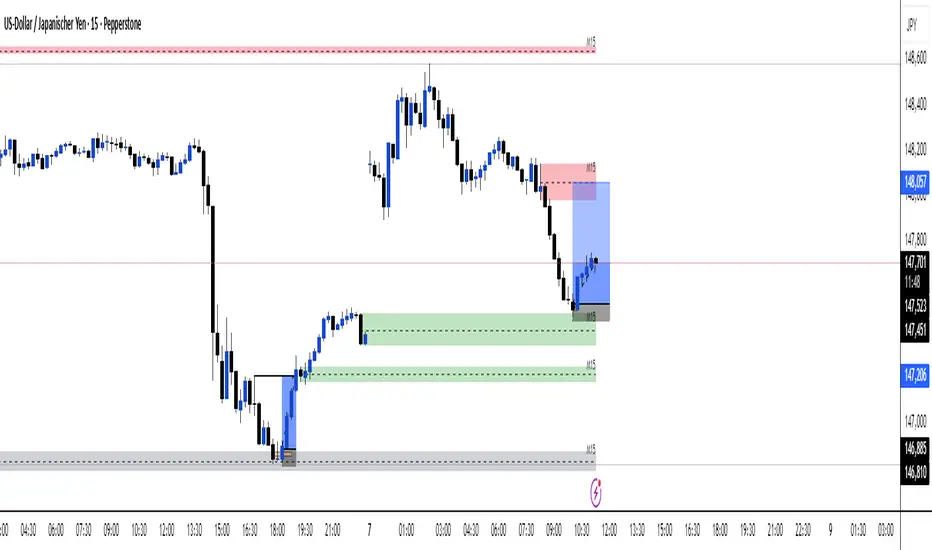
Multi TF - HTF→LTF OrderblocksMulti TF — HTF→LTF Orderblocks
Identify higher-timeframe (HTF) order blocks and project them onto your lower-timeframe (LTF) chart—clean, fast, and publication-ready.
The script automatically detects swing breaks on your chosen HTF, builds the originating order block, and renders that zone on your current chart so you can execute on lower timeframes with higher-timeframe context.
--------------------
How it works
HTF swing structure is tracked via pivot highs/lows and a user-selected break confirmation (Close or Wick).
On a valid break, the script backtracks to the last opposite candle and creates the HTF order block (wick-to-wick or body-only depending on your setting).
The OB is projected to the LTF and extended bar-by-bar until:
Mitigation: price penetrates at least 50% of the zone → the box is marked “old” (dimmed) or optionally auto-deleted.
Close-break: price closes beyond the far edge → zone is optionally removed immediately.
Each zone includes a centerline and an inside label showing the original HTF (e.g., “M15”, “H1”).
Key features
True HTF→LTF overlay: trade M1/M5 with M15/H1/H4 context.
Mitigation logic (≥50%): first meaningful touch turns the zone “old” or deletes it (your choice).
Close-break handling: auto-remove zones broken by close, to keep charts clean.
Overlap control: choose how to handle overlapping zones on the same side:
Keep Latest, Union (merge), or Intersection (refine).
Wicks vs. Bodies: build zones from full candle range or just the body.
Lightweight UI: only the relevant inputs in the panel; sensible defaults.
Alert included: fires on the first 50% mitigation of any fresh zone.
Performance-friendly limits: cap the number of active zones to fit Pine limits.
Inputs (quick overview)
HTF for Order Blocks: timeframe to scan (e.g., 15, 60, 240, D).
Swing Length (Pivot L/R): pivot sensitivity for structure.
Break Confirmation: Close (recommended) or Wick.
Zones use Wicks: on/off for wick-to-wick zones.
OB Lookback before Break: how far to search for the opposite candle.
Max Active Zones: hard cap for chart cleanliness & performance.
Delete on Close-Break: remove zones that are invalidated by a close.
Delete after Mitigation: remove once a 50% touch occurs.
Handle Overlap: None, Keep Latest, Union (merge), Intersection (refine).
Colors & Border: fresh/old zone colors (default ~35% opacity) and optional borders.
Default profile (as shipped):
Break by Close, zones use wicks, Union overlap handling, 250 lookback, 250 max zones, borders off, and HTF label printed inside each zone.
How to use (suggested workflow)
Pick an HTF (e.g., H1 for intraday) and drop to your execution TF (e.g., M5/M1).
Wait for price to tap ≥50% of a fresh OB → look for your LTF trigger (CHOCH, iFVG, PA).
Place SL beyond the zone (or beyond the LTF swing) and manage to your targets (e.g., 2R–3R or to the next HTF OB).
Keep charts clean by enabling Delete on Close-Break and (optionally) Delete after Mitigation.
Alerts
“OB: Zone berührt (Erstkontakt)” — triggers on the first ≥50% mitigation of any fresh zone.
Create additional TradingView alerts with this condition to get notified in real time.
Notes & limitations
Built with request.security(..., lookahead_off) to avoid future-bar peeking; zones only form after a confirmed HTF break.
As with all pattern-based tools, use alongside your risk management and a defined entry model.
Pine has strict limits on drawings; use Max Active Zones to balance coverage and performance.
Credits
Designed for traders who want HTF precision with LTF execution—a clean, opinionated OB overlay that focuses on what matters: fresh zones, first touch, and invalidation.
ICT Sessions & Killzones +PRO (VinceFxBT)ICT Sessions & Killzones +PRO (VinceFxBT)
All in one Session and Killzone script for FX, Futures and Crypto markets. It includes London, New York, CBDR & Asia Sessions and Killzones.
Features
Includes London, New York, Asia, CBDR sessions
Includes all ICT Killzones
Extended session highs/lows up to 90s back, until mitigated.
Set recurring alerts for session highs and lows
Includes Indices price levels and opens
Uses UTC timezones with automatic Daylight Saving Time so NO timezone correction needed ; ) Works out of the box for all regions, including different dates of DST for US/EU.
Session highs/lows displayed on chart as lines, box or background color
Customize line styles, width and colors
Customize colors for Sessions and Killzones
Optionally include weekends for Session or Killzone separately
Optionally display day separators and labels
Fully control which options are displayed at higher or lower timeframes. (e.g. hide sessions when timeframe is 1h or higher)
Session display options
Session Background Color.
Session High & Low Lines, including Session Middle Line.
Extended session highs/lows until mitigated
Extended Session Highs & Lows until mitigated.
Session Background Color with extended Asia Session Highs & Lows until mitigated.
Set recurring alerts for session highs and lows
Set automatic alerts when previous and/or current session levels are broken.

NWOG/NDOG by OutOfOptionsNew Week Opening Gap (NWOG) and New Day Opening Gap (NDOG)
NWOG and NDOG represent price imbalances formed when markets skip over certain levels at the start of a new week or trading day. These gaps often serve as magnets for price action throughout the week or day, drawing prices back to fill them while also functioning as key support or resistance zones. They are particularly relevant in futures markets, though less so in equities.
Consequent Encroachment (CE)
The CE, which is the midpoint of an NWOG or NDOG, frequently emerges as a critical level—especially if the gap remains unbalanced. In such cases, it can exert a strong pull on price, encouraging retracement or consolidation.
Indicator Features
This indicator allows you to display any number of NWOGs and NDOGs directly on your chart, with complete customization of their visual appearance. You can assign distinct colors to the most recent gaps for easy identification. Unlike other tools, it includes a filtering option to exclude minor gaps that may lack significance. Additionally, the "Smart" mode intelligently positions price labels to ensure they remain visible and uncluttered at all times.
How Does it Work
The indicator tracks all daily closes and new day opens, capturing the two values representing the top/bottom of NDOG/NWOG. I If the day begins on a Sunday, the gap is identified as NWOG; otherwise, it is classified as NDOG. A key feature of the indicator is that it avoids duplicating NDOGs that are also NWOGs.
Next, the indicator applies the size filter setting (if set above 0) to skip minor gaps. Valid gaps are then displayed on the screen using a style configured in the indicator settings for the most recent NDOG/NWOG.
To prevent the chart from becoming cluttered, the indicator limits the number of NWOG/NDOGs shown. When a new NWOG/NDOG is added, it checks the total displayed, and if this exceeds the configured limit, the oldest NWOG/NDOG is removed. Additionally, the indicator updates the display style of the previous NWOG/NDOG to the generic (non-last) style as specified in the settings.
For labels showing NWOG/NDOG price ranges and CE, the indicator offers a "Smart" option that dynamically positions labels 10 bars from the last candle and adjusts them every 5 candles. Otherwise, labels are placed at the end of the week for NWOGs and at the end of the following day for NDOGs.

Cnagda Liquidit Trading SystemCnagda Liquidit Trading System helps spot where price is likely to trap traders and reverse, then gives simple, actionable Level to entry, place SL, and take profits with confidence. It blends imbalance zones, trend bias, order blocks, liquidity pools, high-probability fake Signal, and context-aware candle patterns into one clean workflow.
🟩🟥 Imbalance boxes: “Crowd rushed, gaps left”
What it is: Green/red boxes mark fast, one-sided moves where price “skipped” orders—think FVG-like zones that often get revisited.
Why it helps: Price frequently pulls back to “fill” these zones, creating clean retest entries with logical stops.
⏩How to use:
Green box = potential demand retest; Red box = potential supply retest. Enter on pullback into box, not on first impulse. Put stop on far side of box and aim first targets at recent swing points.
↕️ Swing bias (HH/HL vs LH/LL): “Which way is the road?”
What it is: Higher-highs/higher-lows = up-bias; Lower-highs/lower-lows = down-bias. system plots Buy/Sell OB levels aligned with that bias.
Why it helps: Trading with the broader flow reduces “hero trades” against institutions. Bias gives clearer entries and cleaner drawdowns.
⏩How to use:
Up-bias: look for long on Buy OB retests. Down-bias: look for short on Sell OB retests. Wait for a small rejection/engulfing to confirm before triggering.
🧱Order blocks: “Where big players remember”
What it is: last opposite-colored candle before an impulsive move—these zones often hold memory and reaction. system plots these as Buy/Sell OB lines.
Why it helps: Many breakouts pull back to the origin. Good entries often happen on retest, not on the breakout chase.
⏩ How to use:
Let price return into the OB, show wick rejection, and decent volume. Enter with stop beyond OB; define risk-reward before entry.
📊Volume coloring: “How Volume is move?”
What it is: Bar color reflects relative volume; inside bars are black. The dashboard also shows Volume and “Volume vs Prev.”
Why it helps: Patterns without volume often fade; volume validates strength and intent of moves.
⏩ How to use:
Favor entries where imbalance/OB/liquidity-grab coincide with higher volume. If volume is weak, reduce size or skip.
🧲 BSL/SSL liquidity pools: “Fishing for stops”
What it is: Equal highs cluster stops above (BSL); equal lows cluster stops below (SSL). system plots these and highlights the nearest one (“magnet”).
Why it helps: Price often sweeps these pools to trigger stops before reversing. This is a prime trap-reversal location.
⏩ How to use:
Watch nearest BSL/SSL. If price wicks through and closes back inside, anticipate a reversal. Trade reaction, not first poke. When price closes beyond, consider that pool mitigated and move on.
🟢🔴 Advanced liquidity grab: “Catch fakeout”
What it is: Bullish grab = makes a new low beyond a prior low but closes back above it, with a long lower wick, small body, and higher volume. Bearish is mirror. Labeled automatically.
Why it helps: It exposes trap moves (stop hunts) and often precedes true direction.
⏩ How to use:
Best when it aligns with a nearby imbalance/OB and supportive volume. Enter on reversal candle break or on retest. Stop goes beyond sweep wick.
🧠 Smart candlestick patterns (only in right place)
What it is: Engulfing, Hammer, Shooting Star, Hanging Man, Doji (with high volume), Morning/Evening Star, Piercing—but marked “effective” only if context (swing/trend/location) agrees.
Why it helps: same pattern in the wrong place is noise; in the right place, it’s signal.
⏩ How to use:
Location first (BSL/SSL/OB/imbalance), then pattern. Treat pattern as trigger/confirmation—one fresh label shows to keep chart clean.
🧭 Dashboard: “Context in a glance”
⏩ Reversal Level: current swing anchor—expect turns or reactions nearby; great for alerts and planning.
⏩ Volume vs Prev + Volume: Strength meter for signal candle—higher adds conviction.
⏩ Nearest Pool: next “magnet” area—look for sweeps/rejections there.
🧩Step-by-step trading flow (with mindset)
⏩ Set bias: HH/HL = long bias, LH/LL = short bias. Counter-trend only on clean sweeps with strong confirmation.
⏩ Find magnet: Check Nearest Pool (BSL/SSL). Focus attention there; it saves screen time.
⏩ Wait for event: Look for a sweep/grab label, or sharp rejection at pool/OB/imbalance. Avoid FOMO.
⏩ Add confluence: Stack 2–3 of these—imbalance box, OB, contextual pattern, supportive volume.
⏩Plan entry: Bullish: trigger above reversal candle high or take retest of FVG/OB. Stop below sweep wick/zone. Target at least 1:1.5–1:2.
Bearish: mirror above.
⏩Manage smartly: Take partials, move to breakeven or trail thoughtfully. Don’t drag stops inside zone out of emotion.
🎛️ Parameter tuning (to reduce human error)
⏩ swingLen: Smaller = faster but noisier; larger = cleaner but slower. Backtest first, then go live.
⏩ Tolerance (ATR or percent): ATR tolerance adapts to volatility (good for fast markets and lower TFs). Start around 0.15–0.30. In calm markets, try percent 0.05–0.15%.
⏩ minBarsGap: Start with 3–5 so equal highs/lows are truly equal—reduces false pools.
❌Common mistakes → ✅ Better habits
⏩Chasing every breakout → Wait for sweep/rejection, then confirm.
⏩Ignoring volume → Validate strength; cut size or skip on weak volume.
⏩Losing history of pools → If reviewing/backtesting, keep mitigated pools visible (dashed/faded).
⏩Over-tight tolerance/too small swingLen → Increases false signals; backtest to find balance.
📝 checklist (before entry)
⏩ Is there a nearby BSL/SSL and did a sweep/grab happen there?
⏩ Is there a close imbalance/OB that price can retest?
⏩ Do we have an effective pattern plus supportive volume?
⏩Is the stop beyond the wick/zone and RR ≥ 1:1.5?
•?((¯°·._.• 🎀 𝐻𝒶𝓅𝓅𝓎 𝒯𝓇𝒶𝒹𝒾𝓃𝑔 🎀 •._.·°¯((?•

Untouched ExtremesWhat it is
Untouched Extremes plots horizontal levels at green-candle highs and red-candle lows. Each level is considered “untouched” (clean liquidity) until price revisits it; on the first valid touch the line auto-deletes, keeping only live targets on your chart.
How it works (logic)
Bar close event
If close > open, the script draws a line at that bar’s high and extends it to the right.
If close < open, it draws a line at that bar’s low and extends it to the right.
(Optional) Perfect/almost-dojis can be classified as green or red via settings.
Touch & removal
A green-high line is removed when any later bar’s high ≥ level (optionally within a tick tolerance).
A red-low line is removed when any later bar’s low ≤ level (optionally within a tick tolerance).
You can delay deletion by N bars to make the touch visible before the line disappears.
Housekeeping
Maximum active lines per side and line styling are user-configurable.
Why it’s useful
Untouched highs/lows often coincide with resting liquidity and incomplete price probes. Tracking them helps:
Define targets and magnets price may seek.
Frame mean-reversion rotations after a failed push.
Keep the chart clean: only levels that have not been traded are displayed.
How to use it (trading idea)
Confirmation rule: Treat the line as a level/zone. Price can pierce it; wait for a clear reversal candle pattern (e.g., pin bar, engulfing, strong momentum shift) at or immediately after the touch.
Directional play:
If a bullish reversal pattern forms at/around a red-low line, the working assumption is that price will move toward the first untouched upper line (nearest green-high line above). Many traders use that as the primary target.
Conversely, if a bearish reversal pattern forms at/around a green-high line, expect rotation toward the first untouched lower line.
Risk management: Stops typically go just beyond the level or beyond the pattern’s wick. Consider a fixed R:R (e.g., 1:2) and partials at intermediate levels.
Settings
Doji handling: Choose how to classify close ≈ open bars (Green / Red / Ignore). A small equality margin (ticks) helps with rounding on some symbols.
Touch tolerance (ticks): Counts near-misses as touches if desired.
Deletion delay (bars): Wait N bars after creation before a line becomes eligible for deletion.
Max lines per side / width / colors: Keep the view readable.
Tips
Works on any symbol/timeframe; lower TFs produce more levels—adjust Max lines accordingly.
Combining with a trend filter (e.g., EMA-200), ATR distance, or volume clues can improve selectivity.
If spreads or wicks are noisy, increase tolerance slightly and/or use deletion delay to visualize touches.
Note: This tool provides structure and potential targets, not signals by itself. Always require your reversal pattern as confirmation and manage risk appropriately.
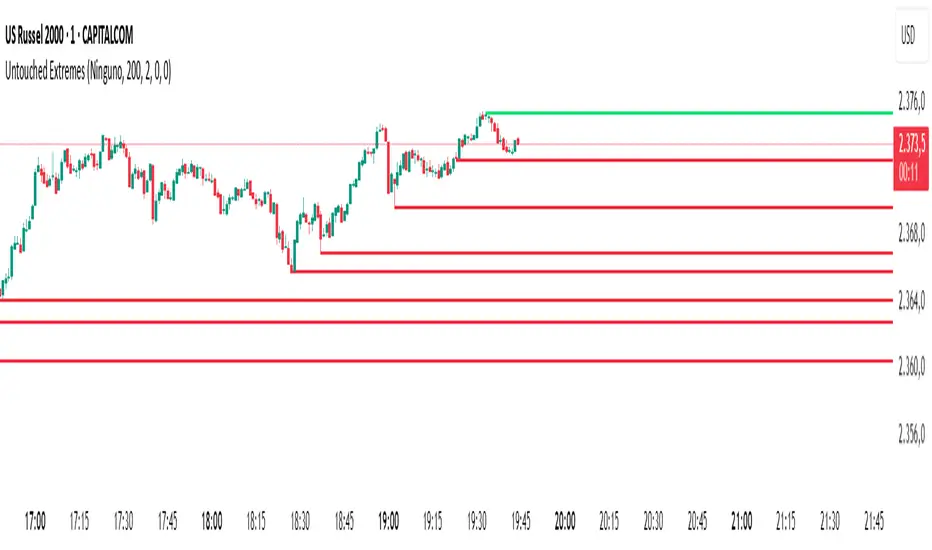
ICT AI ATR Signals [TradingFinder]🔵 Introduction
In financial markets, two main factors always have the greatest impact on traders’ decisions: the direction of the trend and the level of price volatility. Although there are various tools to analyze each of these factors, very few indicators can combine them in a coordinated and simultaneous way.
The ICT AI ATR indicator has been designed with this purpose in mind, to provide a unified and comprehensive view of the market instead of relying on multiple scattered indicators.
This indicator is built upon two widely used tools: the Moving Average (MA) and the Average True Range (ATR). The combination of these two indicators allows traders to simultaneously track the trend direction and account for market volatility two elements that always play a decisive role in trading decisions.
In the structure of the indicator, the Moving Average acts as the central line and serves as the backbone of the tool. By calculating the average price over a defined period, the Moving Average filters out excess market noise and provides a clearer picture of the overall price movement.
This helps traders focus on the main trend instead of being distracted by minor and temporary fluctuations. The central line is thus the main reference point for identifying the trend direction.
Alongside this, the ATR is responsible for measuring the real volatility of the market. Unlike many tools that only look at closing price changes, the ATR considers the true range of candlestick movements, giving a more accurate view of market dynamics.
In the ICT AI ATR indicator, this feature is used to draw dynamic bands above and below the Moving Average line. These bands shift with changing market conditions and act like dynamic support and resistance levels, areas where strong price reactions often occur.
This combination allows traders not only to see the dominant market trend through the Moving Average but also to understand volatility and the natural price range via the ATR. For this reason, the ICT AI ATR identifies points that are likely to act as reaction or reversal zones, whether during bounces off the bands or breakouts through them.
With this structure, the trader can at a glance :
Identify the overall market direction using the Moving Average.
Observe volatility and the natural range of price movement through ATR.
Recognize key levels where strong reactions or potential reversals are more likely.
As a result, the ICT AI ATR functions as a combined tool that replaces the need to use several separate indicators, enabling traders to analyze trend, volatility, price bands, and even Fibonacci targets within a single unified framework.
🔵 How to Use
The ICT AI ATR indicator is designed to simplify market analysis through two main components: visual display of bands and signals on the chart itself, and a multi-symbol analytical dashboard capable of monitoring over 20 different assets simultaneously across multiple timeframes.
This dashboard feature allows traders to gain a quick overview of overall market conditions without opening multiple charts or constantly switching timeframes. It updates in real-time, showing active Buy (Long) and Sell signals for each symbol.
As such, the combination of direct chart display and dashboard analytics makes the indicator useful both for detailed analysis of a single symbol and for monitoring multiple markets at once.
🟣 How do ICT AI ATR trading signals work?
Sell Signal (Short) : Triggered when the price pushes below the lower band (Low goes outside the lower band) and then closes back above it. This indicates potential weakness in bullish momentum and suggests possible selling pressure or the start of a downward correction. Traders can use this to spot sell setups or manage long positions.
Buy Signal (Long) : Triggered when the price extends above the upper band (High goes outside the upper band) and then closes back below it. This often signals exhaustion in bearish pressure and the return of buying strength, potentially marking the start of a new upward move.
This signaling logic is based on the actual behavior of price relative to the ATR dynamic bands. Unlike static formulas, signals adapt to changing market conditions, making them more accurate and reliable.
The main advantage of the ICT AI ATR indicator is that traders can benefit from real-time analysis directly on the chart by observing price interactions with the bands and signals while also receiving a multi-market overview through the dashboard. This combination is especially valuable for traders who operate across multiple instruments or markets simultaneously.
🔵 Settings
🟣 Logical settings
Moving Average Type : Select the type of moving average for the central line. Options include EMA, SMA, RMA, WMA, or HMA depending on the trading strategy.
Moving Average Period : Defines the length of the moving average. Shorter periods make the central line more responsive to price changes, while longer periods smooth out the line to show the broader trend.
ATR Period : Determines the number of candles considered for volatility calculation. Shorter periods increase sensitivity, while longer periods provide a more stable view of volatility.
ATR Multiplier : Sets the distance between the upper/lower bands and the central moving average line. Higher values widen the bands, while lower values bring them closer to price.
Smooth Period: Used to smooth data and reduce chart noise. Higher values produce smoother, more consistent indicator lines.
Signal Gap : Defines the minimum number of candles required between two consecutive signals. This prevents back-to-back signals from appearing too frequently and ensures only the more reliable ones are shown.
🟣 Display Settings
Table on Chart : Allows users to choose the position of the signal dashboard either directly on the chart or below it, depending on their layout preference.
Number of Symbols : Enables users to control how many symbols are displayed in the screener table, from 10 to 20, adjustable in increments of 2 symbols for flexible screening depth.
Table Mode : This setting offers two layout styles for the signal table :
Basic : Mode displays symbols in a single column, using more vertical space.
Extended : Mode arranges symbols in pairs side-by-side, optimizing screen space with a more compact view.
Table Size : Lets you adjust the table’s visual size with options such as: auto, tiny, small, normal, large, huge.
Table Position : Sets the screen location of the table. Choose from 9 possible positions, combining vertical (top, middle, bottom) and horizontal (left, center, right) alignments.
🟣 Symbol Settings
Each of the 10 symbol slots comes with a full set of customizable parameters :
Symbol : Define or select the asset (e.g., XAUUSD, BTCUSD, EURUSD, etc.).
Timeframe : Set your desired timeframe for each symbol (e.g., 15, 60, 240, 1D).
🟣 Alert Settings
Alert : Enables alerts for AAS.
Message Frequency : Determines the frequency of alerts. Options include 'All' (every function call), 'Once Per Bar' (first call within the bar), and 'Once Per Bar Close' (final script execution of the real-time bar). Default is 'Once per Bar'.
Show Alert Time by Time Zone : Configures the time zone for alert messages. Default is 'UTC'.
🔵 Conclusion
The ICT AI ATR indicator, by combining three core elements Moving Average for trend detection, ATR for volatility measurement and dynamic bands, and Fibonacci levels for price targets—provides a multi-layered and intelligent tool for market analysis. In addition to showing accurate bands directly on the chart, it also offers a multi-symbol dashboard that allows traders to monitor signals across different assets and timeframes in real time.
The key advantage of this indicator is that it eliminates the need to use several separate tools by integrating trend, volatility, key levels, and trade signals into one unified framework. For this reason, ICT AI ATR is a reliable and effective choice for both short-term traders seeking quick market moves and long-term traders focused on dynamic support and resistance levels.
Skrip berbayar

20/40/60Displays three consecutive, connected range boxes showing high/low price ranges for customizable periods. Boxes are positioned seamlessly with shared boundaries for continuous price action visualization.
Features
Three Connected Boxes: Red (most recent), Orange (middle), Green (earliest) periods
Customizable Positioning: Set range length and starting offset from current bar
Individual Styling: Custom colors, transparency, and border width for each box
Display Controls: Toggle borders, fills, and line visibility
Use Cases
Range Analysis: Compare volatility across time periods, spot breakouts
Support/Resistance: Use box boundaries as potential S/R levels
Market Structure: Visualize recent price development and trend patterns
Key Settings
Range Length: Bars per box (default: 20)
Starting Offset: Bars back from current to position boxes (default: 0)
Style Options: Colors, borders, and visibility controls for each box
Perfect for traders analyzing consecutive price ranges and comparing current conditions to recent historical periods.

CHart_This FVGThis script will work on any time frame, and auto plots the classic ICT "fair value gaps", or imbalances, that result from a three candle formation wherein the middle candle body extends beyond the highs and lows of the end candles, leaving no overlap of the first and last candle wicks. Bullish imbalances are green, and bearish are red. Plotted zones will automatically close once a candle closure fully violates the imbalance zone with a close beyond its borders.
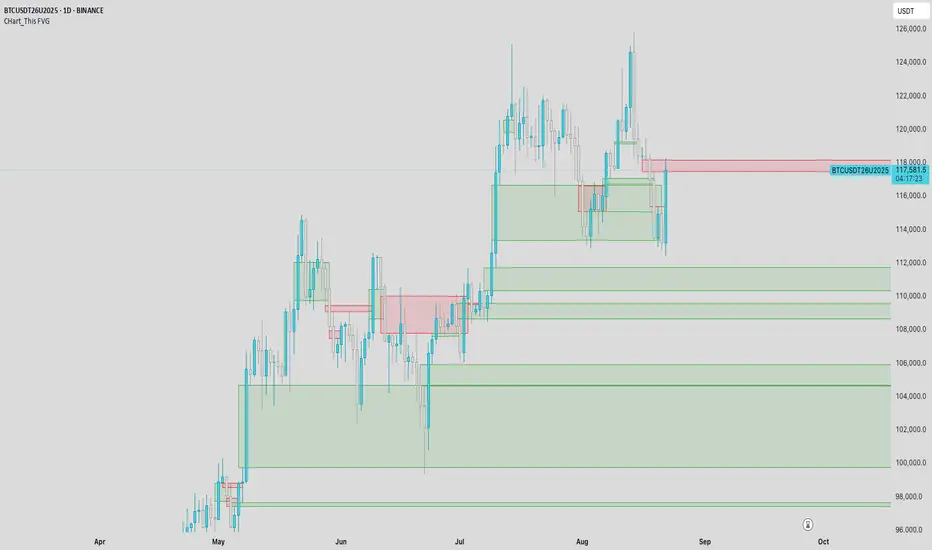
Smart Money Time (SMT)SMT Divergence – 90m / 30m / 10m (Prev-Cycle, Real-Time, Trailing)
Purpose:
This indicator finds SMT (Smart Money Technique) divergences between two related markets (e.g., CME_MINI:NQ1! vs CME_MINI:ES1! ). It does this per 90m/30m/10m cycles and only compares the current cycle to the immediately previous cycle —never older. It supports three cycle granularities:
90-minute cycles (9 blocks from 02:30–16:00 NY time)
30-minute sub-cycles (27 blocks)
10-minute sub-cycles (81 blocks; exactly 3 per 30-minute cycle)
For each cycle, the script tracks each symbol’s extreme (highest high for potential bearish SMT, lowest low for potential bullish SMT). When the leader sets a new extreme vs its own previous cycle while the lagger fails to do so vs its previous cycle, an SMT divergence is formed and plotted on the chart in real time. Lines trail as price makes new extremes within the same cycle.
What you’ll see on the chart:
A line from the previous cycle’s extreme to the current cycle’s extreme on the symbol pane where the indicator is applied (Primary A).
An optional text label at the current extreme (e.g., “90m SMT”, “30m SMT”, “10m SMT”).
Lines update (“trail”) as the current cycle goes on. When a new cycle begins, tracking resets for that cycle.
Default styling (editable):
90m SMT: solid, width 1, black
30m SMT: solid, width 1, black
10m SMT: dotted, width 1, black
You can toggle the text on/off and change width, style, and colors separately for 90m, 30m, and 10m.
Signals (definitions)
Bearish SMT: One market makes a Higher High vs its own previous cycle, while the other fails to make a Higher High vs its previous cycle.
Bullish SMT: One market makes a Lower Low vs its own previous cycle, while the other fails to make a Lower Low vs its previous cycle.
The line is drawn on Primary A by default.
Settings (explained)
Symbols
Primary Symbol A – the chart’s “leader/lagger” pane the script draws on.
Comparison Symbol B – the second market used for SMT checks.
Detection toggles
Detect SMT: 90m / 30m / 10m – turn on/off detection for each timeframe.
Note: The script always compares current cycle ↔ previous cycle only.
Validate candle direction
When enabled, the bar that makes the new extreme must also close in the confirming direction on that same market:
Bearish SMT: the bar that made the new Higher High must be a down close (close < open).
Bullish SMT: the bar that made the new Lower Low must be an up close (close > open).
This filter removes many “wick-only” probes and reduces false positives.
Turn off if you prefer to register SMTs on any intrabar extreme, regardless of bar close.
Delete SMT when invalidated
After an SMT forms, if the lagger later breaks the previous extreme it initially failed to break, the divergence is considered invalid and the script deletes the line and its label. (An “SMT invalidated” alert can fire if alerts are enabled.)
Enable alerts
Fires on SMT formed (separate messages for 90m/30m/10m and bullish/bearish) and on SMT invalidated.
To use, click Create Alert on the indicator and choose “Any alert() function call”. Use “Once per bar” (or per bar close) to taste.
Appearance – per timeframe (90m / 30m / 10m)
Bullish/Bearish colors, Line width, Line style, Show text (toggle subtitle label).
Text Options
Text color, Text size, Text offset (vertical spacing from the extreme).
How to use
Add to chart and select two related markets, e.g., NQ (A) vs ES (B).
Choose which cycles to monitor (90m / 30m / 10m).
Optionally enable Validate candle direction to demand a confirming close on the bar that made the extreme.
Watch for plotted SMTs:
Bearish SMT (HH vs no HH) often signals potential weakness
Bullish SMT (LL vs no LL) often signals potential strength
Use SMTs as context/confluence—e.g., near session highs/lows, liquidity pools, PD arrays, or your own levels. Combine with structure, order flow, and risk rules.
Turn on alerts to be notified when SMTs form or are invalidated in real time.
Notes & behavior
New-York session timing: Cycles are fixed windows in America/New_York and automatically handle DST.
Real-time & trailing: Lines trail to the most recent extreme within the same cycle but there’s no look-ahead across cycles.
No repaint across cycles: Each signal is strictly current cycle vs previous cycle.
Cleanup: On invalidation the script deletes the label first, then the line, preventing orphan labels.
Tips
10m SMTs are more frequent/noisier; 90m are fewer but more meaningful. Many traders look for multi-frame agreement (e.g., a 30m SMT aligning with a fresh 10m SMT).
If you want fewer signals, keep Validate candle direction on; if you want maximum sensitivity, turn it off.
Disclaimer: Educational use only. Markets are risky; do your own research and manage risk responsibly.

CISD with deviationsChange in State Delivery (CISD) is a well-recognized concept and serves as a key signal for identifying market direction through the behavior of CISD levels. In this approach, CISD is applied as the core measure of market structure, removing the variability that comes from user-defined interpretations.
How does it works :
Identifies CISD levels as the market delivers price.
Track whether price respects or violates these levels.
A confirmed shift (change in state) signals a potential transition in trend
Provides a clean structure map to guide execution
How to use it :
1)Align CISD shifts with your higher timeframe bias and the deviation levels marked by the indicator which often serve as the area for retracement or continuations.
2) Use CISD confirmation as a filter for trade entries.
3) Combine with liquidity pools, FVGs, or session timing for added confluence.
Features covered :
1) Automatic Bearish and Bullish CISD plotting.
2) Anchored Fibonacci levels are plotted based on the confirmed CISD. The Fibonacci levels are fixed and cannot be modified by the user because these levels serve a purpose.
3) Alerts can be set up by the users for whenever a bearish/bullish CISD is confirmed.
4) Automatic invalidations are set so that when price invalidates a CISD or hits the -4 level of a CISD as full target level, the CISD is automatically removed.
5) Currently , the maximum CISDs visible are limited to 3 each (bullish and bearish) to avoid cluttering on the chart.