ICT MTF FVG [MK]FVGs (Fair Value Gaps) are significant levels that may act as support or resistance to price. The script finds FVGs as per ICT trading system, then plots the full FVG to the right side of the chart. FVG boxes do not change size when they are semi-mitigated as its important to know where the original FVG midpoint lies. Plotting to the right side of price allows for a cleaner chart. The script is MTF and can display FVG boxes for the following timeframes. Chart, 5,10,15,30,1hr,4hr,8hr,12hr,D,W,M.
Below shows 1hr FVGs marked out. NOTE: this is not what the script does, this is for explanation only.
Below shows what the script will do. 1hr FVGs shown on 15min chart
Ictstudent

ICT MTF Order Block Wicks [MK]Order Blocks are significant levels that may act as support or resistance to price. Often the wick area is where price may react. The script finds order blocks as per ICT trading system, then plots either the top or bottom wick area to the right side of price. Plotting to the right side of price allows for a cleaner chart. The script is MTF and can display order block boxes for the following timeframes. 5,10,15,30,1hr,4hr,8hr,12hr,D,W,M. Only order blocks of a higher timeframe than the current chart can be shown.
Below shows how order block wicks should be drawn on a 1hr chart NOTE: this is not what the indicator does, its only for explanation.
Below shows the same 1hr order blocks, but shown on a 15min chart NOTE: this is the function of this indicator.
Simple ICT Order Blocks and Fair Value Gaps by Gowtham KannakajeThis scripts identifies ICT Order Block and ICT Fair Value Gaps
Fair Value Gap:
- Fair Value Gap toggle is off by default
- Users can choose to color the bars having Fair Value Gaps or can select to define the Fair Value Gap using boxes.
- Bar color and box colors can be customized
Order Blocks:
- Order Block box and candle color toggle is on by default
- Users can choose to color the Order Block candles or can select to define the Order Blocks using boxes.
- Bar color and box colors can be customized for bullish and bearish Order Block separately
Note:
- Order Blocks are considered valid only if the candle forming the Fair Value Gap closes away from the Order Block.
- Since Trading View limits the number of boxes to 500, it is advised to use the Color Candle option to identify the Order Blocks or Fair Value Gaps which are very old.
New concept Definitions:
Naked OB : An order block whose immediate next candle forms a Fair Value Gap. Here, the Order Block high or low contributes to the formation of Fair Value Gap.
Covered OB : An order block whose immediate next candle doesn't form a Fair Value Gap. Here, the Order Block high or low doesn't contribute to the formation of Fair Value Gap. Instead it will have other candles in between the Order Block and Fair Value Gap.
Disclaimer: The usage of this indicator might or might not contribute to your profits and losses and the author is not responsible for the same.
Happy Trading.

ICT Liquidty H/L [MK]indicator shows liquidity levels at pivot highs and lows on the chart timeframe. Levels are drawn as a horizontal line up to the last active bar. Once a level has been passed through, the level is highlighted. The liquidity level will remain highlighted until a pre determined amount of bars have closed after the level was passed. These liquidity levels can be used as targets for trades, or as potential reversal points. Liquidity (or resting orders) at key pivot points form a key part of the ICT trading system. Users can configure the indicator to display the untapped liquidity levels, or they can be completely hidden until they are passed through.
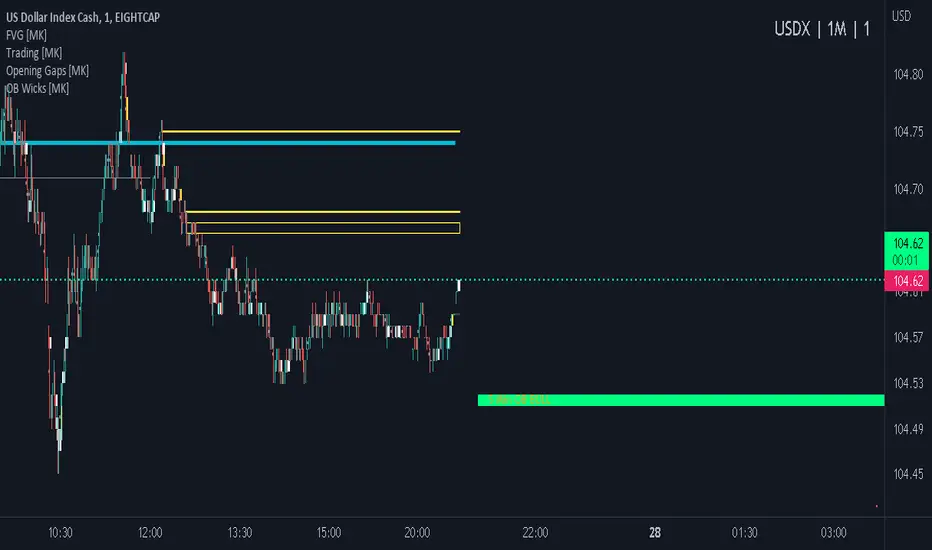
ICT Opening Gaps [MK]
The indicator plots levels which can act as magnets to price. The levels are gap areas which are used within the ICT (The Inner Circle Trader) trading system.
The indicator plots 5 areas of interest:
1: Daily Volume Imbalances - Referencing the Daily chart, boxes are calculated from close to open between all candles. Candles which have only 'wicks' between the close and open prices are considered 'volume imbalances. The boxes can then be shown on LTFs to aid in decision making for intraday traders. Imbalances can be limited to a maximum amount shown and mitigated imbalances can be removed from the chart. All colors can be customised.
Volume Imbalance example:
2: NWOG - New Week Opening Gap - Plotted from Friday Close at 1659 to Sunday Opening at 1800 (EST). The current NWOG can be displayed on its own, or previous weeks can also be shown (ICT recommends the previous 4 weeks also). Boxes are plotted with a midline and all colors can be customised.
New Week Opening Gaps example:
3. NDOG - New Day Opening Gaps - Plotted from day close at 1659 (EST) to restart at 1800 (EST). All colors can be customised. These gaps can be very small so line widths of 3+ are recommended if the lines are to be seen on HTFs
New Day Opening Gap example:
4. New Opening Gap - Plotted from close at 1659 to Session open at 0930 (EST). These areas can possibly be closed/filled after opening at some time. The indicator will draw box to the right of price which shows if the Opening Gap is UP or DOWN. The box will change color to show up or down, or text alone can be used instead of the box. All colors can be customised.
New Opening Gap Box example:
5. 0930 Opening Line - Draws a horizontal line from the opening price at 0930 (EST) to the last bar on the chart. This is the level used to calculate the New Opening Gap. All colors can be customised.
0930 Opening Line example:

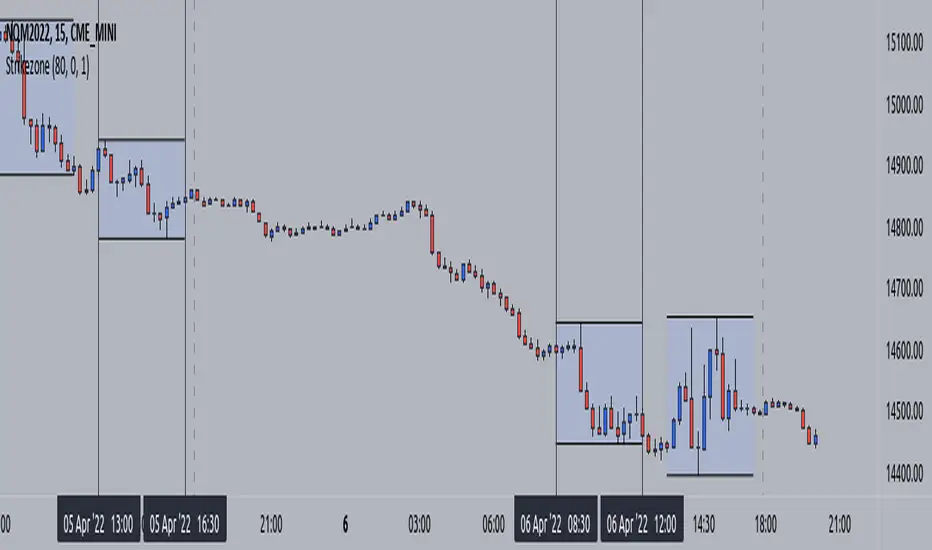
ICT Sessions (Kill Zones)Inspired by the work of ICT (Inner Circle Trader - @ICT_MHuddleston)
What are ICT KillZones:
All ICT students know that certain moments of the day are more indicated to search for good frameworks. These moments are indicated like "Kill Zones".
The best kill zones to search for profittable tradings are during the London session and during the New York session.
How This Indicator Can Help You:
With this indicator you'll see plotted in the charts the London Kill Zone and the New York Kill Zone, you'll see exactly when they start and finish, so you'll be able to understand better the price action and recognize if there are ICT framework to trade. You'll also will see when the New York lunch hour happen (this moment is not favorable for searching frameworks) and you'll see also 2 very important moments of the day, the 8.30 New York Time and the 9.30 New York Time, infact in these 2 particular moments it is most likely that some very profittable framework will appear as there are alway important economic news released in these 2 hours.
Also you'll see the New York Midnight Open, that always forms a very important level for the day trading, you could see the New York Midnight open as a real opening for markets.
Why This Indicator:
I looked for indicators working with these concepts and I could not find one that offered the kill zones sections in the way are showed in my indicator, also they just had the kill zones without showing the 8.30 and 9.30 hours and without the Ney York midnight opening, and these are very important time frames for who works with ICT concepts.
About The Indicator:
In this indicator you'll have displayed:
The regular trading sessions displayed, that is: Asian Session, London Session, New York Session.
The London Kill Zone
The New York Kill Zone
The New York Midnight Open
The New York Lunch Hour
The 8:30 News Release Hour
The 9:30 News Release Hour
All these level can be adjusted and changed as you prefer.

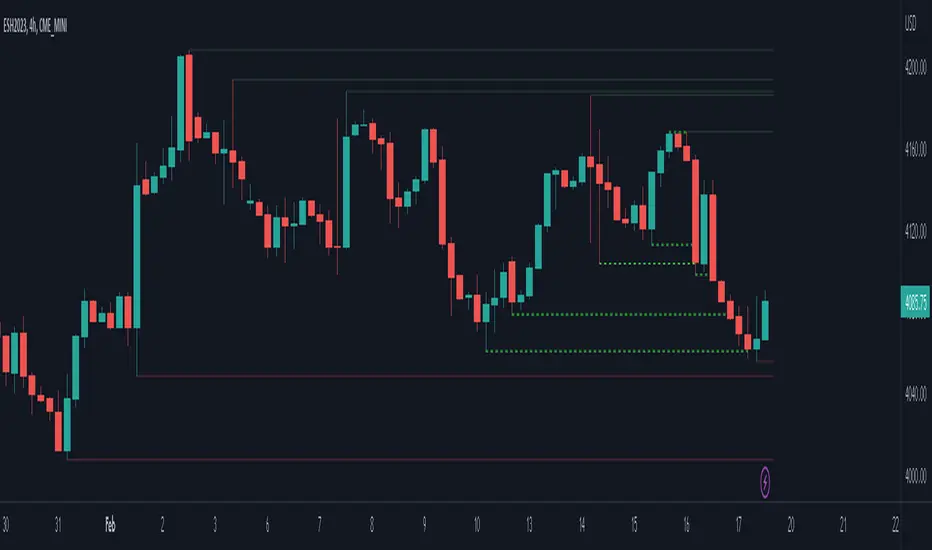
ICT index correlated market indicatorThis is not a real indicator, but is what ICT use as indicator for trading futures indexes.
it can only display SP500, Dow Jon Industrial Average and Nasdaq, if someone want other market can copy the code and change some parameters (is more easy than it can appear)
A good idea is using this other market on backtest to confirm the divergence idea of Linda Raske, than use it to spot quickly in real market.
Another idea published by ICT is the "hidden entry pattern", the entry signal appear in ES or YM but I trade NQ for volatility, so I use the trigger of SP500 or Dow to enter in Nasdaq.
Rember always don't trust anybody, do your own backtest and research!
ICT KillZone [Index futures edition] Guided by new ICT Mentorship I create this versatile timezone or strikezone indicator to identify this without changing timezone (is based on America/New_York timezone, not your current timezone or GMT)
Williams Fractals One// It is same as William fractal default one. I have just modified to provide the fractal UP or DOWN considering one handle on each side other than default two.
// It will help in ICT methods to find the Market structure.
