Buy Sell Entry Filter SYS (SMC IDM LIT)BUY SELL Entry FILTER
An advanced market analysis tool. It provides visual Buy/Sell signals in the form of triangles (▲▼), as well as analytical elements such as Entry/Stop Loss lines, a delta table, overbought and oversold zones, structural market elements with breakouts, displays information from higher time frames, and most importantly, liquidity blocks that trigger reactions. The indicator has a number of built-in filters that help remove unnecessary Buy/Sell signals from the chart. This allows you to create several profitable strategies. You don't need to sit in front of the charts; the alert system (ALERTS) will tell you when to pay attention to the chart and quickly enter a trade.
There are many signals, and the ▲▼ lines themselves are not an entry point. You need to filter them using other tools, such as liquidity blocks (LB and HTF LB), trend, OS/OB, Delta, and Pullback breakout.
If the ▲▼ appears in the right place, for example, in the liquidity block with the correct trend and the correct delta, then you can enter a trade!
Ideally, take short trades of 1/3 – 1/5 RR on a 1-minute timeframe and be sure to set a stop loss.
Remember! You are solely responsible for your deposit!
Buy/Sell, Entry/SL, OS/OB, Filter, EMA, Delta
This main group of settings is responsible for generating buy and sell signals, setting filters, and displaying moving averages.
1. Buy/Sell Main: Enables/disables the display of the main Buy/Sell signal as a ▲▼. This is a specific pattern that identifies potential trend reversals or continuations.
Buy/Sell Simple: Toggles the display of a simplified Buy/Sell signal in the ▲▼ pattern.
This pattern is less powerful than the main one, but works well in certain contexts.
2. Trend Delta Table: Displays a table on the chart showing the cumulative volume delta for the current trend, as well as the percentage. Useful for assessing the strength of a trend.
3. Entry/SL: When enabled, draws horizontal lines on the chart for Entry and Stop Loss.
4. Filters (Delta, Trend, OS/OB, HTF OS/OB):
These filters help filter out false signals. A Buy/Sell signal is displayed only if it passes all enabled filters:
Delta Filter: A signal is generated if the volume percentage delta (set by the user) matches the signal direction (positive for Buy, negative for Sell).
Trend Filter (EMA): A signal is generated if it matches the trend direction.
OS/OB Filter (RSI): A signal is generated if the price where the signal formed is in the desired zone (below Oversold for Buy, above Overbought for Sell).
HTF OS/OB Filter (RSI): Same as OS/OB, but uses the RSI on a higher timeframe (HTF).
EMA 1 & EMA 2: Displays two exponential moving averages on the chart (default 50 and 100). The line color changes (e.g., green if EMA1 is above EMA2).
Overbought/oversold zone
This group configures overbought/oversold levels and zones, both on the current and higher timeframes.
1. OS/OB zone: Enables/disables the display of dynamic overbought (Oversold) and oversold (Overbought) levels. These levels "float," adapting to the current price. 2. Period: Period for calculating zones (default 50)
OS: Level below which the Oversold zone is defined (default 40).
OB: Level above which the Overbought zone is defined (default 60).
Labels: Toggles the display of text labels (--- OB, --- OS) next to the corresponding levels.
Mid: Toggles the display of the center level and its color.
HTF Zones & Labels: Same as for OS/OB, but for levels on a higher timeframe (HTF).
Smooth: Enables smoothing for calculated price levels of zones, making the lines less sharp.
Structure / Breakout line
This setting adds structural analysis elements and breakout lines to the chart. 1. BO Lines (Breakout Lines): Displays horizontal lines on the chart when the price breaks through the external pullback against the trend, thus showing ChoCh.
2. HH/LL: Displays markers (HH - LL - HL - LH) on the chart to indicate key market structural points.________________________________________
Pullbacks EXT/INT
This setting is responsible for the visualization of pullback lines (Pullback) at external (EXT) and internal (INT) levels.
1. Ext (External): Displays lines connecting external extremes (Pullback), showing potential pullback levels.
2. Int (Internal): Displays lines connecting internal extremes (Pullback).
3. Pending Ext/Int: Displays potential pullback lines that may form if the price reaches the next extreme.
Liquidity blocks
Adds visual rectangles (blocks) to the chart, representing potential liquidity zones (where large orders were placed).
1. LB tune: Parameter determining how many candles are used to determine the pattern for a block.
2. High zone: Color of the line inside the block, indicating the strongest part of the block.
3. Show deleted: Shows deleted (broken) blocks in a different color.
4. Volume LB: Enables/disables the display of the volume value in the block.
Quick liquidity blocks
Similar to main blocks, but creates quick blocks. If a quick block is confirmed, it becomes the main LB; if not, it disappears.
1. Quick LB: Enables/disables quick blocks.
2. QLB tune: Pattern length parameter for quick blocks.
HTF liquidity blocks
Displays LB from a higher timeframe (HTF), using the same principles as main blocks. 1. HTF: Enable/disable HTF blocks.
2. Select a timeframe for calculation.
Alerts
A system for alerting you to important indicator actions. Alerts are triggered by certain events.
1. Bull PB Breakout / Bear PB Breakout: Alert when the external pullback is broken and a ChoCh is formed.
2. Trend Change: Alert when a trend changes.
3. New Block: Alert when a new main liquidity block is formed.
4. New HTF Block: Alert when a new HTF liquidity block is formed.
5. Touch Block: Alert when the price of the main liquidity block is touched.
6. Touch HTF Block: Alert when the price of the HTF liquidity block is touched.
7. Touch mode / Touch mode HTF: Select the alert frequency (before or after the bar closes).
This indicator provides a powerful and flexible tool for market analysis, combining several approaches in a single interface.
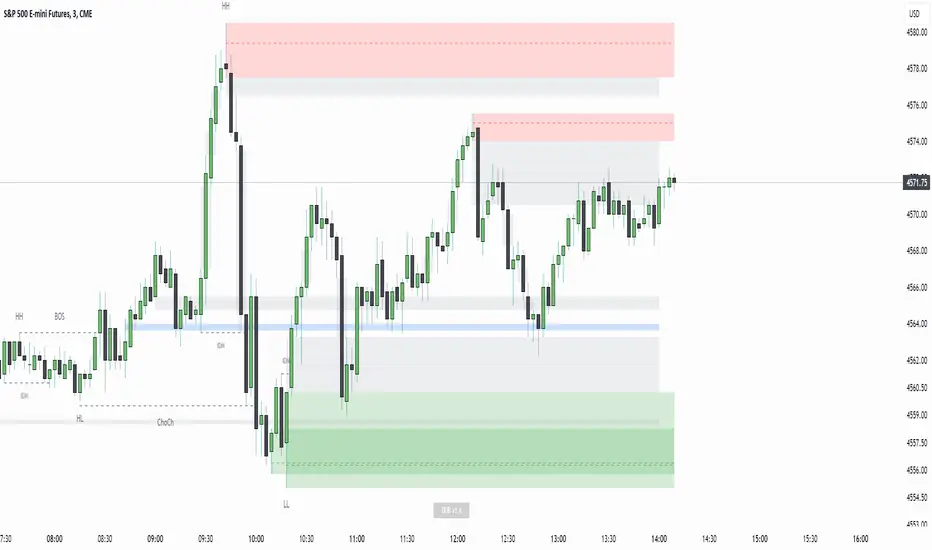
IDM

BOS & CHoCH (v6, UA)The logic of the trading strategy
This is a well-structured and concise summary of a trading strategy based on market structure analysis. Here is the English translation.
Swings
ta.pivothigh/low on a selected structure timeframe (TF). When a swing is confirmed, we fix the level and the bar_index of the current chart as an anchor for a horizontal line.
BOS (Break of Structure)
A breakout of the last Swing High (SH) or Swing Low (SL) in the direction of the current trend.
CHoCH (Change of Character)
A breakout against the trend, signaling a potential trend reversal.
Breakout
By close or by high/low (you can switch the breakout confirmation mode to closing price).

LIT_Globas_sys - Liquidity Inducement Theorem (SMC, IDM)LIT_GLOBAL_SYS Trading Tool Documentation, is a comprehensive market analysis tool that includes all components needed for trading according to Liquidity Inducement Theorem (LIT). LIT differs from classical trading methods and is considered a highly effective and profitable strategy.
What can LIT_GLOBAL_SYS do?
--- Market Structure
The main feature of Liquidity Inducement Theorem is building the correct structure, specifically construction taking into account inducement (IDM). Thus, a new HH or LL can only form when the price has taken the first correct pullback - inducement (IDM), and after this, we understand the location of BoS (break of structure) and CHoCH (change of character).
LIT_GLOBAL_SYS automatically and perfectly displays the correct structure following all LIT rules. Looking at the indicator, a trader always understands which range the price is currently in and where it's trending at the moment. The indicator also shows dynamic (live) levels, providing a clear understanding of the market structure in real-time.
The indicator settings allow customization of each structural element according to trader preferences. For example, you can change the style, color, and shape of structural objects.
--- Correct Pullbacks and Inside Bars
In Liquidity Inducement Theorem, correct pullbacks are fundamental. The structure, order blocks, liquidity levels, order flow, and single candle order blocks (CSOB) are all built based on pullbacks.
What is a pullback?
- When the next candle updates the low of the previous candle, we can finish drawing an upward pullback
- We can start drawing a downward correct pullback when the next candle updates the low of the previous candle
- The downward movement will continue until the opposite occurs - updating the high of the previous candle
There are complexities in determining pullbacks - these are inside bars. In Liquidity Inducement Theorem, inside bars are completely ignored!
For example, in an upward movement, at some point, candles may stop updating the high and low of the previous candle and remain within the boundaries of the previous candle. Theoretically, there could be any number of such candles from 1 to infinity. In such cases, it's important to wait for the price to exit the mother candle (the candle after which other candles remained within its high and low range).
LIT_GLOBAL_SYS easily handles this and displays both pullbacks and inside bars correctly.
--- Order Blocks and Fair Value Gaps (FVG)
In Liquidity Inducement Theorem, order blocks are defined differently from classical order blocks:
1. The order block must take liquidity from the previous candle
2. The order block must have Fair Value Gaps (FVG) before it
3. Inside bars are completely ignored for both Order Blocks and FVG
4. If an OB fulfills the first condition (taking liquidity from the previous candle) but doesn't have FVG before it, this block is moved forward along the candles until there is an imbalance before it
There are two most important order blocks in LIT strategy:
1. Inducement order block (idm ob) - the first order block after Inducement
2. Extreme order block (Ext ob) - the first order block before CHoCH
LIT_GLOBAL_SYS perfectly displays correct order blocks and Fair Value Gaps following all rules. It offers full customization options:
- Specify the number of displayed OBs
- Disable all order blocks except idm ob and Ext ob
- Change block frame color and style
- Disable or modify text display in blocks
--- Single Candle Order Block (Scob)
Rules for building Scob:
1. The candle takes liquidity from the previous candle and closes within the body of the previous candle
2. The candle following the Scob candle must close its body below the previous candle
3. Scob forms in continuation of the trend movement
4. Scob completely ignores inside bars
LIT_GLOBAL_SYS accurately displays Scob as triangles and fully ignores inside bars both left and right. The menu allows complete customization of display and quantity of displayed Scobs.
--- Liquidity Lines, Order Flow, and Three-Minute Rule
Auxiliary functions include:
- Liquidity Lines -
Each pullback is marked with a line, showing where unclosed liquidity exists. Completed lines can be hidden to help predict price movement and enter trades correctly.
- Order Flow -
The indicator implements order flow by drawing a line when a pullback is broken (closed by body) in the opposite direction until the second touch. If price moves away without a second touch, the line remains, showing unclosed OF and potential price return zones.
- Three-Minute Rule -
Some LIT traders use the three-minute rule: price manipulations in the last and first three minutes of each 15-minute candle are additional entry factors, especially in the last quarter of an hourly candle. LIT_GLOBAL_SYS displays this rule only on the one-minute timeframe with symbols below for M15 and H1.
--- Trading Sessions, PDH/PDL, and EMA
The system includes:
- Trading sessions (Tokyo, Frankfurt, London, New York) with customizable time settings
- Previous Day High and Previous Day Low (pdh/pdl) levels
- Exponential Moving Average (EMA) with adjustable length
- Equilibrium display between current BoS and CHoCH levels
--- Alert System
LIT_GLOBAL_SYS includes all necessary alerts for Liquidity Inducement Theorem:
1. SCOB
2. EMA
3. BoS, ChoCh, Sweep
4. IDM
5. IDM OB and Ext OB
Users can simply check the desired alerts in the menu and activate them to receive notifications when price reaches specified zones.

Market Structure Inducements ICT [TradinFinder] CHoch BOS Sweeps🔵 Introduction
Market Structure is the foundation for identifying trends in the market, crucial in technical analysis and strategies like ICT and SMC. Understanding key concepts such as Break of Structure (BOS) and Change of Character (CHOCH) helps traders recognize critical shifts in the market. BOS, referring to a Market Structure Change (BMS), and CHOCH or Market Structure Shift (MSS) signal trend reversals in the market.
Additionally, the concept of Inducement, a vital tool in Smart Money strategies, allows traders to avoid price traps. Identifying valid pullback, valid inducement, POI, and Liquidity Grab helps traders find optimal entry and exit points and leverage Smart Money movements effectively.
Bullish Market Structure :
Bearish Market Structure :
🔵 How to Use
The Market Structure indicator is designed to help traders better understand market structure and detect price traps. By using this indicator, you can identify the right entry and exit points based on structural changes in the market and avoid unprofitable trades. Below, we explain the key concepts and how to apply them in trading.
🟣 Market Structure
Market Structure refers to the overall pattern of price movement in the market. Using this indicator, traders can identify uptrends and downtrends and make better trading decisions based on changes in market structure. The two key concepts here are Break of Structure (BOS) and Change of Character (CHOCH).
Change of Character (CHOCH) : CHOCH occurs when the market shifts from an uptrend to a downtrend or vice versa. These changes typically indicate a broader trend reversal, and the indicator assists you in identifying them accurately.
Break of Structure (BOS) : When the market breaks a key support or resistance level, it signals a change in market structure. This indicator helps you identify these breakouts in time and take advantage of trading opportunities.
🟣 Inducement
Inducement refers to price traps set by Smart Money to trick retail traders into making the wrong trades. This indicator helps you recognize these traps and avoid unprofitable trades.
Valid Inducement : Valid Inducement refers to deliberately created price traps by major market players to gather liquidity from retail traders. Once the market has collected sufficient liquidity, it makes the real move, and professional traders use this moment to enter.
🟣 Valid Pullback
A Valid Pullback refers to a temporary market retracement, indicating a price correction within the main trend. This concept is crucial in technical analysis as it helps traders enter trades at the right time and profit from the continuation of the trend. The Market Structure indicator can identify these valid retracements, allowing traders to enter trades with greater confidence.
🟣 Point of Interest (POI)
Another important concept in market analysis is the Point of Interest (POI), referring to key price areas on the chart. POI includes zones where significant price movements are likely to occur. The Market Structure indicator helps you locate these key points and use them as entry signals for trades.
🟣 Liquidity Grab
Liquidity Grab refers to a scenario where the market intentionally moves to areas where retail traders' stop losses are placed. The goal is to gather liquidity, allowing major players to execute trades at better prices. By using this indicator, you can spot these liquidity grabs and avoid falling into price traps.
🔵 Setting
ChoCh Detector Period : The period of identifying the major market levels that occur when they break ChoCh.
BoS & Liquidity Detector Period : The period of identifying minor levels, which are used to identify BoS and Liquidity levels.
Inducement Detector Period : The period of identification of Inducement levels.
Fast Trend Detector : This feature will help you update the major market structure levels sooner.
Inducement Type Detector : Two modes "Sweeps" and "Total" can be used to identify the levels of Inducement. In "Sweeps" mode only Levels detected by touch shadow. In "Total" mode, all Levels are detected.
🔵 Conclusion
In financial market analysis and forex trading, identifying Market Structure and Inducement is crucial. Market Structure helps you detect uptrends and downtrends, and understand Break of Structure (BOS) and Change of Character (CHOCH). The concept of Inducement also enables traders to spot Smart Money price traps and avoid unprofitable trades.
The Market Structure indicator is a powerful tool that, by analyzing the market structure and concepts like valid pullback and valid inducement, helps you make more precise trade entries. Additionally, by identifying POI and Liquidity Grab, the indicator gives you the ability to spot key market zones and use them to your advantage in trading.

RunRox - Advanced SMC⭐️ Introducing Our Advanced SMC Indicator: Elevate Your Smart Money Concept Trading
We are excited to present our innovative indicator, specifically designed for the Smart Money Concept (SMC). Our approach goes beyond the traditional SMC strategy by offering significant enhancements that can help you achieve stronger trading performance.
We employ a more sophisticated SMC structure, incorporating improved IDM (Inducement) logic, both internal and external structures, and four types of order blocks. This allows for deeper insights into market trends and a clearer understanding of how major market participants may be manipulating price action.
🟠 Indicator Features:
Structure
HTF Structure – Choose any timeframe and display its structure on your current chart.
CHoCH | BOS | IDM – Display any components from this structure.
Market Minor Structure – Swing and Minor structure.
BOS/CHoCH Breaking by (Body | Wick) – Choose the principle for building the structure, either by the candle body or by their wicks.
BOS/CHoCH Move if Swept – When liquidity is taken, decide whether to move the structure line higher or consider it a structural break.
Move CHoCH/BOS – Relocate key points on the chart if the structure becomes too large.
FVG Concept
HTF FVG – Choose any timeframe from which you want to display FVG on your current chart
Three Types of FVG – Classic FVG, Double FVG, Implied Imbalance
Reaction to FVG – Show the market’s reaction to FVG on the chart
Mitigation Method – Select the fill method that suits your approach (Touch/Midline/Complete)
Remove Filled FVG – Remove FVGs from the chart once they have been filled
Combine FVG – Merge several consecutive FVGs into one
Length FVG – Adjust the number of candles that define the FVG
OrderBlock Concept
HTF OrderBlock – Choose any timeframe from which you want to display orderblocks on your current chart
Swing and Minor Orderblocks – Display only the orderblocks you need, whether from the Swing or Minor structure
Four Types of Order Blocks – Advanced OB, Classic OB, BTS/STB zones, Extremum Candle
Block Based on – Decide whether to base the orderblock on candle highs/lows or candle open/close
Mitigation Method – Define when an orderblock is considered filled (Touch/Midline/Complete)
Remove Blocks Older – Remove older orderblocks from the chart
Hide Overlap – Disable overlapping orderblocks when they appear in the same area
Eat Young Blocks – Reduce the size of an orderblock until it fully forms
Hide Distant Blocks – Remove orderblocks that are too far from the current price
Previous Highs & Lows
Four Level Types – Day, Week, Month, Quarter
Style Customization – Choose line color, line style, and transparency
Fibonacci Retracements
10 Template Options – Ten different bases on which you can build your Fibonacci grid
Up to 7 Levels – Add up to seven Fibonacci levels for your convenience
Fibo Inversion – Option to invert the Fibonacci grid
Style Customization – Choose line colors, line styles, and transparency
Additional Functions
Premium & Discount Zones – A popular concept we’ve incorporated to help identify potential trading areas within premium or discount prices
Equal Highs & Lows – High-liquidity levels where market makers may seek liquidity
Color Candles – Automatically colors candles based on the current trend
Market Structure ZigZag – Offers a clear visual of the zigzag pattern on which the structure is built
Key Point Labels – Displays important swing high/low points directly on the chart
General Styling – Customize any chart element, including size, style, color, and transparency
Alert Customization – Over 16 types of alerts, easily configured in a few clicks. Receive only the notifications you need. Custom alerts are also available for developers.
Next, we will provide a detailed overview of all the indicator’s features, accompanied by chart examples.
📈 Structure
What Is IDM?
IDM, or the Institutional Distribution Model, is an advanced concept within SMC that focuses on how institutional players distribute their positions in the market. By analyzing IDM, traders can better anticipate price movements and potential turning points, thereby gaining a meaningful edge in their trading.
In our structure concept, IDM can form under specific conditions. The market does not always provide a high-liquidity point to work with, so we’ve adopted a flexible approach. We generate IDM when a certain type of liquidity appears during the impulse and BOS break, allowing for a potential future liquidity sweep.
Below, I will provide an example that illustrates when IDM forms as a liquidity magnet within the structure - and when it does not.
As shown in the example above, we focus on the initial impulse after the BOS. If liquidity forms during this impulse - liquidity that needs to be taken out during the structural move - we mark an IDM level as a price magnet. However, if this liquidity does not appear, we do not create an IDM. In that case, the same point might serve as an FVG or play a different role, depending on your trading approach.
This concept makes the structure more flexible and better able to respond immediately to market movements and key structural points.
Above is an example on the chart illustrating what the structure looks like both with and without IDM. As you can see, when the structural move includes pullbacks and consolidation, there is an opportunity to form an IDM as a price magnet. However, if the impulses are strong and lack pullbacks, FVG becomes the only magnet in that move. Depending on the chart, our indicator adapts to the current market conditions and highlights potential liquidity collection points.
📊 Swing and Minor Structure
In the new version of the indicator, the minor structure and the swing structure differ from each other.
Swing structure - In this structure, as mentioned earlier, the IDM concept remains a price magnet and is formed at certain points on the chart if the conditions allow. If these points do not appear, IDM might not form at all.
Minor structure - Here, we have completely removed IDM and only kept BOS and CHoCH for structure formation. We found that for a minor structure, this approach allows faster reactions to trend changes, depending on market movements.
By making these adjustments, we have resolved the main issue of the advanced structure, which was the large distance between BOS and CHoCH that sometimes resulted in a month-long consolidation between these levels. In this version, those problems no longer occur.
If, for some reason, your settings result in a larger swing structure, you can still work with the minor structure using the same POI as in the swing structure. OrderBlock and FVG remain the primary drivers of order flow.
Shown above is a screenshot of the main structure settings you can adjust. These settings are highly flexible and can be tailored to fit a wide range of trading preferences.
⚖️ FVG Concept
A new feature of our indicator is the FVG concept. We automatically detect three types of FVG at the moment, which will be explained below.
FVG - the standard Fair Value Gap
Double FVG - a double FVG, also referred to as BPR (Balanced Price Range)
Implied Imbalance - a type of imbalance that arises from buyer or seller demand
Below, we will look at examples of the FVG types we currently identify.
All price inefficiencies work in real time, immediately appearing on the chart and allowing traders to quickly respond to FVG reactions.
We have also enhanced this concept by displaying FVG reactions on the chart. If an FVG triggers a reaction and the price responds to that range, we highlight it on the chart, so you can recognize the reaction and make timely trading decisions. A screenshot below shows how this looks in practice.
Below is a screenshot illustrating the main settings of this concept, along with detailed descriptions.
📦 OrderBlock Concept
OrderBlocks provide an effective way to identify areas of interest and make informed decisions. We have dedicated significant effort to refining this section’s functionality and have achieved strong results in doing so.
Order Block Types
Advanced OrderBlock – A specialized type of order block generated by our internal algorithm. This can help traders aim for tighter entries and potentially more favorable risk-reward ratios within a narrow price range.
OrderBlock – The classic type, formed at the highs or lows of a structure when a BOS or CHoCH occurs. It can still be an effective entry method but typically spans a wider price range.
Extremum Candle – Based on liquidity grabs. The candle creating this order block must collect liquidity before making an impulsive move that breaks the BOS or CHoCH.
BTS / STB (Buy To Sell / Sell To Buy) – This concept may appear when market makers manipulate price to buy or sell an asset. It often covers a larger price range because it relies on a brief impulsive move to form.
Each type of order block has its own strengths and weaknesses. We provide traders with the flexibility to choose which types suit their trading style and preferences.
Above is an example of how you can apply OrderFlow alongside our structure and orderblocks, which can produce solid results when combined with the Smart Money concept.
In this demonstration, we have highlighted the Advanced Orderblock as an illustration.
Above is a screenshot of all the settings related to this section. They can be customized to suit your specific needs, ensuring you only see what is genuinely relevant on your chart.
📏 Previous Highs and Lows
You can select four levels to display on the chart as some of the most liquid zones:
Daily Highs and Lows
Weekly Highs and Lows
Monthly Highs and Lows
Quarterly Highs and Lows
This feature helps you identify important levels on lower timeframes and focus on these zones for potential trading opportunities. Below is an example of how it appears on the chart.
Below, you can see the settings available in this section.
📐 Fibonacci Levels
Likewise, a new section in our indicator is Fibonacci Levels, a well-known tool recognized as a reliable source of important levels on the chart. We have added this functionality with the option to choose how you want to generate these levels and which specific levels you want to display.
You can plot Fibonacci levels based on the Swing structure, Minor structure, previous or current day, month, and more. In total, there are 10 different options for constructing the Fibonacci grid.
Above, you can see an example of how it appears on the chart, and below you will find the settings available in this section.
🈹 Premium and Discount
Another useful feature for all traders is the Premium and Discount zones based on structure. This makes it easy to identify areas of interest—whether in a discount or premium zone, or in an equilibrium area.
Below, you can also see the settings available in this section.
✅ Additional Function
We have also separated a few functions into their own section:
Color Candles – Colors the candles according to the current trend.
Market Structure ZigZag – Visually highlights the zigzag used to form the structure.
Key Point Labels – Displays the points on the chart from which the structure is built.
Equal Highs & Lows – Identifies equal highs and lows as areas of potential liquidity for larger market players, as price often aims to sweep these zones.
Below are a few screenshots showing how these features appear on the chart.
Color Candles
Market Structure ZigZag and Key Point Labels
Equal Highs & Lows
Below, you can see a screenshot displaying all the settings available in this section.
🎨 General Styling
We have devoted considerable effort to providing flexible customization for each element on the chart, so you can design the exact look you want. That’s why we created an additional section where you can adjust any element’s size, style, and more.
Combined with extensive color and transparency options, this feature provides a flexible appearance for the indicator on any chart.
Below, you can see the settings available in this section
🔔 Alert Customization
You can configure over 16 types of reactions to various events on the chart. Additionally, you can set up alerts to trigger at specific fill levels and explore numerous other alert options, as shown in the screenshot below.
🟠 Usage Examples
We have also prepared several examples of how to use the indicator. These are standard entry models taken from the classic Smart Money concept.
First Example
In the screenshot above, the market displays a downward structure until a manipulation occurs, followed by a CHoCH break. This is a standard entry model featuring an entry at the nearest FVG, a stop-loss placed beyond the manipulation, and a target at the nearest liquidity zone—whether session-based or, as in our case, a gap (one of the FVG types) that price commonly revisits.
This is considered a more aggressive entry because we only waited for a single confirmation of the trend change—the CHoCH break—and then entered immediately afterward. While the WinRate might be lower in such trades, the Risk-Reward ratio is typically very high if you correctly identify the manipulation.
Second Example
This approach is more conservative and less risky, typically offering a higher WinRate but with a lower Risk-Reward ratio.
Here, we use the 4H FVG as our decision point (POI). With the indicator, we plot the 4-hour FVG on our current chart without needing to switch back and forth between timeframes.
Once price reaches our POI, we look for an entry model that includes three confirmations:
First Confirmation – A CHoCH break.
Second Confirmation – A manipulation.
Third Confirmation – A second BOS break.
We wait for all these confirmations before entering the trade, ensuring our stop-loss is well-protected since the remaining liquidity has been swept and the 4-hour FVG has been fully filled.
Our target is the full fill of a higher timeframe FVG or other high-liquidity levels below.
In a conservative setup, it is crucial to allow a complete OrderFlow to develop, including manipulations and clear breaks of lower levels. This approach helps protect the trade and often results in a higher WinRate.
🟠 Disclaimer
Past performance is not indicative of future results. To trade successfully, it is crucial to have a thorough understanding of the market context and the specific situation at hand. Always conduct your own research and analysis before making any trading decisions.
To gain access to the indicator, please review the author's instructions below this post

Market Structure with Inducements & Sweeps [LuxAlgo]The Market Structure with Inducements & Sweeps indicator is a unique take on Smart Money Concepts related market structure labels that aims to give traders a more precise interpretation considering various factors.
Compared to traditional market structure scripts that include Change of Character (CHoCH) & Break of Structures (BOS) -- this script also includes the detection of Inducements (IDM) & Sweeps which are major components of determining other structures labeled on the chart.
SMC & price action traders have historically considered this a more accurate representation of market structure by including these components.
🔶 USAGE
Below we can see a diagram for how market structure is displayed within the Market Structure with Inducements & Liquidity indicator.
Change of Characters (CHoCH) are based on swing points detection, while Break of Structures (BOS) are based on trailing maximum & minimums from the detected Change of Characters. We do this for a more dynamic & timely display of market structure.
🔹 Inducements (IDM)
Traders that consider inducements as a part of their analysis of Change of Characters & Break of Structures can more easily avoid fakeouts within trends as shown below.
In this script IDM's are always required between each market structures.
🔹 Sweeps of Liquidity (x)
SMC traders looking to properly analyze market structure need to look for sweeps of liquidity to ensure levels that are wicked are noted as sweeps, while levels that are fully closed above / below are labeled as confirmed market structures.
In the chart below we can see a Sweep of Liquidity which typically can occur on the longer term price action and indicate a potential reversal.
Notably, since labels such as CHoCH or BOS's can occur at the same level as a Sweep of liquidity, we have allowed the indicator to display the market structure label at the current bar in the event this happens.
The Sweeps of Liquidity are also based on trailing maximum / minimum, which allows for a continuous evaluation of areas for liquidity sweeps to occur.
This can be helpful for traders looking for longer term & shorter term sweeps.
🔶 SETTINGS
CHoCH Detection Period: Detection period for CHoCH's, higher values will return longer term CHoCH's.
IDM Detection Period: Detection period for IDM's, higher values will return longer term IDM's.
Thank you all for 500k followers on TradingView! Enjoy!

Displacement Order Blocks ~ DOB [Liquidity_Pro]Displacement Order Blocks (DOB)
This indicator shows order blocks with displacement (FVG required) and leans heavily on ICT’s generous and insightful teachings to define midlines for FVG, IFVG, and order blocks. The market structure definitions follow TradingHub’s (TH) rules filtering out inside bars.
It offers alerts for price in order block, liquidity sweep, break of structure (BOS), change of character (CHoCH), and inducement (IDM).
The TH model was chosen because it's programmatic allowing clear structure definitions that allow us to mark inducements (S/O to @albatherium for publishing the first TH market structure indicator).
TH’s Single Candle Order Block (SCOB) rules have also been helpful in refining order block definition, for example in the Transfer case. ICT fans will see when back testing this, that it moves the focus closer to the FVG.
In developing this indicator, we've tried to offer great aesthetic flexibility, to keep the chart uncluttered and to avoid exceeding Trading View’s limitations on boxes and lines. It's also configured to work reasonably well on both light and dark background charts:
We hope this indicator can serve as a teaching tool for ICT’s price action insights and SMC market structure concepts. For this, we've included optional labels for various order block types:
I = inside bar. The bars that follow the order block have been ignored – you will see the number of ignored bars shown after a hyphen. The idea is that inside bars fall in the shadow of a more important candle and can’t be relied on for defining a trade.
S = standard case. The order block candle takes liquidity from the previous candle and is followed immediately after by an FVG on the next candle. This differs technically from the ICT “last down-close/last up-close” order block concept. In practice, this choice has very little impact on ICT trading, because the ICT trader is entering on the FVG anyway.
T = transfer case. This is an order block that has been transferred from the candle that takes liquidity to the candle just prior to the FVG. When you back test this, you will see it is a high probability choice.
TZ = tweezer. This is an option you can turn off that fills a hole in TH teachings. It bypasses the requirement for an order block to take liquidity from the previous candle in the case of equal h/ls. The result is that you will find 2 candle order blocks with equal highs and lows (also known as tweezer tops/bottoms) show on your chart. You will note that every tweezer is a wick on a higher timeframe.
W = wick. this is a big wick candle that we call an order block without requiring an FVG. The presumption is that the displacement is contained within the wick itself on a lower timeframe.
* Asterisk denotes an extreme order block.
Finally, we trade with this indicator (using it together with our Daye Quarterly Theory ~ DQT free indicator, taking trades when price reaches an extreme FVG or order block during a Q2 manipulation).
We will continue developing it along with other indicators we have not yet published. So please boost if you like this and follow us for updates. Also please let us know what new features you would like to see.
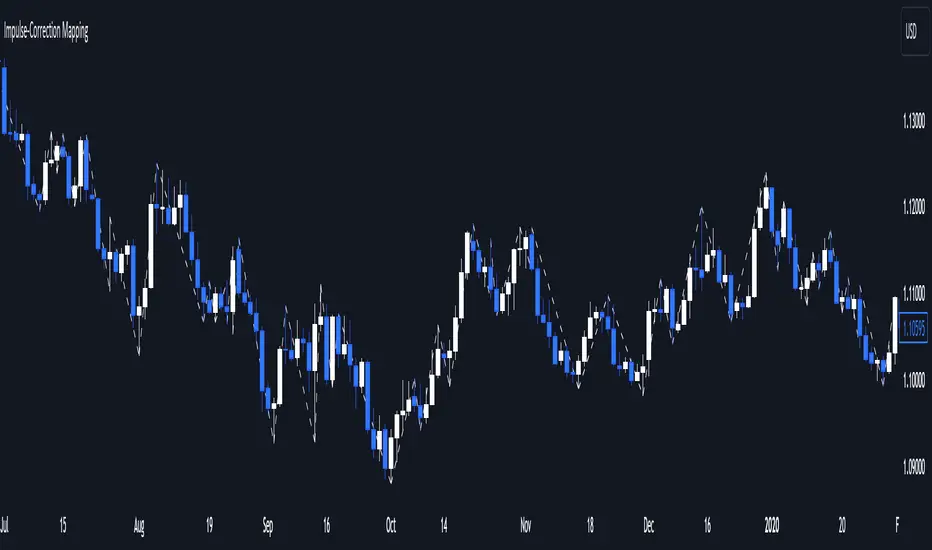
Impulse-Correction MappingAbout
Impulse-Correction Mapper is an indicator of impulses and corrections (valid pullbacks).
Consecutive candlesticks moving in the same direction means an impulse, and a pullback below/above the previous candlestick means a correction.
This way you can identify IDM zones and find significant POIs on the chart.
Below, you can observe valid pullbacks :
And now, the invalid pullbacks :
The impulse and correction shows us the strength of the bulls or bears and also helps us to identify important liquidity areas, including IDMs.
Each high and low of the impulse-correction serves as liquidity for the institutional algorithmic bots.
The indicator can be a self-sufficient tool for market analysis and identification of liquidity swaps. If the price made a liquidity sweep - it can serve as a signal for a reversal to the nearest liquidity area.
When evaluating the daily movement, you can focus on the impulse-correction indicator: if there is a correction - it is very likely that the price will turn around and you can look for a confirmed entry point to the LTF.
The momentum-correction indicator is the basis of the entire Advanced SMC strategy - it is the foundation for determining the market structure.
World Class SMC [WinWorld]This indicator uses valid pullbacks in order to draw market structure with strict accordance to TradingHub strategy.
Features
Our indicator uses a number of price concepts, such as:
IDM
BoS & ChoCh ( also their sweeps )
Automatic resolving of ChoCh-IDM and IDM-BoS conflicts
Orderblocks (IDM, Extreme)
True Fair Value Gaps (FVG)
True PDH/PDL
SCOB pattern
One of the core features is the ability to choose a time point, from which the market structure will be drawn. This feature alone allows you to test your most desired hypotheses about the market movements within a few clicks, so no more guesses and "what if"s, because you get the opportunity to test everything yourself and right now.
Settings
Let's review the settings themselves:
Extended Structure: allows you to choose between drawing market structure for a whole timeline or from specific time point only;
Build OB by sweeps: allows you to only draw orderblocks from candle, which took liquidity from previous candle by sweep;
Structure colours & text: allows you to customise visuals representations of market structure elements on your chart;
Structure visuals: allows you to choose which elements of market structure you want / don't want to see on your chart;
Show trend: allows you to choose the way market structure trend will be displayed on your chart: divider or background colouring ;
Alerts for each and every event , whether it is a new BoS, ChoCh, orderblock and etc.
Usage Examples
IDM Orderblock ( OB-IDM )
Basic demonstration
When price reaches OB-IDM, you will be able to receive an alert. After that, check if the candle, that reached OB-IDM, closed inside or above ( bearish scenario )/ below ( bullish scenario ) OB-IDM's boundaries. If conditions above were met, go on LTF and look for an entry.
Extreme Orderblock ( OB-EXT )
Basic demonstration
Similar to OB-IDM situation: When price reaches OB-EXT, you will be able to receive an alert. After that, check if the candle, that reached OB-EXT, closed inside or above ( bearish scenario )/ below ( bullish scenario ) OB-EXT's boundaries. If conditions above were met, go on LTF and look for an entry.
Sweep PDH/PDL
Basic demonstration
* PDH — Previous Day High
* PDL — Previous Day Low
When you received PDH sweep alert and current trend is bearish, go on LTF to find entry point. ( bullish scenario: PDL sweep and current trend is bullish )
Sweep ChoCh
Basic demonstration
If you get alert of sweeped ChoCh, it usually means that price grabbed the liquidity from extremum points and is ready to continue going with the trend. Go on LTF to find an entry.
