Total Info Indicator by MikePenzin
Install & Add to Chart
• Copy the script into Pine Editor → click Add to Chart .
• Open the ⚙️ Settings → Inputs to customize.
What It Does
• Displays key info in a floating table — trend, volume, ATR, RSI, stop loss, and more.
• Detects breakouts , smart SELL signals , and opening strength .
• Uses emojis and colours to make trends easy to read: 🟢 good, 🟡 neutral, 🔴 risky.
For Swing Traders
• Works best on Daily or 4H charts.
• Watch for 🟢 Uptrend + ⚡BUY / 🔥BUY breakout signals.
• Use ATR-based Stop Loss (shown in table).
• Avoid new entries a few days before earnings.
Suggested Setup
• 20/50/150 MA Lines: ON
• 200 MA Line: optional
• ATR Multiplier: 1.3
• Breakout Detection: ON (Volume + RSI + Trend filters)
• Smart SELLs: ON (RSI 70, EMA 20)
• Pivots: ON for quick swing levels
How to Read
• MA Row: 🟢 = price above MA (bullish).
• ATR/Stop Loss: Suggests where to place protective stop.
• Volume Info: Today’s vs 20-day average, plus pace.
• RSI & CCI: Shows momentum and overbought/oversold levels.
• Breakouts: ⚡BUY (early), 🔥BUY (confirmed).
• Smart SELLs: RSI🔴 / DIV🟣 / EMA🔵 mean potential exit zones.
Example Use
1️⃣ Find stocks with Uptrend 🟢 , rising volume, and ⚡BUY signal.
2️⃣ Enter near breakout; set Stop = shown level.
3️⃣ Take profits or trail when Smart SELLs appear or RSI peaks.
Tips
• Choose table corner under “Table Visualization.”
• Reduce clutter on small timeframes (turn off Pivots/200 MA).
• Use “Volume speed” to spot surging interest before breakouts.
• Compatible with most equities and ETFs.
Disclaimer
This script is for education & analysis only .
Not financial advice — always manage your own risk.
In

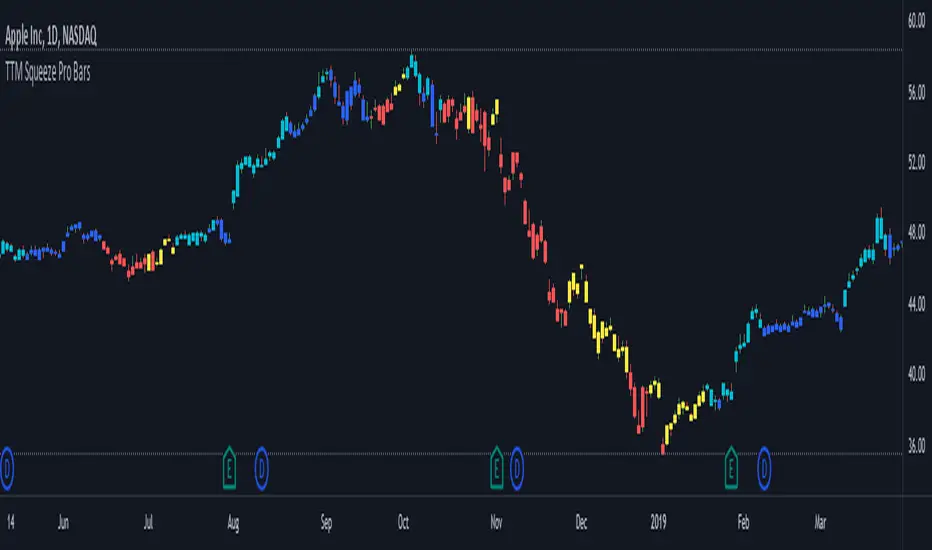
TTM Squeeze Pro BarsCredits:
-> John Carter creating the TTM Squeeze and TTM Squeeze Pro
-> Lazybear's original interpretation of the TTM Squeeze: Squeeze Momentum Indicator
-> Makit0's evolution of Lazybear's script to factor in the TTM Squeeze Pro upgrades - Squeeze PRO Arrows
This is my version of their collective works, with amendments primarily to the Squeeze Conditions to more accurately reflect the color coding used by the official TMM Squeeze Pro indicator.
Rather than having a separate indicator window, the TTM Squeeze Pro is now overlaid on the price bars for easier viewing.
For those unfamiliar with the TTM Squeeze, it is simply a visual way of seeing how Bollinger Bands (standard deviations from a simple moving average ) relate to Keltner Channels ( average true range bands) compared with the momentum of the price action. The concept is that as Bollinger Bands compress within Keltner Channels , price volatility decreases, giving way for a potential explosive price movement up or down.
Differences between the original TTM Squeeze and TTM Squeeze Pro:
-> Both use a 2 standard deviation Bollinger Band ;
-> The original squeeze only used a 1.5 ATR Keltner Channel; and
-> The pro version uses 1.0, 1.5 and 2.0 ATR Keltner Channels .
The pro version therefore helps differentiate between levels of squeeze (compression) as the Bollinger Bands moves through the Keltner Channels i.e. the greater the compression, the more potential for explosive moves - less compression means more squeezing.
The Histogram shows price momentum whereas the colored dots (along the zeroline) show where the Bollinger Bands are in relation to the Keltner Channels:
-> Cyan Bars = positive, increasing momentum;
-> Blue Bars = positive, decreasing momentum (indication of a reversal in price direction);
-> Red Bars = negative, increasing momentum;
-> Yellow Bars = negative, decreasing momentum (indication of a reversal in price direction);
-> Orange Dots = High Compression / large squeeze (One or both of the Bollinger Bands is inside the 1st (1.0 ATR) Keltner Channel);
-> Red Dots = Medium Squeeze (One or both of the Bollinger Bands is inside the 2nd (1.5 ATR) Keltner Channel);
-> Black Dots = Low compression / wide squeeze (One or both of the Bollinger Bands is inside the 3rd (2.0 ATR) Keltner Channels );
-> Green Dots = No Squeeze / Squeeze Fired (One or both of the Bollinger Bands is outside of the 3rd (2.0 ATR) Keltner Channel).
Ideal Scenario:
As the ticker enters the squeeze, black dots would warn of the beginning of a low compression squeeze. As the Bollinger bands continue to constrict within the Keltner Channels , red dots would highlight a medium compression. As the price action and momentum continues to compress an orange dot shows warning of high compression. As price action leaves the squeeze, the coloring would reverse e.g. orange to red to black to green. Any compression squeeze is considered fired at the first green dot that appears.
Note: This is an ideal progression of the different types of squeezes, however any type of squeeze (and color sequence) may appear at anytime, therefore the focus is primarily on the green dots after any type of compression.
Entry and Exit Guide:
-> John Carter recommends entering a position after at least 5 black dots or wait for 1st green dot ; and
-> Exit on second blue or yellow bar or, alternatively, remain in the position after confirming a continuing trend through a separate indicator.
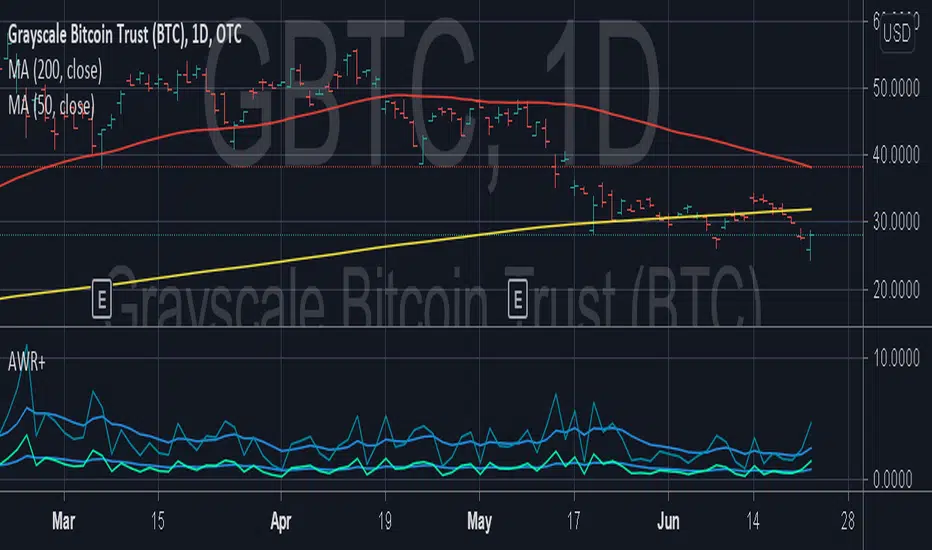
Average Weekly Ranger PlusThis is an updated version of the average weekly ranger which now includes ATR and TR values for the period, as well as the /3 divisor used by scalerz. Just swinging from the trees here. Enjoy. Tarzan.
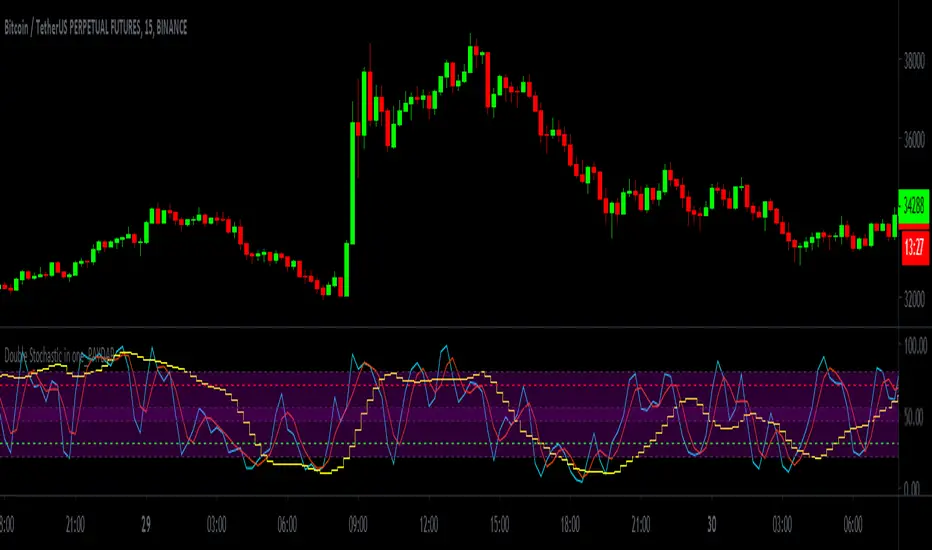
Double Stochastic in one_PAYDARDouble Stochastic in one_PAYDAR
Hello dear friends;
Double Stochastic in one_PAYDAR function:
It actually means that I have used two stochastic oscillators in one oscillator with several lines in different degrees,
First Stochastic: or "Fast Stochastic", as its name implies, is a stochastic oscillator with fast parameters and is capable of detecting small oscillations and small trends.
Second Stochastic : or "slow stochastic" means a stochastic oscillator with slow parameters and is capable of detecting slightly larger fluctuations and trends.
(Of course, here I just put parameter D, because I did not want it to be crowded.)
*** This system just Suggests you for points. ***
_____________________________________________________________________________
How to use this system ( just Suggests you) :
Buy: Whenever the first stochastic (fast stochastic ) crosses in the range of 20 or below and moves upwards, and at the same time the second stochastic (slow stochastic ) moves or crosses the green 30 line, a good time To buy or take a long position.
Sell: Whenever the first stochastic (fast stochastic ) crosses in the range of 80 or above and moves down, and at the same time the second stochastic (slow stochastic ) moves or crosses the red 70 line, a good time For sale or short position.
_____________________________________________________________________________
*** This system just Suggests you for points. ***
My suggestion is not to use this system alone and conclude about entry and exit points according to charts, news, market fluctuations and trend direction.
This system was created by Stochastic Oscillator, which is public and open source on the TradingView site.
***I used the Stochastic Oscillator as a public domain and open source on the TradingView site***
In fast stochastics the values of the parameters are set as fast motion and in slow stochastics the values of the parameters are set as slow motion. In fact, these values of the parameters according to the function and price movement in the candles are fast and slow, and I have determined these values at my suggestion, which, of course, I have consulted with several people.
For easier use and personalization for each person, I have left access to the parameters in this system and you can easily change the parameters as you like and use it optimally for yourself.
Of course, my suggestion is to use the numbers and values of the parameters I have written.
I have put different values, which I think will be very useful for trading swings and even below the daily, but you can change the values of different parameters to your liking.
This oscillator is made of a stochastic oscillator that is open source and public on the TradingView site , of course, due to the changes I have made in the parameter values and the inclusion of two stochastics in one oscillator.
*** In this system, the main and basic oscillators is used, It is available as open source and public on the TradingView site ***
Please comment on the use of this oscillator as well as how to use it and your experiences, I will definitely welcome comments and criticisms.
I am very grateful and very loyal to TradingView ,
Be successful and profitable.
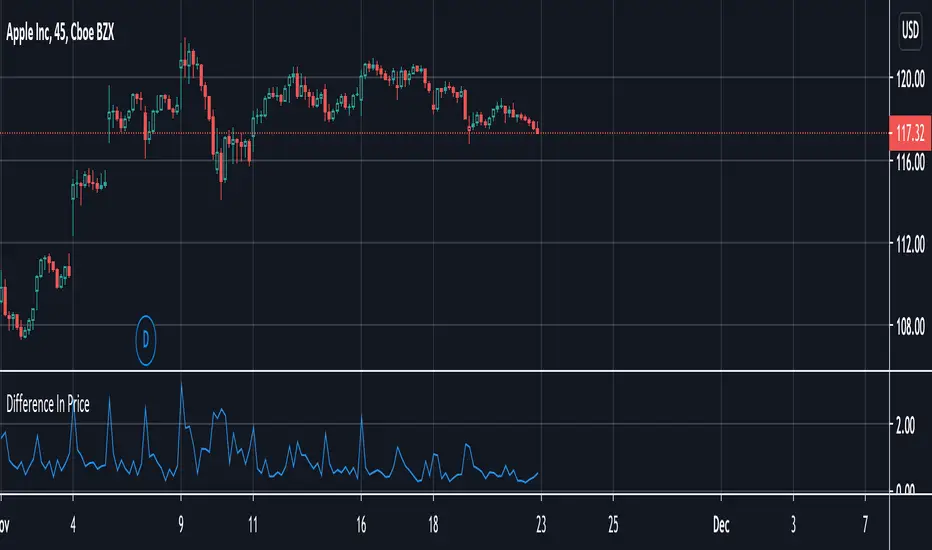
Difference In PriceWith the difference in price indicator, you can view price change volatility. Specifically, you can view the difference in price for a single candle segment, at any desired candlestick timeframe. This simply takes the sessions high minus the low and gives the difference. Difference in price trend lines help determine if a stock has a history of high volatility or not. This is useful for those looking to invest in stable stocks.
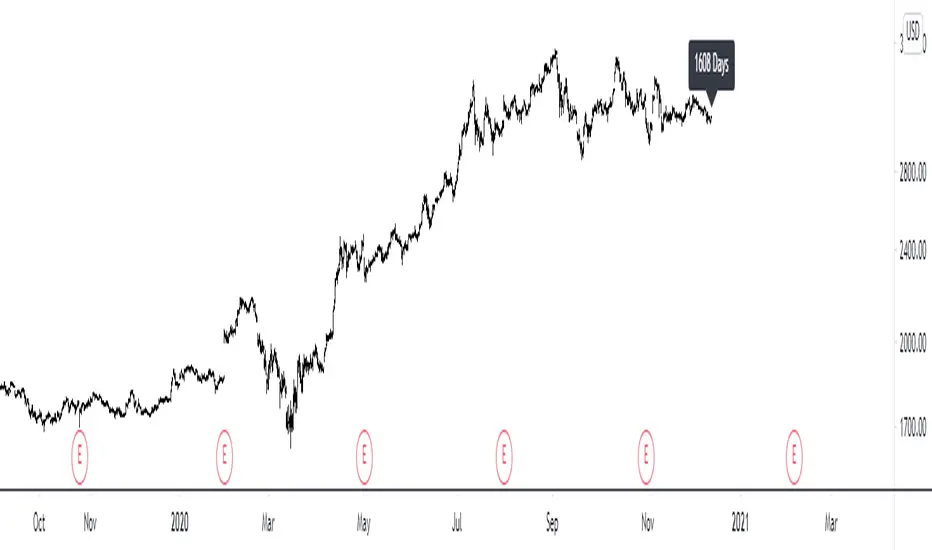
Multi-time-Frame number of days in the chartHelps to see the number of days in any default timeframe chart. (Not yet tested with custom time frames!)
Please like and favorite this script if you like it!
Any donations of tradingview coins to help me buy a tradingview pro membership would also be highly appreciated! Thank you!
Risk indicator 50DSMA/50WSMAIndicates buy and sell zones, intended to be used along with your scaling-in scaling-out strategy.
Example: sell 20% of holdings in first sell zone, sell another 20% in the second zone, etc.

All-In-One EMA Boll Cross SignalsThis one combines many commonly used indicators and signals into one.
1. EMA lines
2. SMA lines
3. Bolling Bands (EMA based)
4. Ichimoku cloud
5. 3/8, 10/20 EMA crosses
6. 5/10 SMA crosses
7. MACD crosses


BTC Volume in FiatThis indicator shows volume in Fiat. You will get wierd numbers if you use it on non BTC-FIAT pairs.

Volume in BTCThis is an experimental script i made for tracking volume in BTC on poloniex pairs. I am not a developer, i hardly even know how to code, so im sure there is a better way! I shared the script on request from someone else. I made the line 100% transparant because i only want the number in the top left. Have a nice day.
