Watermark | Bar Time | Average Daily RangeMulti Info Panel & Watermark
Multi Info Panel & Watermark is a utility indicator that displays several pieces of chart information in a single, customizable panel. It is designed to support intraday and swing analysis by making key data—such as symbol details, date, and average daily range—easy to see at a glance, as well as providing simple tools for notes and backtesting.
Features
Watermark / Custom Note
Optional text overlay that can be used as a watermark or personal note.
Can display a strategy name, reminder, or any other user-defined label on the chart.
Ticker Info
Shows information about the currently active symbol on the chart (for example, symbol name and other basic details depending on the inputs).
Helps keep track of which market or pair is being analyzed, especially when using multiple charts.
Current Date
Displays the current date directly on the chart.
Useful for screenshots, journaling, and documenting analysis.
Average Daily Range (ADR)
Calculates the average daily range of the active symbol over a user-defined number of recent days.
Helps visualize how much price typically moves in a day, which can support position sizing, target setting, or volatility awareness within your own trading approach.
Open Bar Time Marker
Marks the open time of a selected bar (for example, a session open or a specific reference bar).
Primarily intended as a visual aid for manual backtesting and reviewing historical price action.
Usage
Use the watermark and ticker info to keep your charts labeled and organized.
Refer to the ADR readout to understand typical daily volatility of the instrument you are studying.
Use the date and open bar time marker when creating screenshots, trade journals, or when replaying historical sessions for review.
This script does not generate trading signals and does not guarantee any performance or results. It is provided solely as an informational and visualization tool. Always combine it with your own analysis, risk management, and decision-making. Nothing in this indicator or description should be considered financial advice.
INFO

Advanced Crypto Trading Dashboard📊 Advanced Crypto Trading Dashboard
🎯 FULL DESCRIPTION FOR TRADINGVIEW POST:
🚀 WHAT IS THIS DASHBOARD?
This is an advanced multi-timeframe technical analysis dashboard designed specifically for cryptocurrency trading. Unlike basic indicators, this script combines 8 essential metrics into a single visual table, providing a 360º market overview across 4 simultaneous timeframes.
📈 ANALYZED TIMEFRAMES:
- 15M: For scalping and precise entries
- 1H: For short-term swing trades
- 4H: For intermediate analysis and confirmations
- 1D: For macro view and main trend
🎯 ADVANCED METRICS EXPLAINED:
1. 📊 MOMENTUM
- Calculation: Combines RSI (40%) + MACD (30%) + Volume (30%)
- Ratings: Bullish | Neutral ↗ | Neutral ↘ | Bearish
- Use: Identifies the strength of the current movement
2. 📈 TREND
- Calculation: Alignment of EMAs (8, 21, 55) + ADX for strength
- Signals: Strong ↗ | Strong ↘ | Trending | Ranging
- Use: Confirms trend direction and intensity
3. 💰 MONEY FLOW
- Calculation: Money Flow Index (MFI) - advanced RSI with volume
- States: Bullish | Bearish | Overbought | Oversold
- Use: Detects real buying/selling pressure (not just candle color)
4. 🎯 RSI
- Calculation: Traditional 14-period RSI
- Zones: > 70 (Overbought) | < 30 (Oversold) | Neutral
- Use: Identifies price extremes and opportunities
5. ⚡ VOLATILITY
- Calculation: ATR in percentage + state classification
- States: High | Medium | Low + exact %
- Use: Assesses risk and movement potential
6. 🔔 BB SIGNAL
- Calculation: Price position in Bollinger Bands
- Signals: Overbought | Oversold | Neutral
- Use: Confirms extremes and reversal points
7. 🎲 SCORE
- Calculation: Composite score from 0-100 based on all indicators
- Colors: Green (>75) | Yellow (40-75) | Red (<40)
- Use: Quick overall assessment of asset strength
🎨 VISUAL FEATURES:
🌈 SMART COLOR SYSTEM:
- Green: Bullish signals/buy opportunities
- Red: Bearish signals/sell opportunities
- Yellow: Neutral zones/wait for confirmation
- Blue: Neutral technical information
📍 FULL CUSTOMIZATION:
- Position: Left | Center | Right
- Size: Small | Normal | Large
- Emojis: On/Off for professional settings
- Parameters: All periods adjustable
📋 HOW TO INTERPRET:
✅ STRONG BUY SIGNAL:
- Momentum: Bullish
- Trend: Strong ↗
- Money Flow: Bullish
- RSI: 30-70 (healthy zone)
- Score: >60
❌ STRONG SELL SIGNAL:
- Momentum: Bearish
- Trend: Strong ↘
- Money Flow: Bearish
- RSI: >70 or <30 (extremes)
- Score: <40
⚠️ CAUTION ZONE:
- Conflicting signals across timeframes
- Money Flow vs. Trend divergence
- RSI at extremes with average Score
💡 USAGE STRATEGIES:
🎯 SCALPING (15M-1H):
- Check alignment between 15M and 1H
- Enter when both show the same signal
- Use Stop Loss based on volatility
📈 SWING TRADING (1H-4H):
- Confirm trend on 4H
- Enter on pullbacks in 1H
- Target based on overall Score
🏦 POSITION TRADING (4H-1D):
- Focus on 1D analysis
- Use 4H for entry timing
- Hold position until Score reverses
🔧 RECOMMENDED SETTINGS:
👨💼 FOR PROFESSIONAL TRADERS:
- Position: Center
- Size: Normal
- Emojis: Off
- Chart Timeframe: 1H
🎮 FOR BEGINNERS:
- Position: Right
- Size: Large
- Emojis: On
- Chart Timeframe: 4H
⚡ ADVANTAGES OVER OTHER DASHBOARDS:
✅ Precise Calculations: Real MFI vs. "fake buyer volume"
✅ Multi-Timeframe: 4 simultaneous analyses
✅ Composite Score: Overall view in one number
✅ Intuitive Visuals: Clear colors and symbols
✅ Fully Customizable: Adapts to any setup
✅ Zero Repaint: Reliable and stable data
✅ Optimized Performance: Doesn’t lag the chart
🎓 PRACTICAL EXAMPLE:
Asset: BTCUSDT | Timeframe: 1H
| TF | Momentum | Trend | Money Flow | RSI | Score |
|------|----------|------------|------------|-----|-------|
| 15M | Bullish | Strong ↗ | Bullish | 65 | 78 |
| 1H | Neutral↗ | Strong ↗ | Bullish | 58 | 68 |
| 4H | Neutral↘ | Trending | Bearish | 45 | 52 |
| 1D | Bearish | Strong ↘ | Bearish | 35 | 32 |
📊 Interpretation:
- Short-term: Bullish (15M-1H aligned)
- Mid-term: Conflict (4H neutral)
- Long-term: Bearish (1D negative)
- Strategy: Short-term bullish trade with tight stop
🚨 IMPORTANT NOTES:
- This indicator is a support tool, not an automated system
- Always combine with traditional chart analysis
- Test in paper trading before using real money
- Always manage risk with appropriate stop loss
- Not a holy grail - no indicator is 100% accurate
📞 SUPPORT AND FEEDBACK:
Leave your rating and comments! Your feedback helps continuously improve this tool.

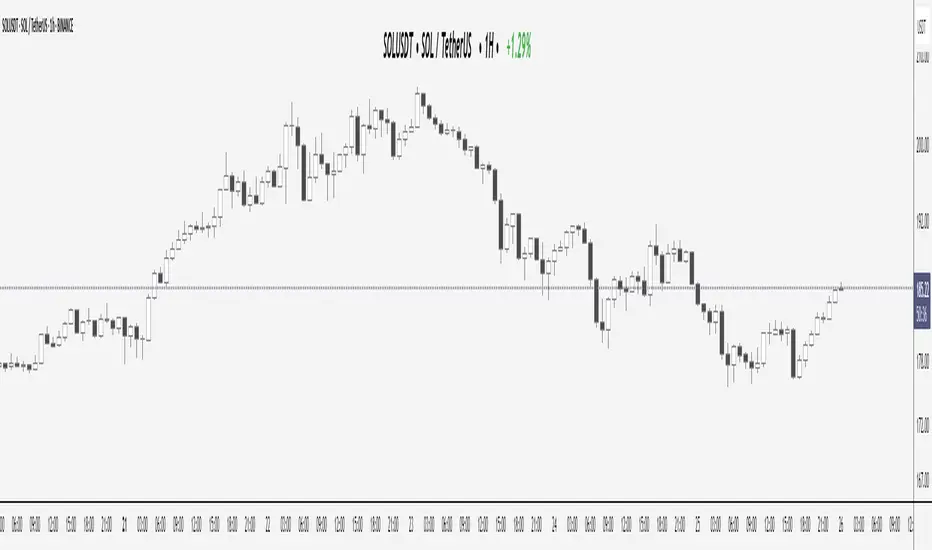
Elite Display# 😎 Elite Display - Simple Chart Info with Style
**Never lose track of what you're looking at!**
A clean, fun way to display your asset name, timeframe, and daily performance directly on your chart. Created by ** ** for traders who like their charts both informative and stylish.
## 📊 **What it shows:**
- Asset name (BTCUSDT) or description (Bitcoin/TetherUS)
- Current timeframe (1H, 4H, 1D, etc.)
- Daily % change with green/red colors
**Example:** `BTCUSDT | 1H | +2.45%`
## 🎨 **Make it yours:**
- **60+ separator styles** - From classic `|` to fun emojis 🚀💎⚡
- **Mood mode** - Separators react to your performance (😄 for gains, 😢 for losses)
- **Position anywhere** - 9 spots on your chart
- **Custom styling** - Colors, fonts, sizes, bold/italic
## 🎯 **Perfect for:**
- Multi-timeframe analysis (never forget which TF you're on!)
- Taking clean screenshots for social media
- Avoiding "wait, what symbol is this?" moments
- Adding a bit of personality to your workspace
## ⚙️ **Super simple setup:**
1. Add to chart
2. Pick what to show (asset/timeframe/both)
3. Choose your style (classic, fun, or reactive mood)
4. Position it wherever you want
5. Done!
**It's just chart info... but way more fun!** 😊
*Works on all markets: Stocks, Crypto, Forex, Commodities*# 📊 TradingHUD - Your Smart Chart Companion
**Transform your charts with the ultimate context display!** Never lose track of your symbol, timeframe, and performance again. This highly customizable indicator brings personality and clarity to your trading workspace.
## 🚀 **Key Features:**
✅ **5 Display Modes:**
- Asset Name (ticker only)
- Full Description (complete name)
- Both combined
- Timeframe Only
- Daily Variation Only
✅ **60+ Separator Styles in 3 Categories:**
- 🎨 **Classic** (15): Professional symbols (|, •, →, ★, etc.)
- 🎉 **Fun** (20): Colorful objects (🚀, 💎, ⚡, 🎯, 💰, etc.)
- 🎭 **Mood** (40+): Reactive yellow faces!
- 😄 **Happy** (21): 😀😊🥰😎🥳 (for green gains)
- 😢 **Sad** (23): 😢😭🥺😞😩 (for red losses)
✅ **Intelligent Variation Display:**
- Daily % change with smart color coding
- Green/red performance tracking
- Only appears on relevant timeframes (intraday + daily)
- Automatically hidden on weekly/monthly
✅ **Ultimate Customization:**
- 9 positioning options anywhere on chart
- Font families: Default or Monospace
- Bold/italic text formatting
- Custom colors and sizes
- Flexible element ordering
## 🎭 **Mood Mode Magic:**
Watch your separators celebrate wins with 😄🤑🚀 or empathize with losses using 😢😭💸. Toggle this emotional feature on/off anytime!
## 💡 **Perfect For:**
- Multi-timeframe analysis
- Screenshot documentation with context
- Avoiding symbol confusion
- Real-time performance tracking
- Adding personality to professional charts
- Social media trading posts
## ⚙️ **Quick Setup:**
1. Add TradingHUD to your chart
2. Select display mode (Asset/Description/Both/etc.)
3. Choose separator style (Classic/Fun/Mood)
4. Position anywhere you want
5. Customize colors, fonts, and formatting
6. Trade with confidence and style!
## 🎯 **Live Examples:**
- **Classic**: `BTCUSDT | 1H | +2.45%`
- **Fun**: `AAPL 🚀 4H 🚀 -1.23%`
- **Happy Mood**: `Gold 😄 1D 😄 +3.67%`
- **Sad Mood**: `BTC 😢 15min 😢 -5.12%`
**Professional meets personality. Context meets creativity. This is TradingHUD.** 📈✨
*Compatible with all markets: Stocks, Crypto, Forex, Commodities, Indices*
EMA 200 Monitor - Bybit CoinsEMA 200 Monitor - Bybit Coins
📊 OVERVIEW
The EMA 200 Monitor - Bybit Coins is an advanced indicator that automatically monitors 30 of the top cryptocurrencies traded on Bybit, alerting you when they are close to the 200-period Exponential Moving Average on the 4-hour timeframe.
This indicator was developed especially for traders who use the EMA 200 as a key support/resistance level in their swing trading and position trading strategies.
🎯 WHAT IT'S FOR
Multi-Asset Monitoring: Simultaneous monitoring of 30 cryptocurrencies without having to switch between charts
Opportunity Identification: Detects when coins are approaching the 200 EMA, a crucial technical level
Automated Alerts: Real-time notifications when a coin reaches the configured proximity
Time Efficiency: Eliminates the need to manually check chart collections
⚙️ HOW IT WORKS
Main Functionality
The indicator uses the request.security() function to fetch price data and calculate the 200 EMA of each monitored asset. With each new bar, the script:
Calculates the distance between the current price and the 200 EMA for each coin
Identifies proximity based on the configured percentage (default: 2%)
Displays results in a table organized on the chart
Generates automatic alerts when proximity is detected
Monitored Coins
Major : BTC, ETH, BNB, ADA, XRP, SOL, DOT, DOGE, AVAX
DeFi : UNI, LINK, ATOM, ICP, NEAR, OP, ARB, INJ
Memecoins : SHIB, PEPE, WIF, BONK, FLOKI
Emerging : SUI, TON, APT, POL (ex-MATIC)
📋 AVAILABLE SETTINGS
Adjustable Parameters
EMA Length (Default: 200): Exponential Moving Average Period
Proximity Percentage (Default: 2%): Distance in percentage to consider "close"
Show Table (Default: Active): Show/hide results table
Table Position: Position of the table on the chart (9 options available)
Color System
🔴 Red: Distance ≤ 1% (very close)
🟠 Orange: Distance ≤ 1.5% (close)
🟡 Yellow: Distance ≤ 2% (approaching)
🚀 HOW TO USE
Initial Configuration
Add the indicator to the 4-hour timeframe chart
Set the parameters according to your strategy
Position the table where there is no graphic preference
Setting Alerts
Click "Create Alert" in TradingView
Select the "EMA 200 Monitor" indicator
Set the notification frequency and method
Activate the alert to receive automatic notifications
Results Interpretation
The table shows:
Coin: Asset name (e.g. BTC, ETH)
Price: Current currency quote
EMA 200: Current value of the moving average
Distance: Percentage of proximity to the core code
💡 STRATEGIES TO USE
Reversal Trading
Entry: When price touches or approaches the EMA 200
Stop: Below/above the EMA with a safety margin
Target: Previous resistance/support levels
Breakout Trading
Monitoring: Watch for currencies consolidating near the EMA 200
Entry: When the media is finally broken
Confirmation: Volume and close above/below the EMA
Swing Trading
Identification: Use the monitor to detect setups in formation
Timing: Wait for the EMA 200 to approach for detailed analysis
Management: Use the EMA as a reference for stops dynamics
⚠️ IMPORTANT CONSIDERATIONS
Technical Limitations
Request Bybit data: Access to exchange symbols required
Specific timeframe: Optimized for 4-hour analysis
Minimum delay: Data updated with each new bar
Usage Recommendations
Combine with technical analysis: Use together with other indicators
Confirm the configuration: Check the graphic patterns before trading
Manage risk: Always use stop loss and adequate position sizing
Backtesting: Test your strategy before applying with real capital
Disclaimer
This indicator is a technical analysis tool and does not constitute investment advice. Always do your own analysis and manage detailed information about the risks of your operations.
🔧 TECHNICAL INFORMATION
Pine Script version: v6
Type: Indicator (overlay=true)
Compatibility: All TradingView plans
Resources used: request.security(), arrays, tables
Performance: Optimized for multiple simultaneous queries
📈 COMPETITIVE ADVANTAGES
✅ Simultaneous monitoring of 30 major assets ✅ Clear visual interface with intuitive core system ✅ Customizable alerts for different details ✅ Optimized code for maximum performance ✅ Flexible configuration adaptable to different strategies ✅ Real-time update without the need for manual refresh
Developed for traders who value efficiency and accuracy in identifying market opportunities based on the EMA 20

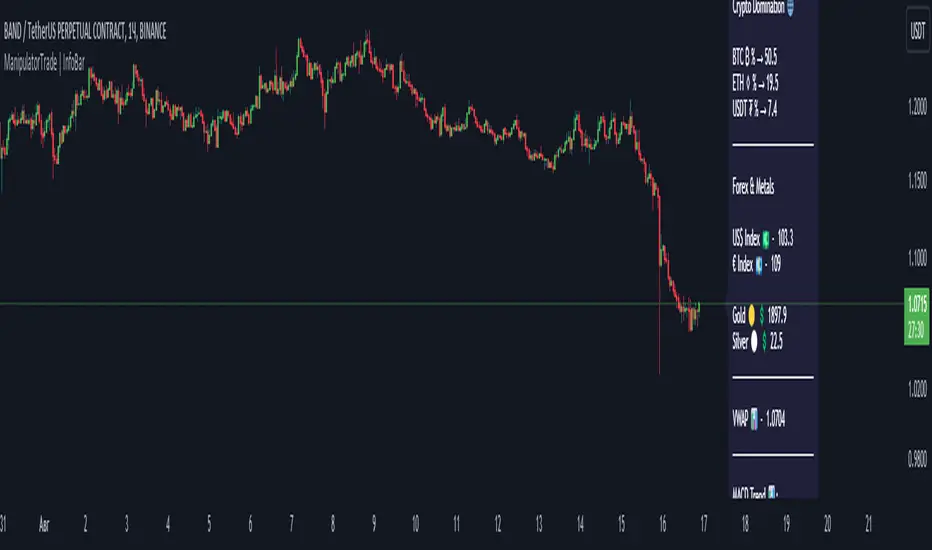
ManipulatorTrade | InfoBarEnglish
With this indicator, you can track the instrument selected in the settings, there is also RSI, MACD, Stochastic. The InfoBar will show you overbought or oversold, as well as the trend in MACD.
You can track crypto dominance: BTC, ETH, USDT.
Also keep an eye on indices and metals.
There is VWAP which shows the average price weighted by volume over a certain period. All settings can be changed.
Українська
За допомогою даного індикатора ви можете відстежувати інструмент вибраний в налаштуваннях, так само є RSI, MACD, Stochastic. InfoBar вам покаже перекупленність або перепроданість, так само тренд в MACD.
Ви можете відстежувати крипто домінацію: BTC, ETH, USDT.
Так само слідкувати за індексами та металами.
Є VWAP, який показує середню ціну, виважену за обсягом за певний період. Усі налаштування можна змінити.
Русский
С помощью данного индикатора вы можете отслеживать инструмент выбранный в настройках, так же есть RSI, MACD, Stochastic. InfoBar вам покажет перекупленностть или перепроданность, так же тренд в MACD.
Вы можете отслеживать крипто доминацию: BTC, ETH, USDT.
Так же следить за индексами и металлами.
Есть VWAP который показывает среднюю цену, взвешенную по объему за определенный период. Все настройки можно изменить.
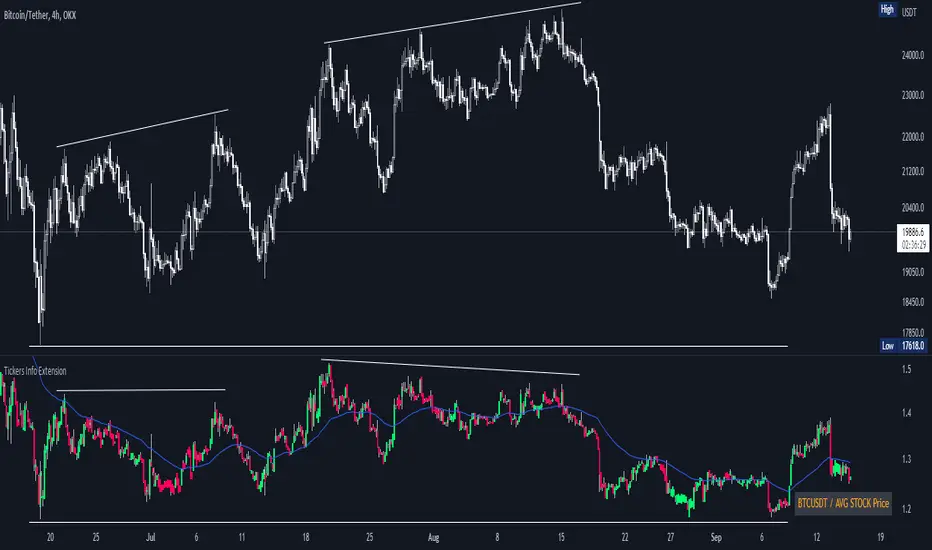
Tickers Info ExtensionWith the indicator you can easily evaluate or compare any ticker with the one you choose in the options.
You can choose any of the tickers I provide in the mod options to your liking :
XAU
DXY
BTC
ETH
SPX
NASDAQ
AVG Stable Dominance
AVG Stock Price
Custom
You can also select or create your own ticker if you select the Custom in Mode option.
If the Compare mode is enabled, then the current ticker you are viewing is divided by the ticker selected in the indicator (in the Mode option).
Thus, you create a new pair and can evaluate the strength of this or that asset.
For example, if you have the ticker BTCUSDT open. And the ticker XAU is selected in the Mode option in the indicator. And the Compare mode is also enabled. Then you will get a new BTCUSDT/XAU pair. That means that now you can see the bitcoin/gold ratio. (Same as EUR/USD etc.)
If the Compare option is switched off then you will see the usual ticker you choose in the Mode option. You can also see if there is a correlation between the selected pairs.
Option ' AVG STABLE.D ' = Calculated as: USDT.D + USDC.D + DAI.D
- This is the average domination of the most important Stable Coins
Option ' AVG STOCK Price ' = Calculated as: (DJI + SPX + NDQ) / 3
- This is the average price of the most important Indexes.
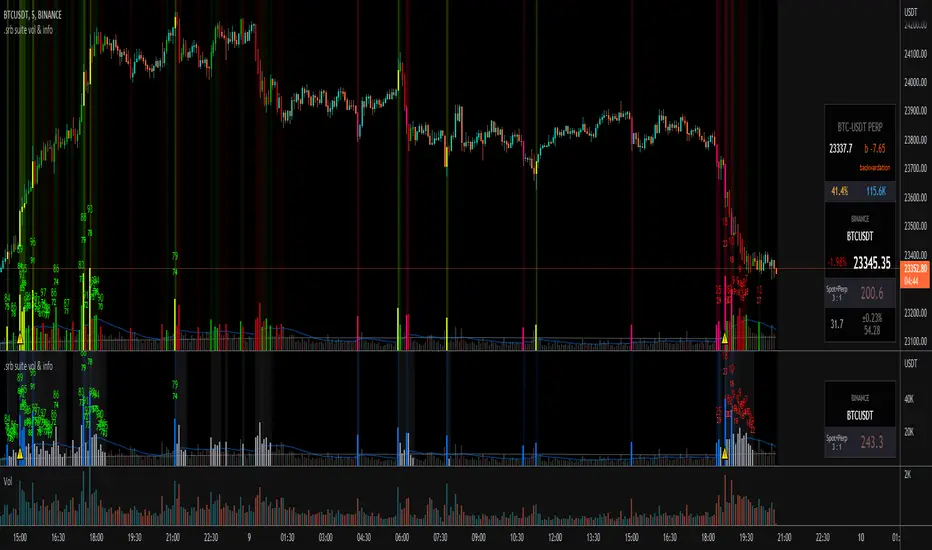
.srb suite vol & infoThe volume indicator
what can replace the built-in volume indicator and It also has some useful features.
and designed to work as overlay in the same pane with open-source indicator by default.
Regular volume Indicator
Volume SMA plot
Large Volume ! emphasize by color & mark.
Ultra Volume ! overlay marking ; x2 x4 x6 lager than regular average volume. it will help you can take the reversal
BTC-agg. Volume
4 BTC-spot & 4 BTC-PERP volume aggregated.
It might helps you don't miss out on important volume flows.
Weighted to spot trading volume when using PERP+spot volume.
If enabled, BTC-agg.Vol automatically applied when selecting BTC-pair.
Information panel (optimized for crypto-currency)
BTC-PERP price & delta (when Binance:BTCUSDT selected)
BTC dominance, Binance:BTCUSDTPERP OI
Symbol, Price, Daily up/down
ATR14 (for checking current volatility)
Recommended setup for .srb suite
tradingview | chart setting > Appearance > Top margin 0%, Bottom margin 0% for optimized screen usage
tradingview | chart setting > Appearance > Right margin 57
.srb suite vol & info --> Visual Order > Bring to Front
.srb suite vol & info --> Pin to scale > No scale (Full-screen)
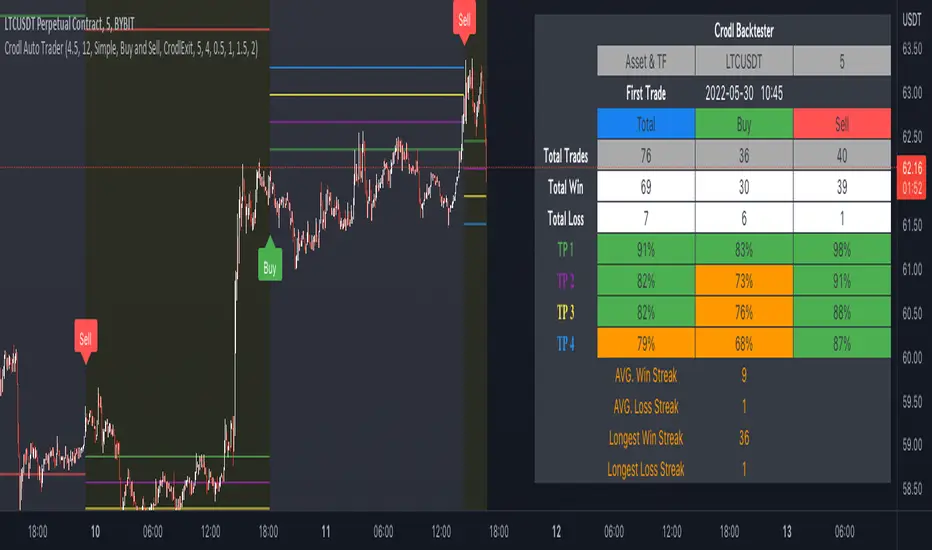
Crodl Auto TraderI've added Buy & Sell Flags - They will be used to add Longs and Shorts Flags as well as the ability to add alerts on them.
What triggers the Buy signal?
Buy signal = This indicator make use of the rsi (Relative Strength Index) to look at specific overbought and oversold levels as confirmation if it is an uptrend and not overbought yet. This will indicate that a long opportunity will be possible.
The SMA (slow moving average) is being used to calculate where to entry as it uses Crossed SMA's for entries.
SMA and EMA Crosses with the RSI (not overbought) will give as a buy signal if the SMA cross the EMA.
Sell signal = When the Rsi is not oversold this will give a good confirmation that the market still has downwards potential and it will wait for a cross on the SMA and EMA when crossed over for a sell signal. If we get a cross but the RSI is oversold that will be seen as a bad signal and it will be avoided.
Take Profit - Currently there are 4 Hardcoded Targets and on the backtester you will see the results for all 4 separately on the Info Panel.
The 4 green lines (TP)
1st line is at 0.5% market move, 2nd line is at 1% market move ,3rd one is at 1.5% market move and the last and 4th line is at 2%.
This will be where it will take profit unless you set the Exit Strategy to Opposite then it will use the opposite flags to exit.
So when it is set to Opposite and the previous flag was a long then it will exit on the next short flag and when the previous flag was a short flag then it will exit on the next long flag.
if the exit strategy is set to CrodlExit it will use an ATR based exit. so if the previous flag was a short it will wait for price to cross an ATR level then it will close the short and the same if the last flag was a long it will only be closed if a TP (green line) level has been reached or the ATR level for an exit.
if the Exit Strategy has been set to Fixed SL then you can set the sl at a specific %. if you set the Fixed SL at 2% that means if the last flag was a buy signal then if the TP targets was not reached first and the market moves downwards by 2% it will exit and wait for the next flag, if you are in a short and the TP level was not reached if the market moves 2% upwards it will close your short.
Backtest Data has 3 options. You can choose for it to show both Long(Buy) and short(sell) or just Buy or just Sell data.
Statistics Type will show you the info panel on the right. if you set it on Simple you will see the following data
Asset that you are currently on as well as the timeframe.
and the date it starts reading data to plot entries from. this will change depending on the timeframe that you are on. since higher timeframes will show you candles from longer time back as lower time frames.
Total = The amount of buy and sell flags since the first trade data and buy will give you the buy amount flags shown since that date and sell will show you the amount of sell flags since the start date.
Total win = this will tell you how many trades reached the TP (green lines) before a exit condition was met.
Total loss = this will show you how many of the flags exited based on the exit type selected before a TP target was reached.
TP1= how many time we reached the first target level at 0.5%
TP2= how many time we reached the second target level at 1.0%
TP3= how many time we reached the third target level at 1.5%
TP4= how many time we reached the fourth target level at 2.0%
the % are calculated from the total wins and total losses and it will give you the % difference.
If the % is bigger than 80 it will have a green background and if its less than 80% but more than 50% then it will be orange, if it is less than 50% it will be red.
win streak is the average of how many times we reached the profit target in a row before we reached an exit target based on the exit strategy
Loss streak is the average of how Many losses we had in a row before we reached the TP1 level
Longest Winning streak is how many times after one win we had another wining trade meaning TP reached before a stop level based on the exit strategy
Longest losing streak is the amount of times we reached the SL level based on the exit strategy before reaching a TP level or the opposite flag depending on the setting based on exit strategy.
to hide the info panel you can set the statistics to Coming soon.
Alerts can be set on all the TP targets and Entries(Buy and Sell flag) as well as all the exit strategies.
Invisible FriendLooking into a question from user Alex100, i realized many people do want some kind of values displayed on chart when they hover the mouse over different bars.
As pinescript does not have any feature like pop up box, the only way is to plot a line and than see indicator values at top left. So when mouse is moved around the value displayed changes. As we just need the value, we do not want to clutter the chart with another line.
Using display.none will hide the value from indicator value also
Using color.white will also color the indicator value to white, making it invisible
So the solution is very simple, and requires a bit of creativity. We create an invisible line, in any color we like :)
This indicator is a tutorial on how to display indicator values without the line showing up and also this can be implemented as displaying data for each bar on mouse hover.
-----
Check My Public Creations In The Meantime:
Buy Monday Exit Tuesday with StopLoss and TakeProfit
Close Combination Lock Style Visual Appeal Indicator
High-Low Box between Earnings with ability to Add Custom Boxes

Info BoxThis is not an indicator, it is just an example of how to show an information box on the graph. It has also been used by Kıvanç Özbilgiç and zzzcrypto123 in screener indicators.

Time Range StatisticsA good amount of users requested a text box showing various price statistics, the following script returns various of these stats in a user-selected range, and include classical ones such as a central tendency measurement (mean), dispersion (normalized range) and percent change, but also include less common statistics such as average traded volume and number of gaps. The script also calculates the correlation between the closing price and another user-selected instrument.
The script is currently the longest one I ever made and took some efforts, as I wasn't satisfied with the statistics to be originally included. Big thx to Gael for the enormous feedback and the idea of the normalized range, to user @Cookiecrush for the feedback ( without ya I would have posted something bad you know umu ? ), and Lulidolce for the support, friendship is magic!
Selected Range
The setting Start determine the bar at which the range starts, while End determine at which bar the range end. To help you select these values, the current bar number (bar index) is displayed at the right of the indicator title in blue.
The setting evaluate to last bar will use a range starting at Start and ending at the last bar, as such you can use a full range by using Start = 0 and select evaluate to last bar
The range is highlighted by an area on the chart. By default Start = 9000 and End = 10000, you might not have this amount of data in your chart, as such use the displayed bar index to select Start and End, then set the settings as default.
Displayed Statistics
The statistics panel is displayed on the right side of the last bar, the panel has 3 sections, a title section who shows the symbol ticker, timeframe, and overall trends represented by a chart emoji, the overall trends are determined by comparing the number of higher highs with the number of lower low.
Below are displayed the date ranges with time format: year/month/day/hour:minute.
The second section shows the general statistics. The first one is the mean, also represented by the orange line in the chart, the blue line displayed represent the highest price value in the range, while the red one represents the lowest price value.
The second stat is the normalized range, and determine how spread is the price in the user-selected range, why not the standard deviation? Because the standard deviation might return results varying widely depending on the scale of the closing price, you could get measures such as 0.0156 or 16 or even 56 depending on the instrument, as such using a normalized range can be more appropriate as it lays in a range of (0,1). Lower values indicate a low degree of price variation. Note that I still want to find another measure in the future.
The percentage change (or relative change) indicates at which percentage the price has increased or decreased, and is calculated by subtracting the closing at bar Start with the price at bar End , divided by the price at bar End , the result is then multiplied by 100.
The average traded volume calculate the mean of the volume in the selected range, I used the same format used by the original volume indicator for clarity.
Finally, the last stats of the section is the number of gaps, this stat is by default hidden. An up gap is detected when the open price is superior to the previous high, while a down gap is detected when the open price is inferior to the previous low, this allow to only retain significant gaps.
The last section of the indicator panel shows the correlation between the closing price and another instrument, by default GOOG, this correlation is also calculated within the user-selected range. Positive values indicate a positive relationship, that is the two instruments tend to move in the same direction. Negative values indicate a negative relationship, both instruments tend to move in a direction opposite to each other. Values closer to 1 or -1 indicate a stronger relationship, while values closer to 0 indicate no relationship.
In Summary
The script shows various stats, each calculated within a user-selected range, in general one would be more interested in how these stats might evolve with time, but checking them in a custom range can be quite interesting.
Thx for reading. umu

Total Bars [xdecow]This simple indicator shows the total number of bars on the graph.
It serves to see which broker has a longer history or if the chart has enough candles to perform backtests.

Live Mini Terminal 6 : Major U.S Indices Change DataThis script displays relative data changes occurring in the adjustable period and/or adaptive automatic period in US Major Indices.
It was inspired by the data terminals used by commercial traders.
Period selection can be adjusted in the menu.
This script uses the adaptive period algorithm used by Autonomous LSTM and Relativity scripts.
Or you can set the period manually from the menu.
For more information about adaptive period this script uses:
This script works only for 1 day (1D) and 1 week (1W) time frames.
The most efficient time frame is 1 week (1W) because of different time-zones .
Features
Value changes on a percentage basis (%)
Recently, due to increasing interest, the NQNACE index has been added.
Index descriptions are printed on the information panel.
Sentiment NYSE ARCA and AMEX indices added.
INSTRUMENTS
SP1! : S&P 500 Futures Index
DJI : Dow Jones Industrial Average Index
NDX : Nasdaq 100 Index
RUT : Russell 2000 Index
NYA : NYSE Composite Index
OSX : PHLX Oil Service Sector Index
HGX : PHLX Housing Sector Index
UTY : PHLX Utility Sector Index
SOX : PHLX Semiconductor Sector Index
SPSIBI : S&P Biotechnology Select Industry Index
XNG : NYSE ARCA Natural Gas Index
SPGSCI : S&P Goldman Sachs Commodity Index
XAU : PHLX Gold and Silver Sector Index
SPSIOP : S&P Oil and Gas Exploration and Production Select Industry Index
GDM : NYSE ARCA Gold Miners Index
DRG : NYSE ARCA Pharmaceutical Index
TOB : NYSE ARCA Tobacco Index
DFI : NYSE ARCA Defense Index
NWX : NYSE ARCA Networking Index
XCI : NYSE ARCA Computer Technology
XOI : AMEX Oil Index
XAL : AMEX Airline Index
NQNACE : Nasdaq Yewno North America Cannabis Economy Index
USAGE
The script can be used as an indicator by putting it under the chart as shown above.
It is necessary to enlarge to see clearly.
Since it is not often looked at,such use is the best method for healthy interpretation.
Regards.

Live Mini Terminal 4 : G10 Developed Countries Change DataThis script displays relative data changes occurring in the adjustable period and/or adaptive automatic period in G10 Developed Countries against U.S Dollar.
Concept and design were inspired by the data terminals used by commercial traders.
Period selection can be set in the menu.
This script uses the adaptive period algorithm used by Autonomous LSTM and Relativity scripts.
Or you can set the period manually from the menu.
For more information about adaptive period:
This script works only for 1 day (1D) and 1 week (1W) time frames.
The most efficient time frame is 1 week (1W) because of countries' different time-zones .
Features
Value changes on a percentage basis (%)
10-year government bond yields of the countries are given in the information panel.
In the information panel, the percentage values of the 10-year interest rates of the countries according to the adaptive period or the standard adjustable period are given.
INSTRUMENTS
DXY : U.S Dollar Index
JPY : Japanese Yen
EUR : Euro
GBP : British Pound
AUD : Australian Dollar
NZD : New Zealand Dollar
CAD : Canadian Dollar
CHF : Swiss Franc
NOK : Norwegian Krone
SEK : Swedish Krona
Info Panel
NOTES :
* Germany was chosen because it had the most dominant and decisive economy for the Euro Zone.
* Swiss interests are generally not considered as they are minus and close to 0.
Info Panel List
US10Y : US Government Bonds 10 Year Yield (%) and percentage change over the specified period.
JP10Y : Japan Government Bonds 10 Year Yield (%) and percentage change over the specified period.
DE10Y : German Government Bonds 10 Year Yield (%) and percentage change over the specified period.
GB10Y : UK Government Bonds 10 Year Yield (%) and percentage change over the specified period.
AU10Y : Australia Government Bonds 10 Year Yield (%) and percentage change over the specified period.
NZ10Y : New Zealand Government Bonds 10 Year Yield (%) and percentage change over the specified period.
CA10Y : Canadian Government Bonds 10 Year Yield (%) and percentage change over the specified period.
NO10Y : Norway Government Bonds 10 Year Yield (%) and percentage change over the specified period.
SE10Y : Sweden Government Bonds 10 Year Yield (%) and percentage change over the specified period.
USAGE
The script can be used as an indicator by putting it under the chart as shown above.
It is necessary to enlarge to see clearly.
Since it is not often looked at,
such use is the best method for healthy interpretation.

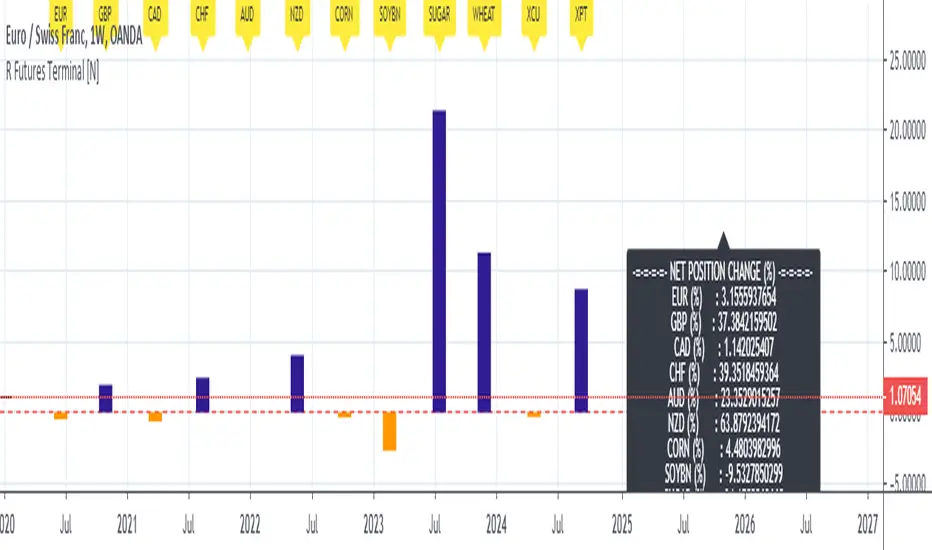
Live Mini Terminal 3 : Relative Forex & Futures Change DataThis script displays relative data changes occurring in the adjustable period and/or adaptive automatic period in the rest liquid futures.
It was inspired by the data terminals used by commercial traders.
Period selection can be set in the menu.
This script uses the adaptive period algorithm used by Autonomous LSTM and Relativity scripts.
Or you can set the period manually from the menu.
For more information about adaptive period:
This script works only for 1 day (1D) and 1 week (1W) time frames.
Since COT data is used, the most efficient time frame is 1 week (1W) .
Features
Value changes on a percentage basis (%)
Commitment of Traders position changes on a percentage basis :
Net position percentage is calculated as Short - Long and there is no inverse relationship.
Direct relationship is provided.
Due to the advantage of movement, future data were drawn instead of spot values on the required instruments.
The script provides the opportunity to comment on all major and minor Forex parities with liquid futures.
INSTRUMENTS
Euro Futures (EURUSD)
British Pound Futures (GBPUSD)
Canadian Dollar Futures (CADUSD)
Swiss Franc Futures (CHFUSD)
Australian Dollar Futures (AUDUSD)
New Zealand Dollar Futures (NZDUSD)
Corn Futures
Soybeans Futures
Sugar Futures
Wheat Futures
Copper Futures (XCU)
Platinum Futures (XPT)
Position Change InfoPanel
Position definition for the related instruments and data were taken and the calculations were made.
USAGE
The script can be used as an indicator by putting it under the chart as shown above.
It is necessary to enlarge to see clearly.
Since it is not often looked at, such use under chart is the best method for healthy interpretation.
Regards.
Live Mini Terminal 2 : Relative USD Based Stock Markets Change This script displays relative data changes occurring in the adjustable period and/or adaptive automatic period in various stock markets.
It was inspired by the data terminals used by commercial traders.
Period selection can be set in the menu.
This script uses the adaptive period algorithm used by Autonomous LSTM and Relativity scripts.
Or you can set the period manually from the menu.
For more information about adaptive period this script uses:
This script works only for 1 day (1D) and 1 week (1W) time frames.
The most efficient time frame is 1 week because of different time-zones (1W) .
Features
Value changes on a percentage basis (%)
Stock exchange values are calculated in dollar terms.
Due to the advantage of movement, future data were chosen instead of spot values on the required instruments.
INSTRUMENTS
Usa : S&P 500 Futures
Japan: Nikkei 225 Futures
England: United Kingdom (FTSE) 100
Australia: Australia 200
Canada: S&P / TSX Composite
Switzerland: Swiss Market Index
New Zealand: NZX 50 Index
China: SSE Composite (000001)
Denmark: OMX Copenhagen 25 Index
Hong-Kong: Hang Seng Index Futures
India: Nifty 50
Norway: Oslo Bors All Share Index
Russia: MOEX Russia Index
Sweden: OMX Stockholm Index
Singapore: Singapore 30
Turkey: BIST 100
South Africa: South Africa Top 40 Index
Spain: IBEX 35
France: CAC 40
Italy: FTSE MIB Index
Netherlands: Netherlands 25
Germany : DAX
USAGE
The script can be used as an indicator by putting it under the chart as shown above.
It is necessary to enlarge to see clearly.
Since it is not often looked at,such use is the best method for healthy interpretation.

Live Mini Terminal 1 : Relative General Data ChangeThis script displays relative data changes occurring in the adjustable period and/or adaptive automatic period in various markets.
It was inspired by the data terminals used by commercial traders.
Period selection can be set in the menu.
This script uses the adaptive period algorithm used by Autonomous LSTM and Relativity scripts.
Or you can set the period manually from the menu.
For more information about adaptive period this script uses:
This script works only for 1 day (1D) and 1 week (1W) time frames.
Since COT data is used, the most efficient time frame is 1 week (1W) .
Features
Value changes on a percentage basis (%)
Commitment of Traders position changes on a percentage basis :
Net position percentage is calculated as Short - Long and there is no inverse relationship.
Direct relationship is provided.
Due to the advantage of movement, future data were drawn instead of spot values on the required instruments.
INSTRUMENTS
US10Y : U.S Government Bonds 10 Year Yields
VIX : CBOE Volatility Index (S&P 500 VIX )
GOLD : XAUUSD : Gold
WTI : West Texas Intermediate : USOIL , Crude Oil
BCO : Brent Crude Oil : UKOIL , Light Crude Oil
SP500 : S&P 500 Index
DXY : US Dollar Index
TIO : Iron Ore : Iron Ore %62 Fe CFR China Futures
XAG : SI : Silver
NG : Natural Gas
JPYUSD : Japanese Yen
EURUSD : Euro/Dollar
Position Change InfoPanel
10 US T-Bond positions are used because there is no position equivalent in US10Y.
In other instruments, the corresponding position provisions are written and their changes are calculated.
USAGE
The script can be used as an indicator by putting it under the chart as shown above.
It is necessary to enlarge to see clearly.
Since it is not often looked at,
such use is the best method for healthy interpretation.

Candle Price Info PanelSimple info panel to show highest and lowest price in # of candles + price difference percentage.

Bitcoin Prices InfoPanelHello traders
This script is based on the great Ricardo Santos InfoPanel script
It will display all the Bitcoin prices
The script is public so you can adjust according to your own needs
PS
You might have to scroll right on your chart to see the panel
Enjoy :)
Dave
